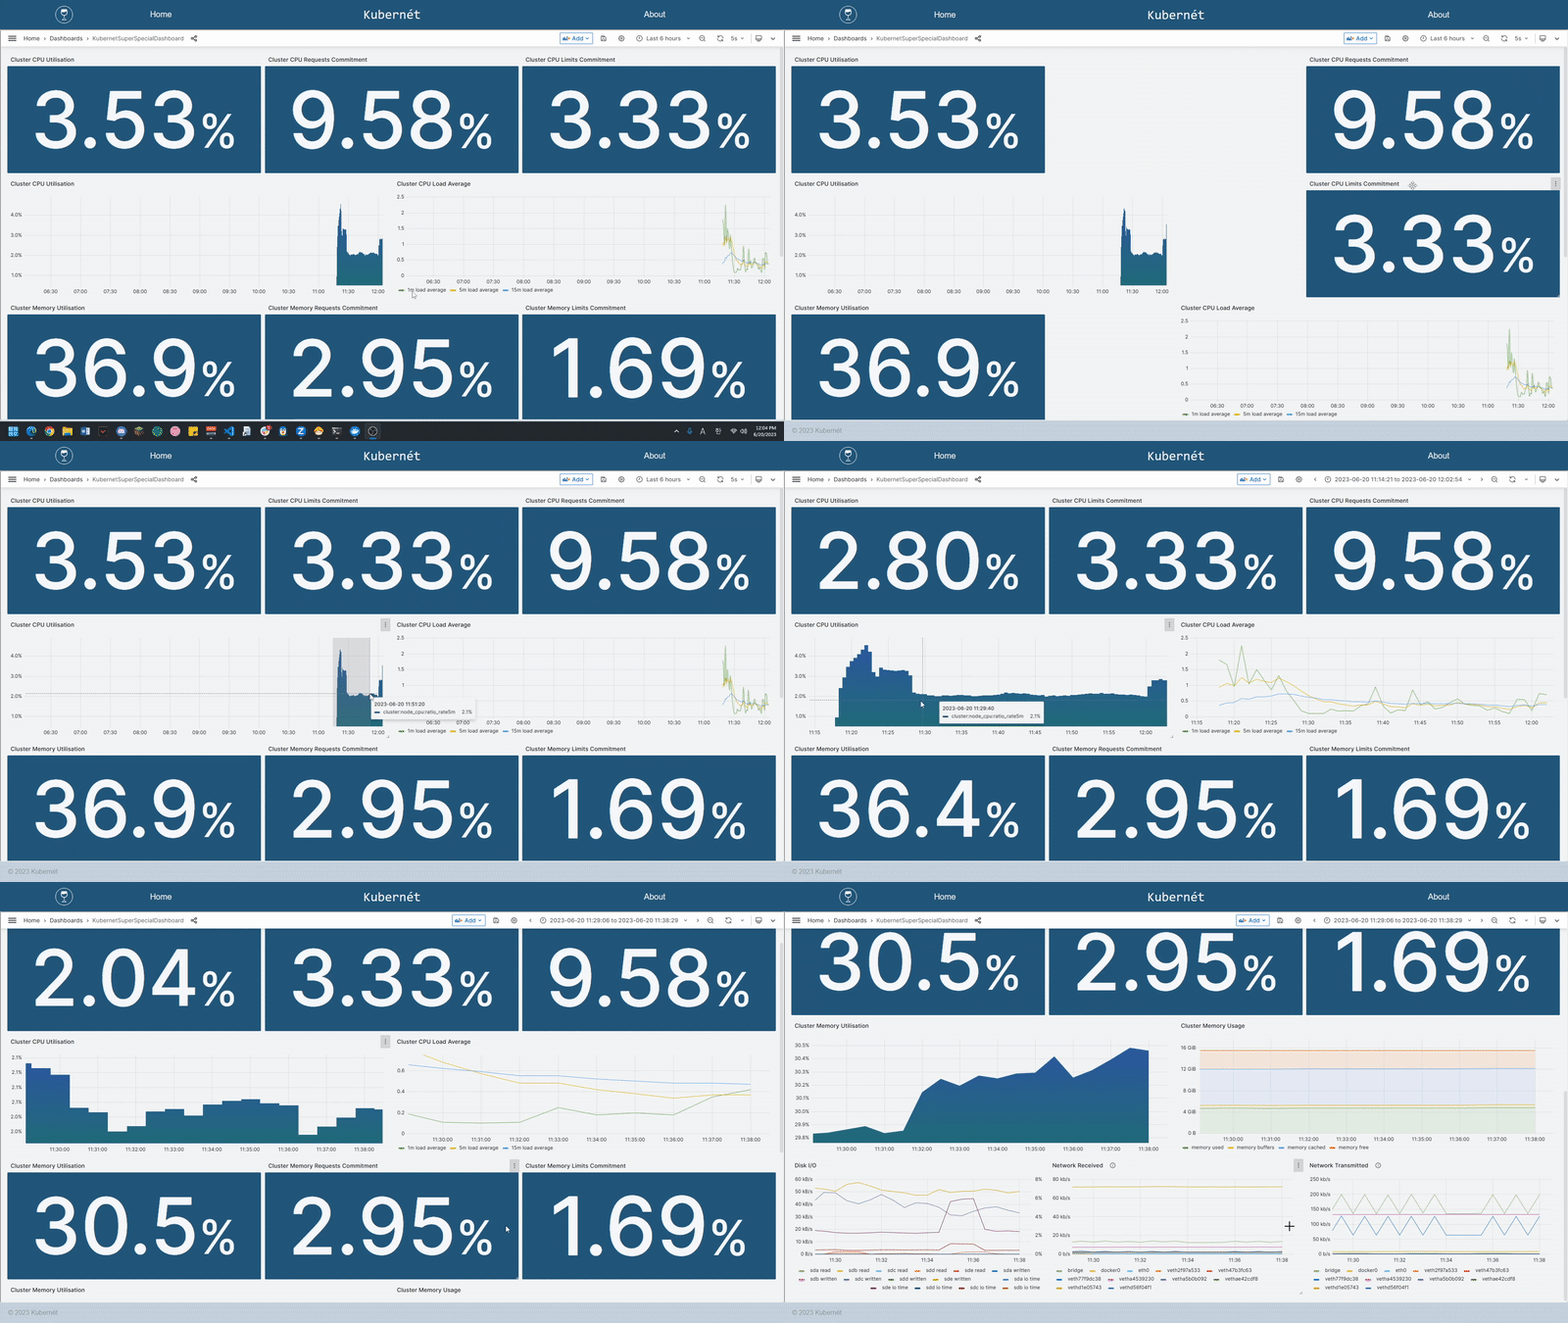
Kubernét is a user-friendly solution for effortlessly visualizing and monitoring your Kubernetes metrics in real-time. No coding or technical expertise needed! Through the intuitive interface, Kubernét simplifies the complex task of tracking and analyzing your K8s cluster metrics.
Before using our application, be sure to have your kubernetes cluster running and have installed helm.
- If you have not installed helm before, install helm from here.
To get started with opening the web application, first pull this repo onto your machine. In order to have the application work, you will need to create an .env file to store your mongo-URI. within your .env file please type the following:
MONGO_URI = '<mongodb URI>';Once that file is created, open the terminal and install all the packages with
npm installthen type in
npm startOn your browser, localhost:8080 should appear, and you are now running our application!
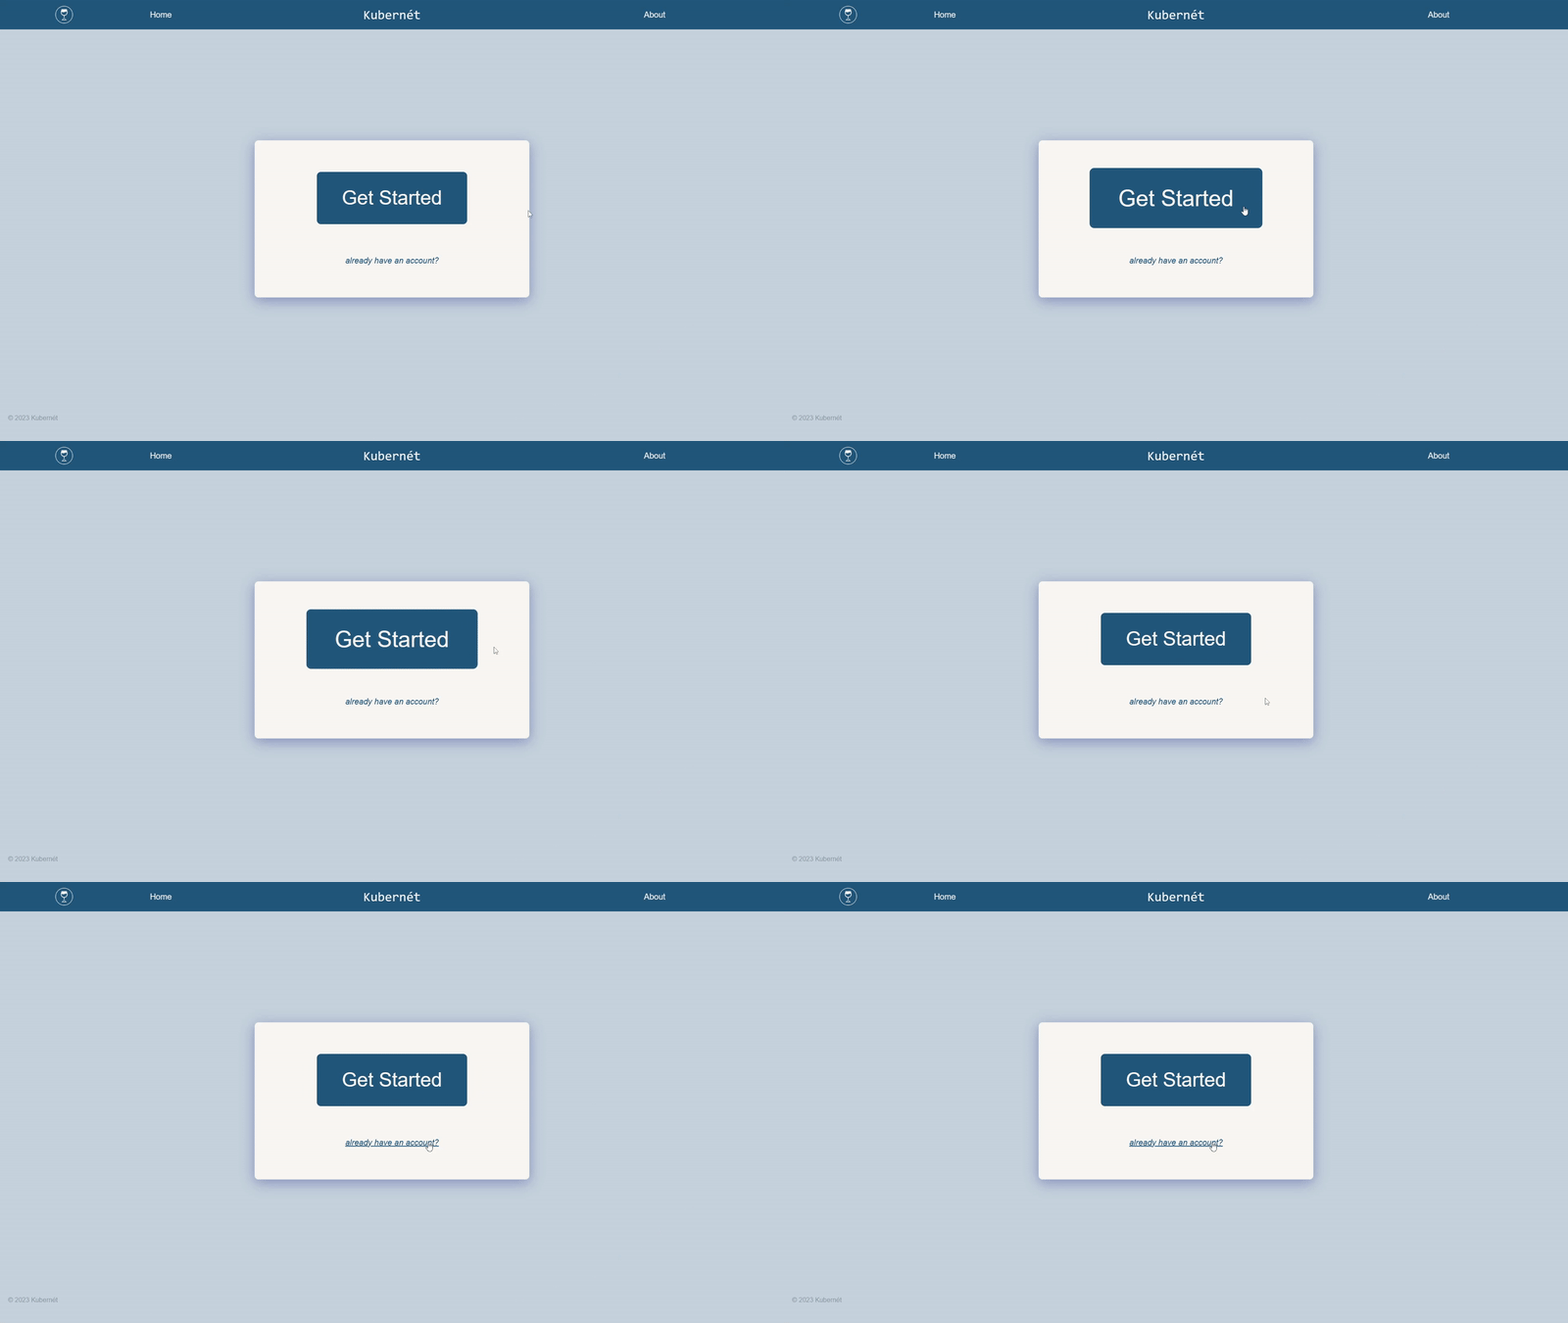
If this is your first time using the application hit the Get Started button. If you have an account with the application already, hit the already have an account button.
Once you type in your username and password, the application will direct you to login. Make sure the username you are inputting is unique!
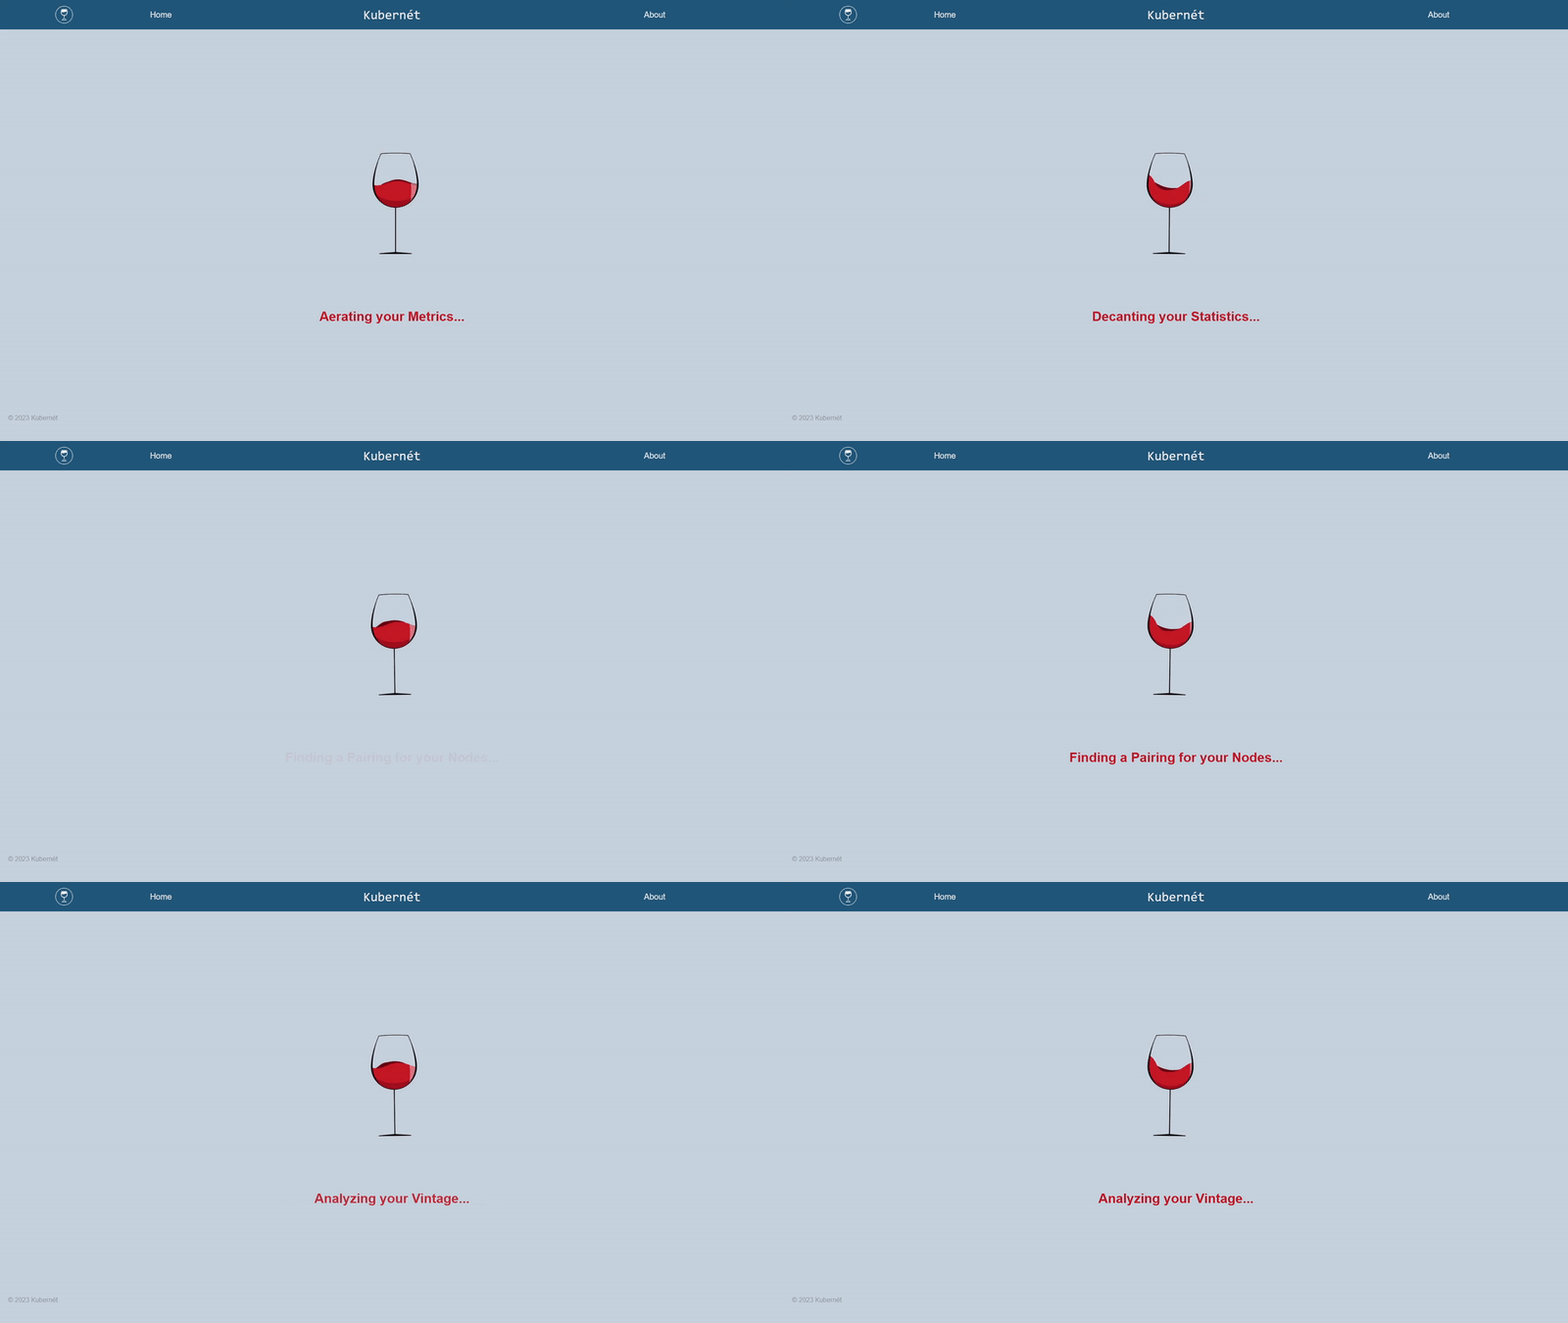
After typing in your credentials, our application will begin the process of install Prometheus and Grafana onto your Kubernetes cluster through helm and apply our custom .yaml files.
The dashboard will be saved onto your profile and be displayed on the application.
Your cluster metrics are now visible in real-time and update automatically! Feel free to move around the dashboard and customize the panel layout!

The application requires several default port configurations, so be sure not to populate these ports!
| Port | Application |
|---|---|
| 9090 | Prometheus |
| 8080 | Kubernét |
| 3000 | Grafana |
| 5050 | Express |
As this is a free open source product, we would love having your feedback through opening issues, and contributions. If you would like to contribute to this open source project,
- Clone our repo and create a new branch:
git checkout -b <Feature Branch Name>- Make changes, and run test
npm run testYou should see this:
Be sure that your server is running at the time in order for the back-end tests to pass.
- Submit a pull request with clear descriptions of changes made. One of our team members will look at it as soon as possible to approve your PR.
| Features | Status |
|---|---|
| Automatic Prometheus Integration | ✅ |
| Automatic Grafana Integration | ✅ |
| Custom Grafana .yaml installation | ✅ |
| Custom Dashboard Creation | ✅ |
| User Data Encryption | ✅ |
| Implement RTL + Jest front-end testing | ✅ |
| Implement Supertest back-end testing | ✅ |
| Full Typescript conversion | ✅ |
| Standalone application | ⏳ |
| Alerting System | 🙏🏻 |
| Individual node health visualizer | 🙏🏻 |
| Cluster visualization | 🙏🏻 |
- ✅ = Ready
- ⏳ = In progress
- 🙏🏻 = Looking for contributors
 Paul Lee |
 Jimmy Tran |
 Joseph Caballero |
 Praise Emmanuel |


