Analyze and visualize the performance of SQL queries
Analyze & Visualize Now »
Report Bug
·
Request Feature
Table of Contents
QueryFlow is a web application that securely highlights and visualizes how long a client's queries to a relational database take to complete. With these insights into the performance of an application's backend queries, developers can set data-backed thresholds with the queryflow.js NPM package, such that queries slower than a set threshold will be stored in a cache database. The NPM package automates the storage and retrieval of slow result sets from relational databases into a cache database.
Please visit: www.query-flow.com
-
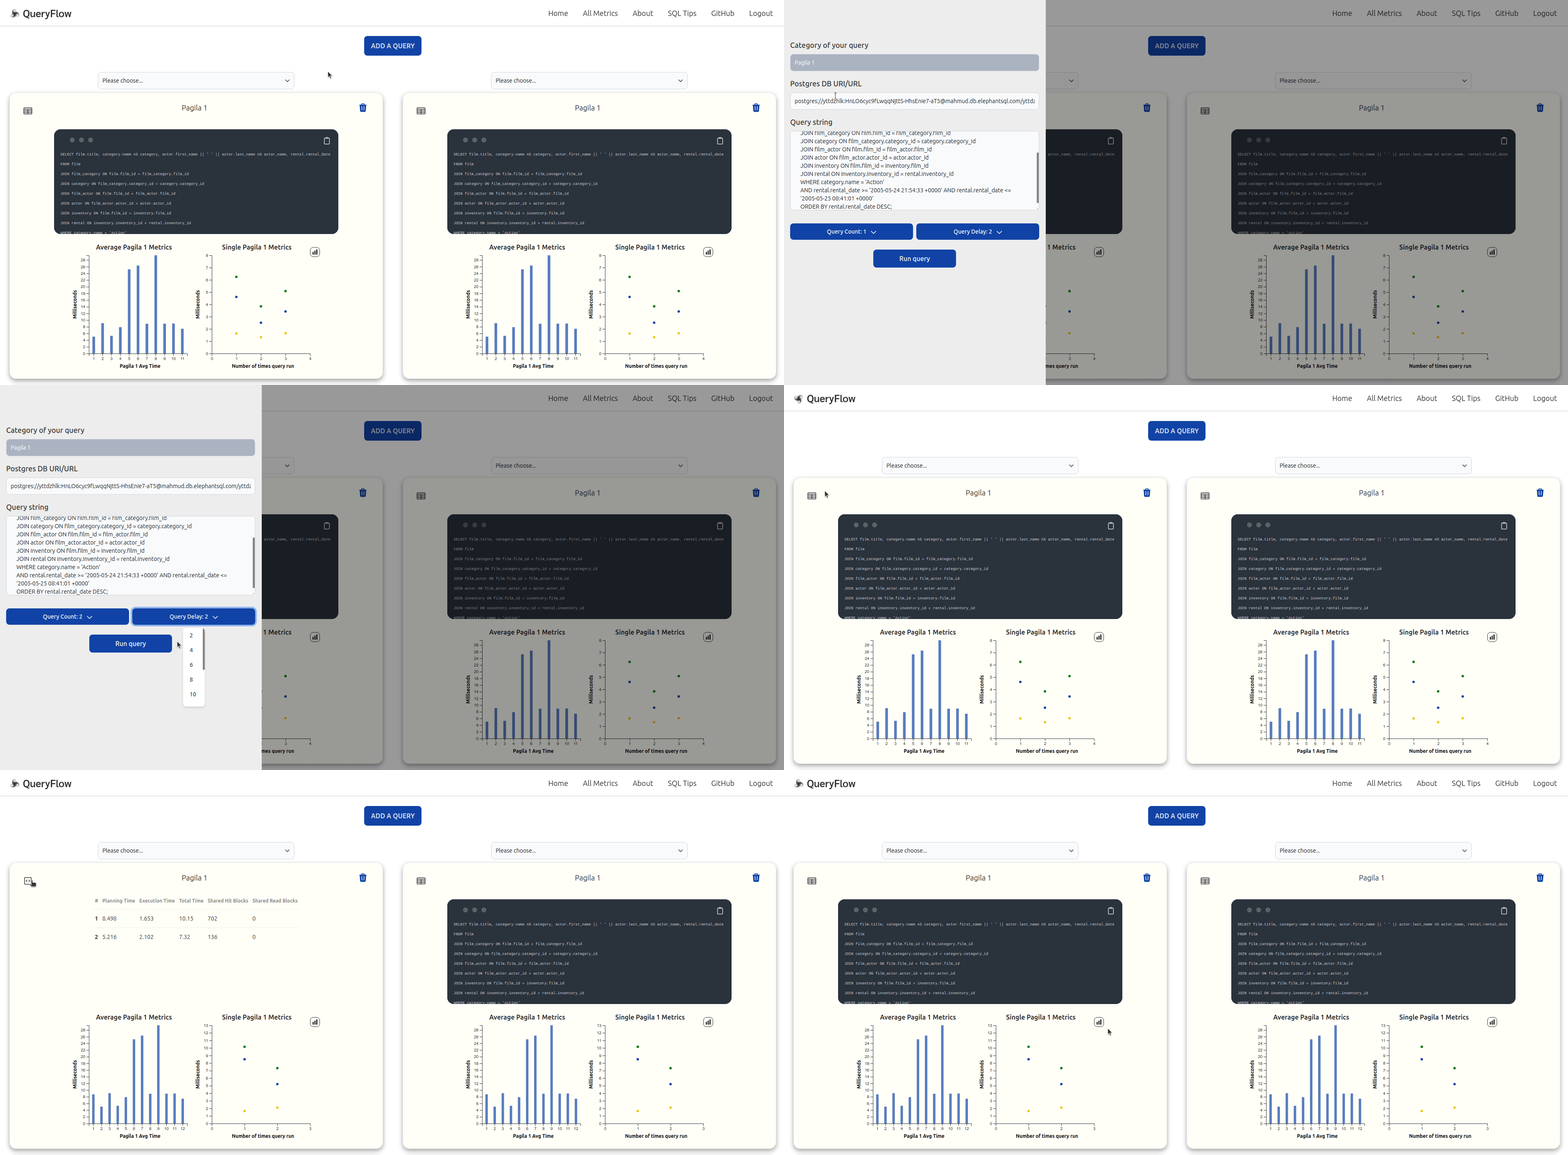
After creating an account or logging in with your Gmail account, analyze a SQL query by clicking the blue 'ADD A QUERY' button.
-
Enter the category of your query, the database URI (not saved), the query string, the number of query iterations used to calculate the average performance and the delay between each of the iterations. Click 'Run Query'.
-
The QueryFlow logo in the top left corner will spin until the query analysis is complete. The analysis for each query will appear in an individual component.
-
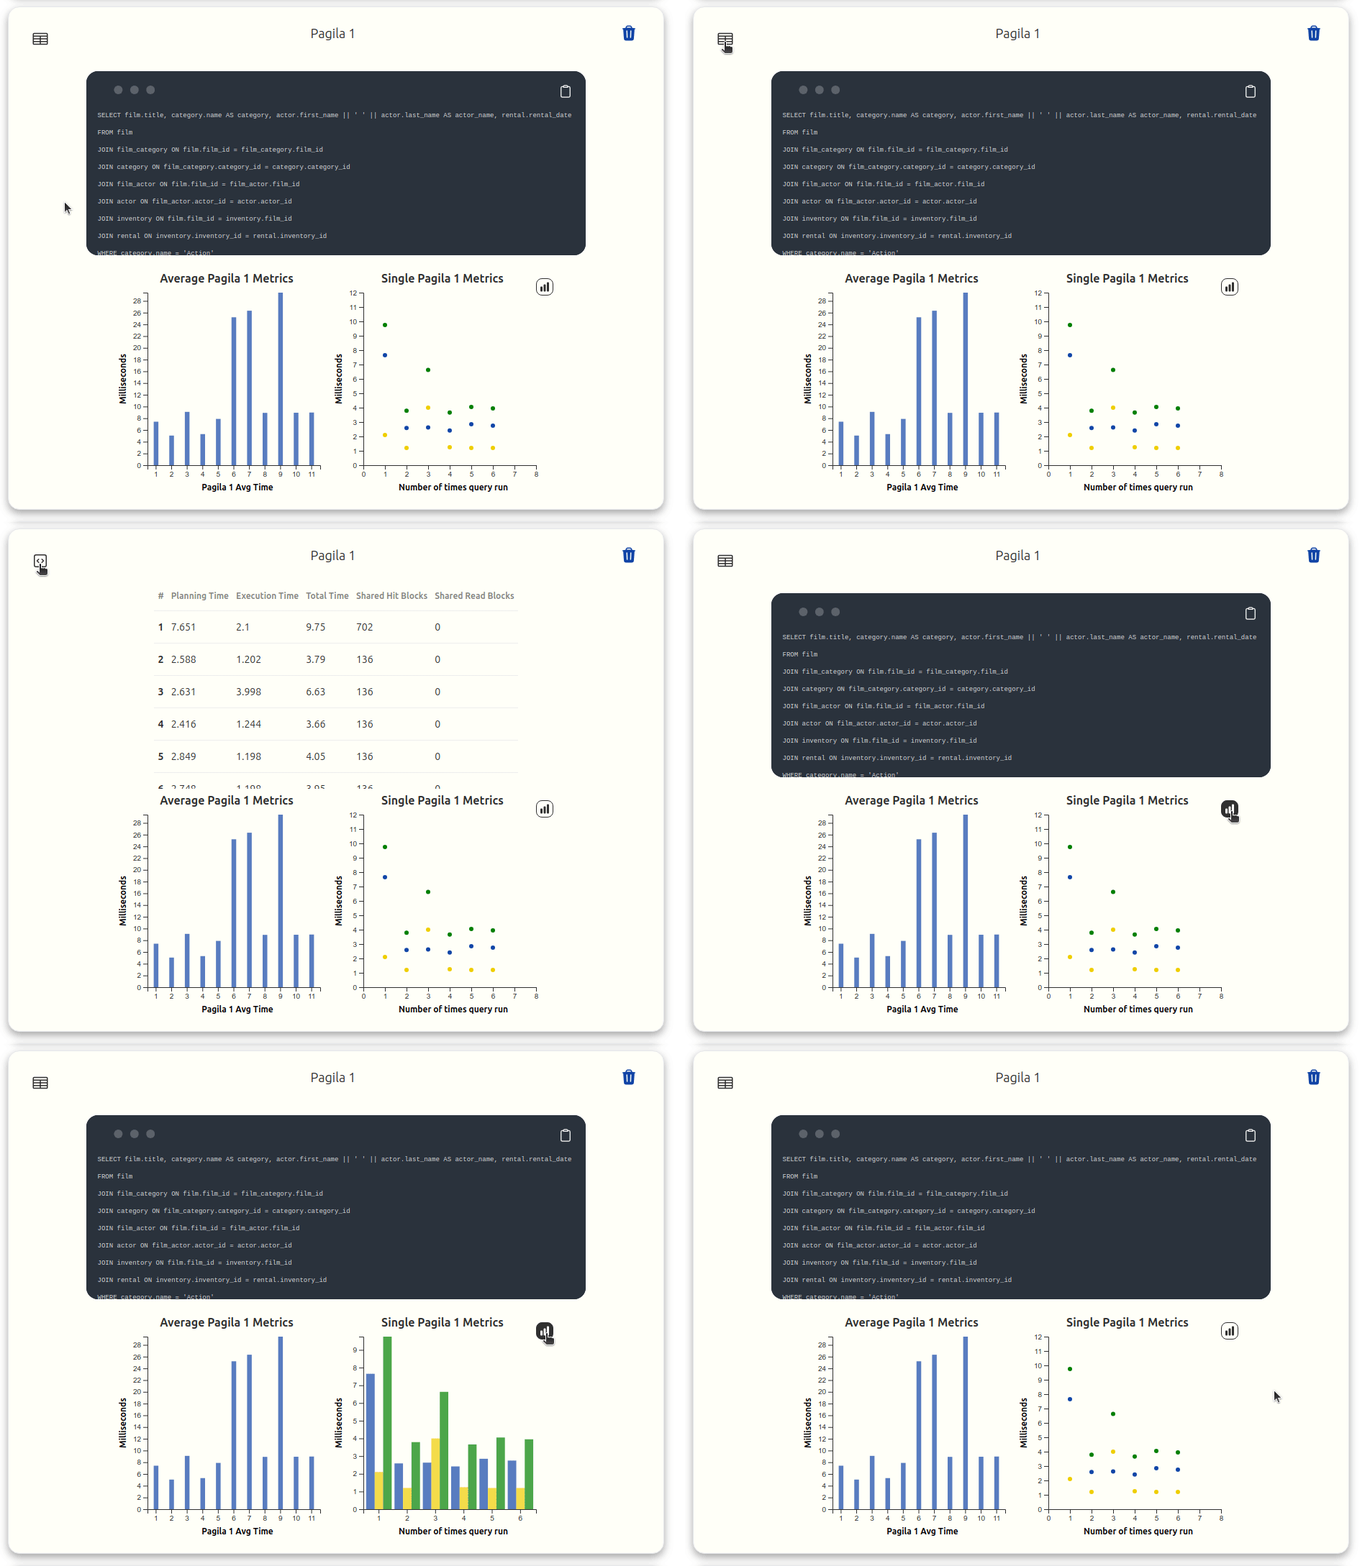
Within each query's component, toggle between the query string used and a table of the performance of each iteration of the query. A bar chart shows the average speed for each time "Run Query" was executed for a particular query name. The scatter plot shows the most recent time "Run Query" was executed, with speeds (planning time, execution time, total time) for each iteration that contributes to the average time.
-
A dropdown menu at the top of the components allow you to select past queries for a side-by-side comparison. If you no longer need a particular query, there is a trashcan button to delete that particular query analysis.
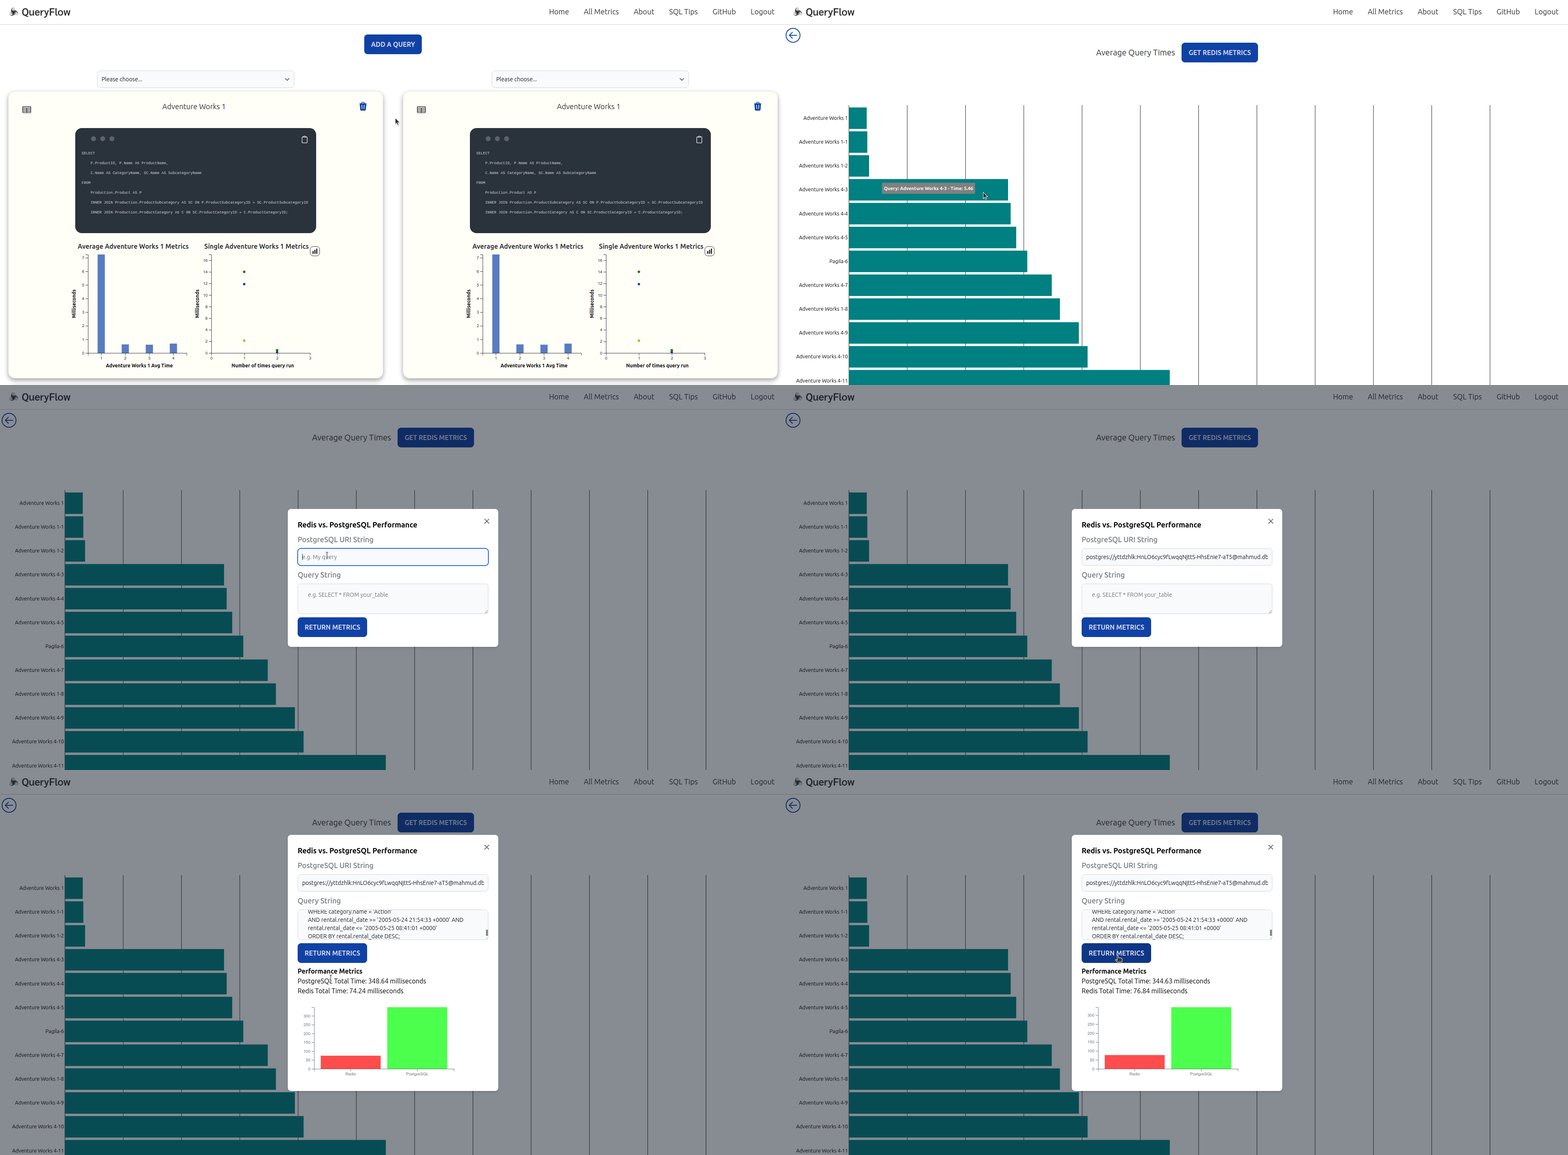
- The navigation bar at the top contains the 'All Metrics' page, which shows the average query times of all the different queries run. Furthermore, you can compare the performance of these queries with a Redis database by clicking the "GET REDIS METRICS" button on this page.
Contributions are what make the open source community such an amazing place to learn, inspire, and create. Any contributions you make are greatly appreciated.
If you have a suggestion that would make this better, please fork the repo and create a pull request. You can also simply open an issue with the tag "enhancement". Don't forget to give the project a star! Thanks again!
- Fork the Project
- Create your Feature Branch (
git checkout -b feature/AmazingFeature) - Commit your Changes (
git commit -m 'Add some AmazingFeature') - Push to the Branch (
git push origin feature/AmazingFeature) - Open a Pull Request
See the open issues for a full list of proposed features (and known issues).
Email - queryflow58@gmail.com
Twitter - @Query_Flow
LinkedIn - Team Page
- Vivek Patel - GitHub - LinkedIn
- Niko Amescua - GitHub - LinkedIn
- Ryan Campbell - GitHub - LinkedIn
- Philip Brown - GitHub - LinkedIn
- George Greer - GitHub - LinkedIn
The Team wholeheartedly thanks Chris Suzukida for his mentorship and support throughout the development of this project.
Here are his links!
Distributed under the MIT License. See LICENSE.txt for more information.


