React Performance Tool
Nominated for React Open Source Awards 2020
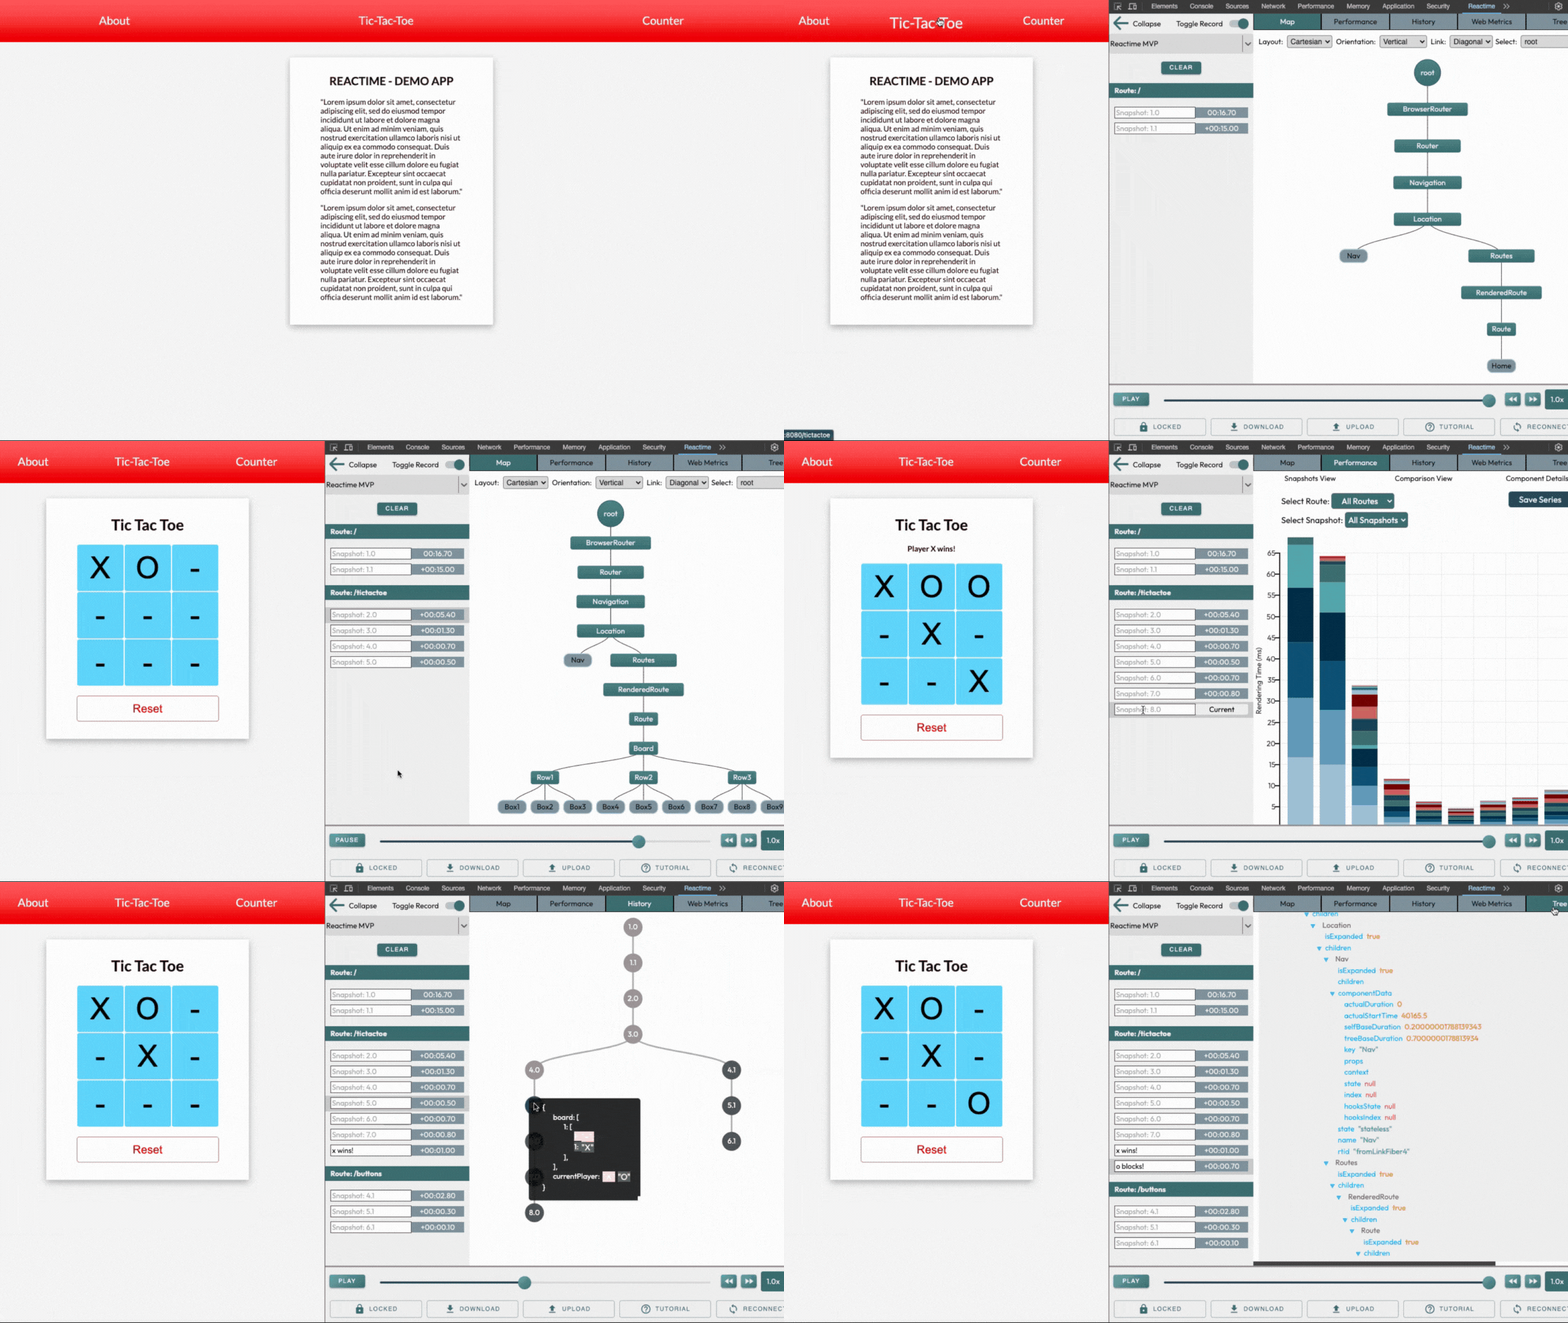
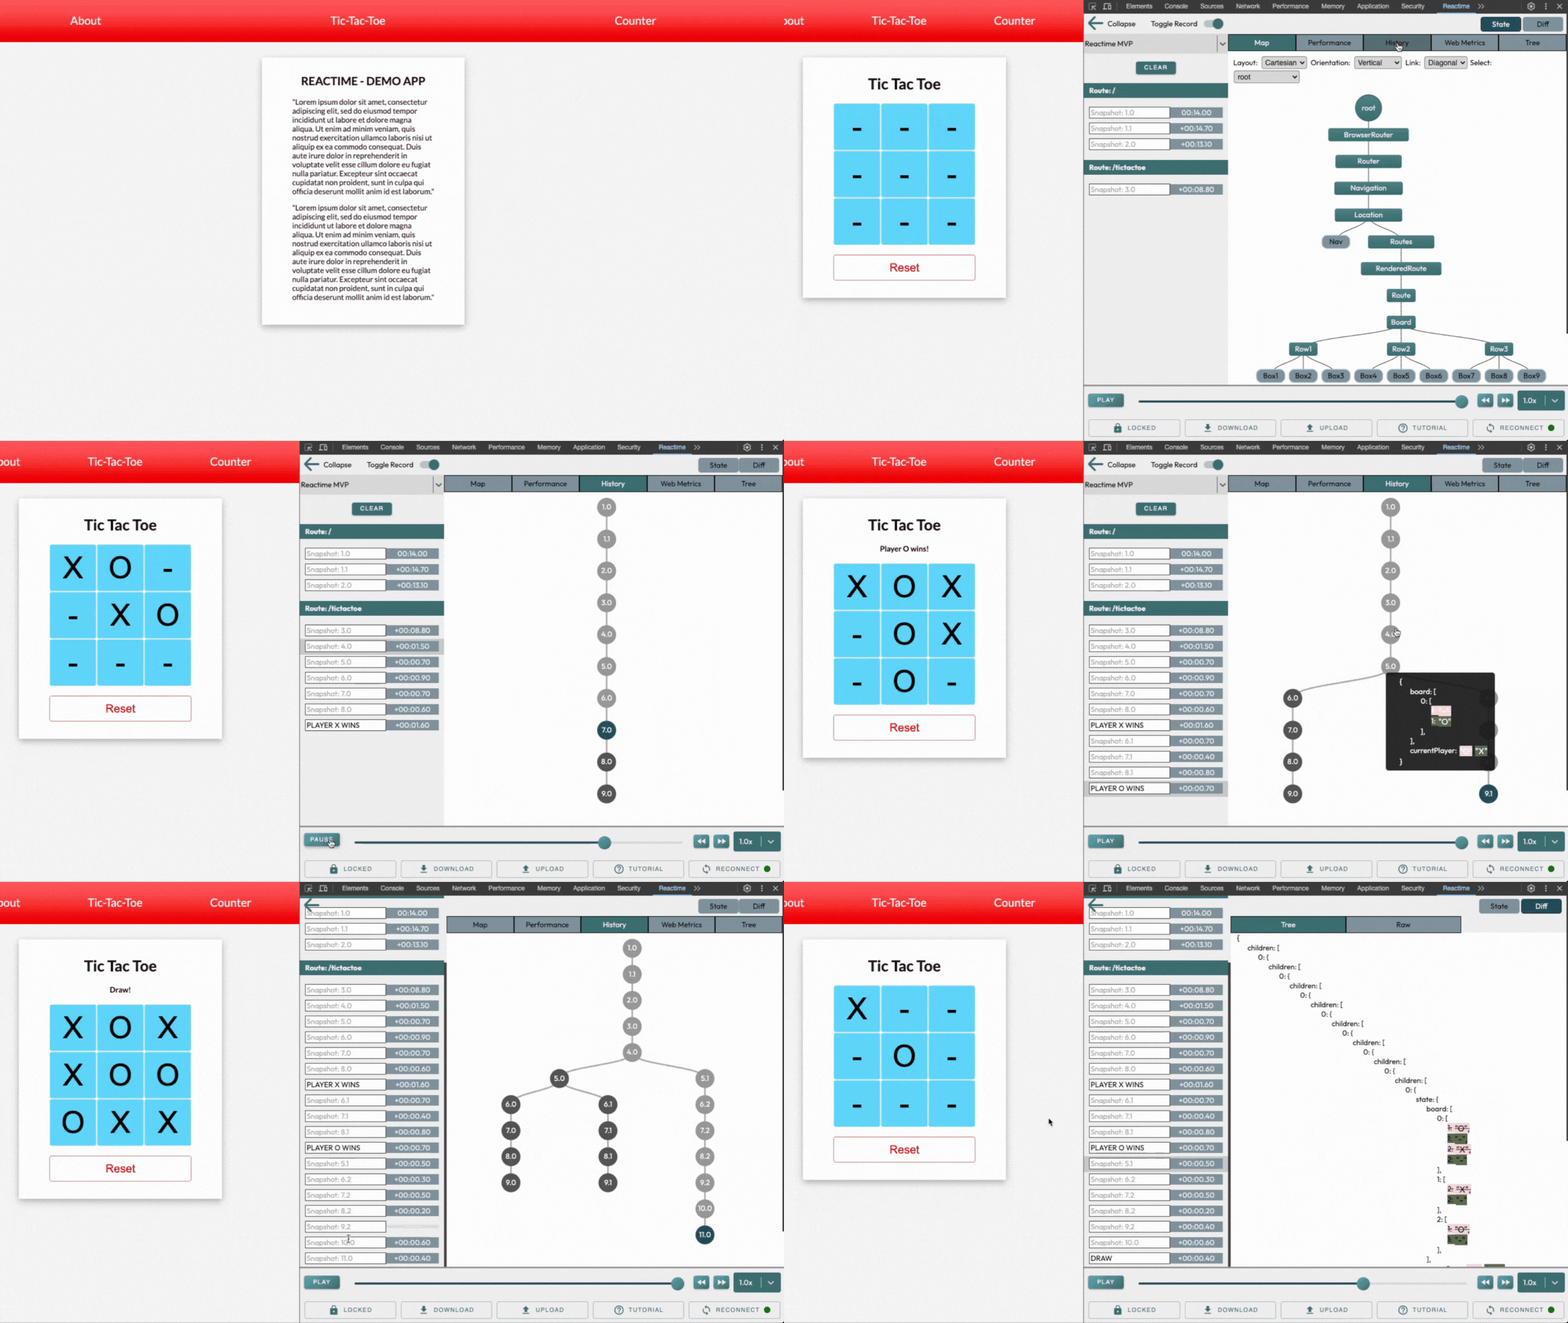
Reactime is an open-source Chrome developer tool for time travel debugging and performance monitoring in React applications. Reactime enables developers to record snapshots of application state, jump between and inspect state snapshots, and monitor performance metrics such as component render time and render frequency.
You can view your application's file structure and click on a snapshot to view
your app's state. State can be visualized in a Component Graph, JSON Tree, or
Performance Graph. Snapshot history can be visualized in the History tab.
The Web Metrics tab provides some useful metrics for site performance. The accessibility tab
visualizes an app's accessibility tree per state change.
Snapshots can be compared with the previous snapshot, which can be viewed in Diff mode.
Whenever the state is changed (whenever setState, useState is called), this
extension will create a snapshot of the current state tree and record it. Each
snapshot will be displayed in Chrome DevTools under the Reactime panel.
You can save a series of state snapshots and use it to analyze changes in
component render performance between the current and the previous series of snapshots.
You can also name specific snapshots and compare all snapshots with the same
name.
When toggled to a specific snapshot, a visualization of the individual
components of the snapshot will be displayed. This can be done under the same
Performance tab where the snapshots are rendered. You will also find details of
each component upon hovering.
Download the recorded snapshots as a JSON file and upload them to access state trees across different sessions.
If Reactime loses its connection to the tab you're monitoring, simply click the "reconnect" button to resume your work. You'll notice a circle located to the right of the button, which will appear as either red (indicating disconnection) or green (signifying a successful reconnection).
One of the most common issues that affects performance in React is unnecessary
render cycles. This problem can be fixed by checking your renders in the
Performance tab in Chrome DevTools under the Reactime panel.
Using the actions sidebar, a user can jump to any previously recorded snapshots.
Hitting the jump button on any snapshot will allow a user to view state data at
any point in the history of the target application.
Reactime offers full support for Gatsby applications. You would be able to
identify unnecessary renders, duration of each rendering, travel-debugging
features and visual representation of the tree components.
Reactime offers debugging and performance tools for Next.js apps: time-traveling
debugging, preventing unnecessary component re-renders and making your
application faster.
Reactime offers debugging and performance tools for Remix apps (in beta). Support still
needs to be added for multi-route time traveling. Every other feature works.
Reactime offers support for TypeScript applications using stateful class
components and functional components. Further testing and development is
required for custom hooks and Concurrent Mode.
After cloning this repository, developers can simply run npm run docs at the
root level and serve the dynamically generated /docs/index.html file on a
browser. Doing so will provide a readable, extensible, and interactive GUI view
of the structure and interfaces of the codebase.
- In-app tab-specific tutorial walkthroughs
- Hover over a component to view tooltip details on state visualizations
- Double-click to collapse child components
- Click to focus on a portion of the component map
- A dropdown to support the development of projects on multiple tabs
- Intuitive navigation between state snapshots
- Locked/unlocked feature allowing temporary pause of state monitoring
- Prop visualization both in color and tickness of the branches of connecting the components
- Heatmap bar underneath the top menu
Reactime 25.0 includes a new prop visualization feature and heatmap bar for developers!
We also addressed the previously reported freezing issues on start and brought up the Jest Library in much better condition as it was before; from 20% of the tests working to more than 85% now working correctly.
Some of the UI was rearranged to be more aesthetically pleasing and render the main window bigger for the diplay of the component tree in the process.
If you would like to read more about previous releases, click here!
To get started, install the Reactime extension from Chrome Web Store.
After installing Reactime, you can test its functionalities with your React application in development mode.
Please note, the time jumping feature will ONLY work when your application is running in development mode. In production mode, you are able to view your application’s component map but no additional features.
NOTE: The React Developer Tools extension is also required for Reactime to run, if you do not already have it installed on your browser.
Go to Chrome Extensions (make sure Chrome Extension is in Developer Mode) for
manual installation in (https://developer.chrome.com/extensions/faq#faq-dev-01)
and click on Load Unpacked. Use src/extension/build/ to load this extension.
Turn on 'Allow access to file URLs' in the extension details page if testing
locally.
Please refer to Developer Install for a detailed guide:
Refer to the DEVELOPER README for more info on the project, and instructions on building from source.
After installing the Chrome extension, just open up your project in the browser.
Then right click on your application and choose the 'Reactime' context menu item to open up a Reactime panel.
Alternatively, you can open up your Chrome DevTools and navigate to the Reactime panel.
Reactime initially runs using the dev tools global hook from the Chrome API. It takes time for Chrome to load this. Try refreshing your application a couple of times until you see Reactime running.
Reactime works in tandem with the React Developer Tools to access a React application's Fiber tree; under the hood, Reactime traverses the Fiber tree through the React Developer Tool's global hook, pulling all relevant information needed to display to the developer
Try refreshing the application you want to test and refresh the DevTools by clicking the right mouse button “Reload frame”.
Reactime is an open-source project, and we'd love to hear from you about improving the user experience. Please read DEVELOPER README, and create a pull request (or issue) to propose and collaborate on changes to Reactime.
With the release of Node v18.12.1(LTS) on 11/4/22, the script has been updated to
'npm run dev' | 'npm run build' for backwards compatibility.
For version
Node v16.16.0, please use script 'npm run devlegacy' | 'npm run buildlegacy'
- Haider Ali - @hali03
- Jose Luis Sanchez - @JoseSanchez1996
- Logan Nelsen - @ljn16
- Mel Koppens - @MelKoppens
- Amy Yang - @ay7991
- Eva Ury - @evaSUry
- Jesse Guerrero - @jguerrero35
- Oliver Cho - @Oliver-Cho
- Ben Margolius - @benmarg
- Eric Yun - @ericsngyun
- James Nghiem - @jemzir
- Wilton Lee - @wiltonlee948
- Louis Lam - @llam722
- Samuel Tran - @leumastr
- Brian Yang - @yangbrian310
- Emin Tahirov - @eminthrv
- Peng Dong - @d28601581
- Ozair Ghulam - @ozairgh
- Christina Or - @christinaor
- Khanh Bui - @AndyB909
- David Kim - @codejunkie7
- Robby Tipton - @RobbyTipton
- Kevin HoEun Lee - @khobread
- Christopher LeBrett - @fscgolden
- Joseph Park - @joeepark
- Kris Sorensen - @kris-sorensen
- Daljit Gill - @dgill05
- Ben Michareune - @bmichare
- Dane Corpion - @danecorpion
- Harry Fox - @StackOverFlowWhereArtThou
- Nathan Richardson - @BagelEnthusiast
- David Bernstein - @dangitbobbeh
- Joseph Stern - @josephiswhere
- Dennis Lopez - @DennisLpz
- Cole Styron - @colestyron
- Ali Rahman - @CourageWolf
- Caner Demir - @demircaner
- Kevin Ngo - @kev-ngo
- Becca Viner - @rtviner
- Caitlin Chan - @caitlinchan23
- Kim Mai Nguyen - @Nkmai
- Tania Lind - @lind-tania
- Alex Landeros - @AlexanderLanderos
- Chris Guizzetti - @guizzettic
- Jason Victor - @theqwertypusher
- Sanjay Lavingia - @sanjaylavingia
- Vincent Nguyen - @VNguyenCode
- Haejin Jo - @haejinjo
- Hien Nguyen - @hienqn
- Jack Crish - @JackC27
- Kevin Fey - @kevinfey
- Carlos Perez - @crperezt
- Edwin Menendez - @edwinjmenendez
- Gabriela Jardim Aquino - @aquinojardim
- Greg Panciera - @gpanciera
- Nathanael Wa Mwenze - @nmwenz90
- Ryan Dang - @rydang
- Bryan Lee - @mylee1995
- Josh Kim - @joshua0308
- Sierra Swaby - @starkspark
- Ruth Anam - @nusanam
- David Chai - @davidchaidev
- Yujin Kang - @yujinkay
- Andy Wong - @andynullwong
- Chris Flannery - @chriswillsflannery
- Rajeeb Banstola - @rajeebthegreat
- Prasanna Malla - @prasmalla
- Rocky Lin - @rocky9413
- Abaas Khorrami - @dubalol
- Ergi Shehu - @Ergi516
- Raymond Kwan - @rkwn
- Joshua Howard - @Joshua-Howard
- Lina Shin - @rxlina
- Andy Tsou - @andytsou19
- Feiyi Wu - @FreyaWu
- Viet Nguyen - @vnguyen95
- Alex Gomez - @alexgomez9
- Edar Liu - @liuedar
- Kristina Wallen - @kristinawallen
- Quan Le - @blachfog
- Robert Maeda - @robmaeda
- Lance Ziegler - @lanceziegler
- Ngoc Zwolinski - @ngoczwolinski
- Peter Lam - @dev-plam
- Zachary Freeman - @zacharydfreeman
- Jackie Yuan - @yuanjackie1
- Jasmine Noor - @jasnoo
- Minzo Kim - @minzo-kim
- Mark Teets - @MarkTeets
- Nick Huemmer - @NickHuemmer
- James McCollough - @j-mccoll
- Mike Bednarz - @mikebednarz
- Sergei Liubchenko - @sergeylvq
- Yididia Ketema - @yididiaketema
- Morah Geist - @morahgeist
- Eivind Del Fierro - @EivindDelFierro
- Kyle Bell - @KyEBell
- Sean Kelly - @brok3turtl3
- Christopher Stamper - @ctstamper
- Jimmy Phy - @jimmally
- Andrew Byun - @AndrewByun
- Kelvin Mirhan - @kelvinmirhan
- Jesse Rosengrant - @jrosengrant
- Liam Donaher - @leebology
- David Moore - @Solodt55
- John Banks - @Jbanks123
This project is licensed under the MIT License - see the LICENSE file for details.


