Open-source engineering management that unlocks developer potential
Middleware is an open-source tool designed to help engineering leaders measure and analyze the effectiveness of their teams using the DORA (DevOps Research and Assessment) metrics. The DORA metrics are a set of four key values that provide insights into software delivery performance and operational efficiency.
They are:
- Deployment Frequency: The frequency of code deployments to production or an operational environment.
- Lead Time for Changes: The time it takes for a commit to make it into production.
- Mean Time to Restore: The time it takes to restore service after an incident or failure.
- Change Failure Rate: The percentage of deployments that result in failures or require remediation.
Table of Contents
- Integration with various CI/CD tools
- Automated collection and analysis of DORA metrics
- Visualization of key performance indicators
- Customizable reports and dashboards
- Integration with popular project management platforms
-
Ensure that you have docker installed and running.
-
Open the terminal and run the following command:
docker volume create middleware_postgres_data
docker volume create middleware_keys
docker run --name middleware \
           -p 3333:3333 \
           -v middleware_postgres_data:/var/lib/postgresql/data \
           -v middleware_keys:/app/keys \
           -d middlewareeng/middleware:latest
docker logs -f middleware
-
Wait for sometime for the services to be up.
-
The app shall be available on your host at http://localhost:3333.
-
In case you want to stop the container, run the following command:
docker stop middleware
-
In order to fetch latest version from remote and then starting the system, use following command:
docker pull middlewareeng/middleware:latest
docker rm -f middleware || true
docker run --name middleware \
           -p 3333:3333 \
           -v middleware_postgres_data:/var/lib/postgresql/data \
           -v middleware_keys:/app/keys \
           -d middlewareeng/middleware:latest
docker logs -f middleware
-
If you see an error like:
Conflict. The container name "/middleware" is already in use by container.
Then run following command before running the container again:docker rm -f middleware
Gitpod enables development on remote machines and helps you get started with Middleware if your machine does not support running the project locally.
If you want to run the project locally you can setup using docker or setup everything manually.
-
Click the button below to open this project in Gitpod.
-
This will open a fully configured workspace in your browser with all the necessary dependencies already installed.
After initialization, you can access the server at port 3333 of the gitpod instance.
If you don't have docker installed, please install docker over here. Make sure docker is running.
-
Clone the Repository:
git clone https://github.com/middlewarehq/middleware
-
Navigate to the Project Directory:
cd middleware -
Run
dev.shscript in the project root 🪄
./dev.shcreates a.envfile with required development environments and runs a CLI with does all the heavy lifting from tracking the container withdocker compose watchto providing you with logs from different services.
The usage is as follows:./dev.sh
You may update the
env.exampleand setENVIRONMENT=prodto run it in production setup.
Further if any changes are required to be made to ports, you may update thedocker-compose.ymlfile, accordingly. -
Access the Application: Once the project is running, access the application through your web browser at http://localhost:3333. Further, other services can be accessed at:
- The analytics server is available at http://localhost:9696.
- The sync server can be accessed at http://localhost:9697.
- The postgres database can be accessed at host:
localhost, port:5434, username:postgres, password:postgres, db name:mhq-oss. - The redis server can be accessed at host:
localhost, port:6385.
-
View the logs: Although the CLI tracks all logs, the logs of services running inside the container can be viewed in different terminals using the following commands:
Frontend logs
docker exec -it middleware-dev tail --lines 500 -f /var/log/web-server/web-server.logBackend logs
docker exec -it middleware-dev tail --lines 500 -f /var/log/apiserver/apiserver.logRedis logs
docker exec -it middleware-dev tail --lines 500 -f /var/log/redis/redis.logPostgres logs
docker exec -it middleware-dev tail --lines 500 -f /var/log/postgres/postgres.log
To set up middleware locally, follow these steps:
-
Clone the Repository:
git clone https://github.com/middlewarehq/middleware.git
-
Navigate to the Project Directory:
cd middleware -
Run Redis and Postgres Containers:
If you don't have docker installed, please install docker over here
Run the following commands to run Postgres and Redis using docker.
cd database-docker && docker-compose up -d
If you don't prefer Docker, you can choose to install Postgres and Redis manually.
Once you are done with using or developing Middleware, you can choose to close these running container. (NOTE: Don't do this if you are following this document and trying to run Middleware.)
cd database-docker/ docker-compose down -v -
Generate Encryption keys:
Generate encryption keys for the project by running the following command in the project root directory:
cd setup_utils && . ./generate_config_ini.sh && cd ..
-
Backend Server Setup
-
Install python version
3.11.6-
For this you can install python from over here if you don't have it on your machine.
-
Install pyenev
git clone https://github.com/pyenv/pyenv.git ~/.pyenv -
Add pyenv to your shell's configuration file (.bashrc, .bash_profile, .zshrc, etc.):
echo 'export PYENV_ROOT="$HOME/.pyenv"' >> ~/.bashrc
echo 'export PATH="$PYENV_ROOT/bin:$PATH"' >> ~/.bashrc
-
Reload your shell:
source ~/.bashrc
-
-
Move backend directory to create a virtual environment
cd backend python -m venv venv -
Activate virtual environment
. venv/bin/activate -
Install Dependencies
pip install -r requirements.txt -r dev-requirements.txt
-
Create a
.env.localfile in the/backenddirectory and add the following environment variables, replacing the values with your own if needed:DB_HOST=localhost DB_NAME=mhq-oss DB_PASS=postgres DB_PORT=5434 DB_USER=postgres REDIS_HOST=localhost REDIS_PORT=6385 ANALYTICS_SERVER_PORT=9696 SYNC_SERVER_PORT=9697 -
Start the backend servers
-
Change Directory to analytics_server
cd analytics_server -
For backend analytics server:
flask --app app --debug run --port 9696
-
For backend sync server:
flask --app sync_app --debug run --port 9697
NOTE: Open this sync sever in a new terminal window after activating the virtual environment only after starting analytics server.
-
-
-
Web Server Setup
-
Access the Application: Once the project is running, access the application through your web browser at http://localhost:3333.
Additionally:- The analytics server is available at http://localhost:9696.
- The sync server can be accessed at http://localhost:9697.
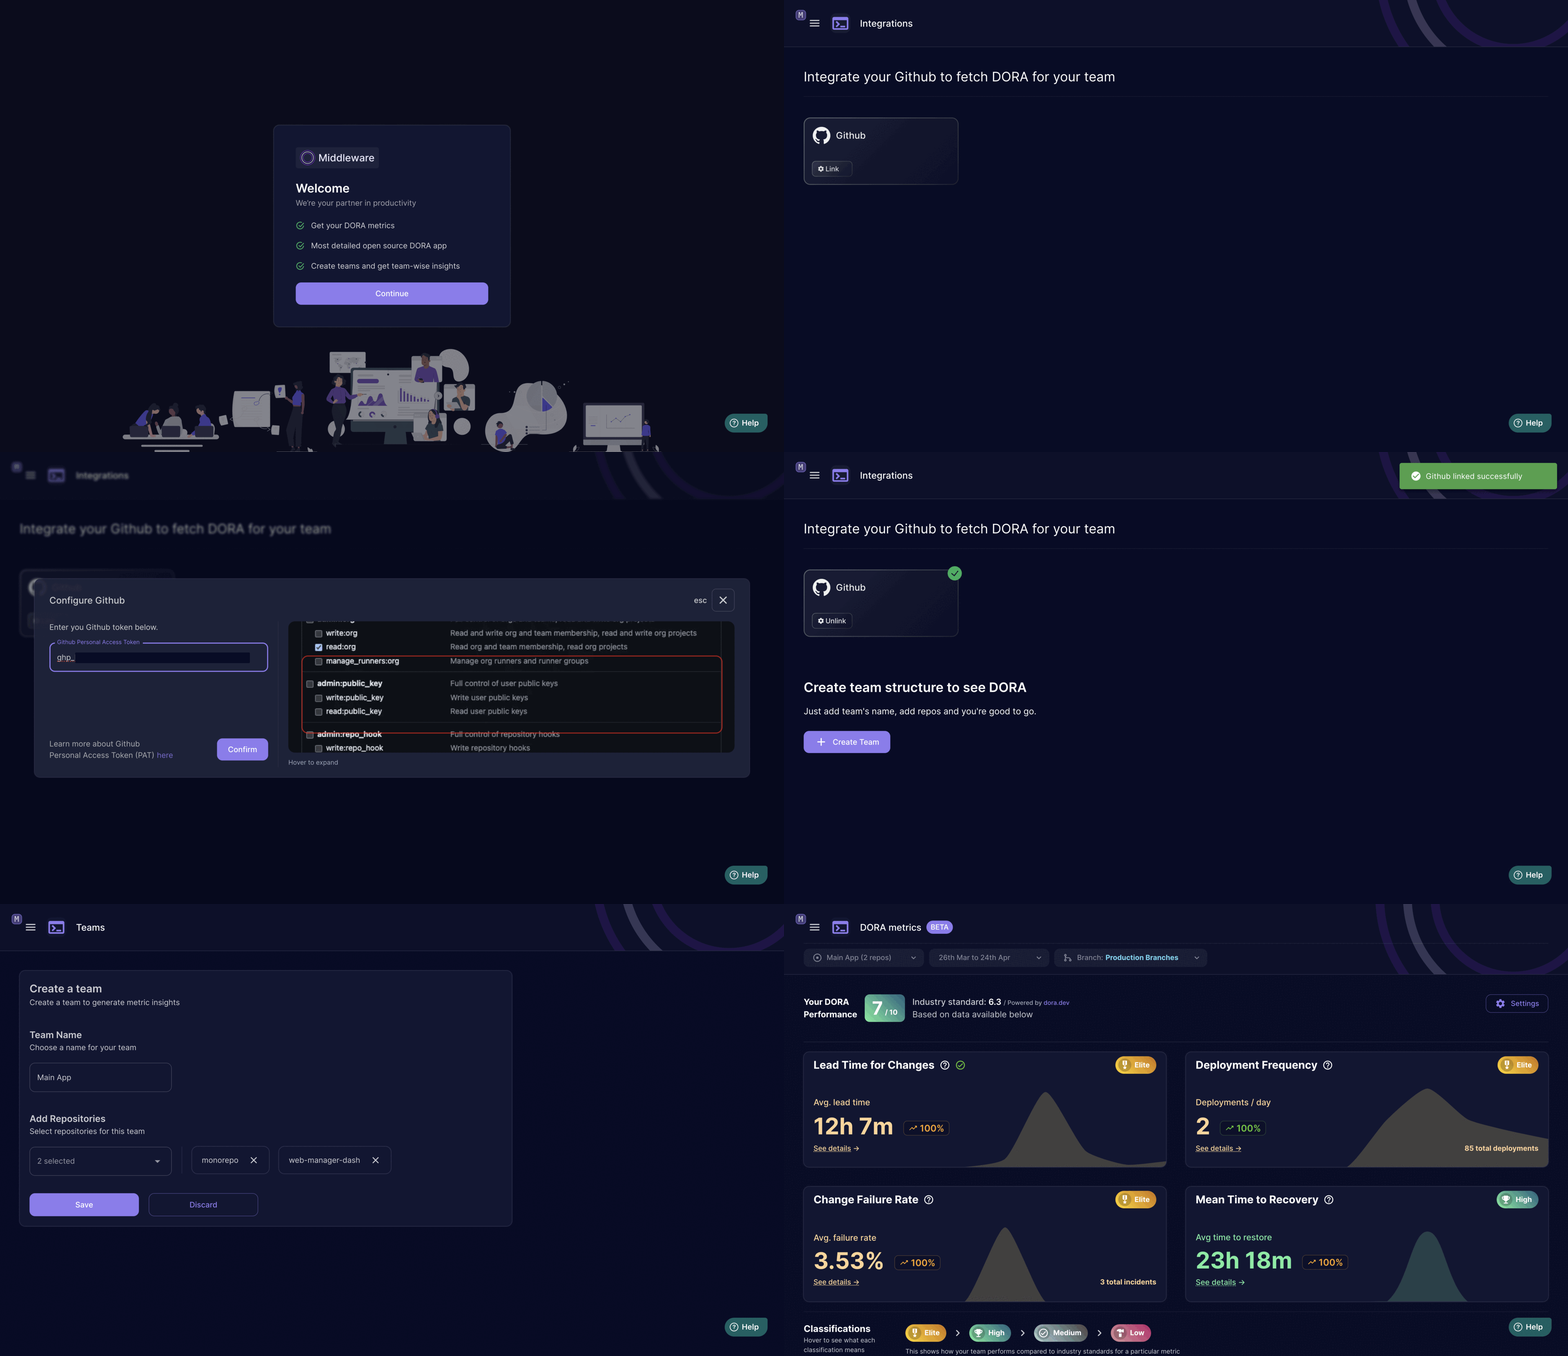
- Setup the project by following the steps mentioned above.
- Generate and Add your PAT token from code provider.
- Create a team and select repositories for the team.
- See Dora Metrics for your team.
- Update settings related to incident filters, excluded pull requests, prod branches etc to get more accurate data.
Middleware can display DORA Metrics using exclusively GitHub Data. The aim is to provide DORA metrics to anyone and everyone using their Git data, regardless of other integrations.
DORA metrics are derived from Pull Requests, Deployments, and Incidents.
For simplicity, we synchronize your Pull Request data and classify reverted Pull Requests as incidents and merged Pull Requests as Deployments.
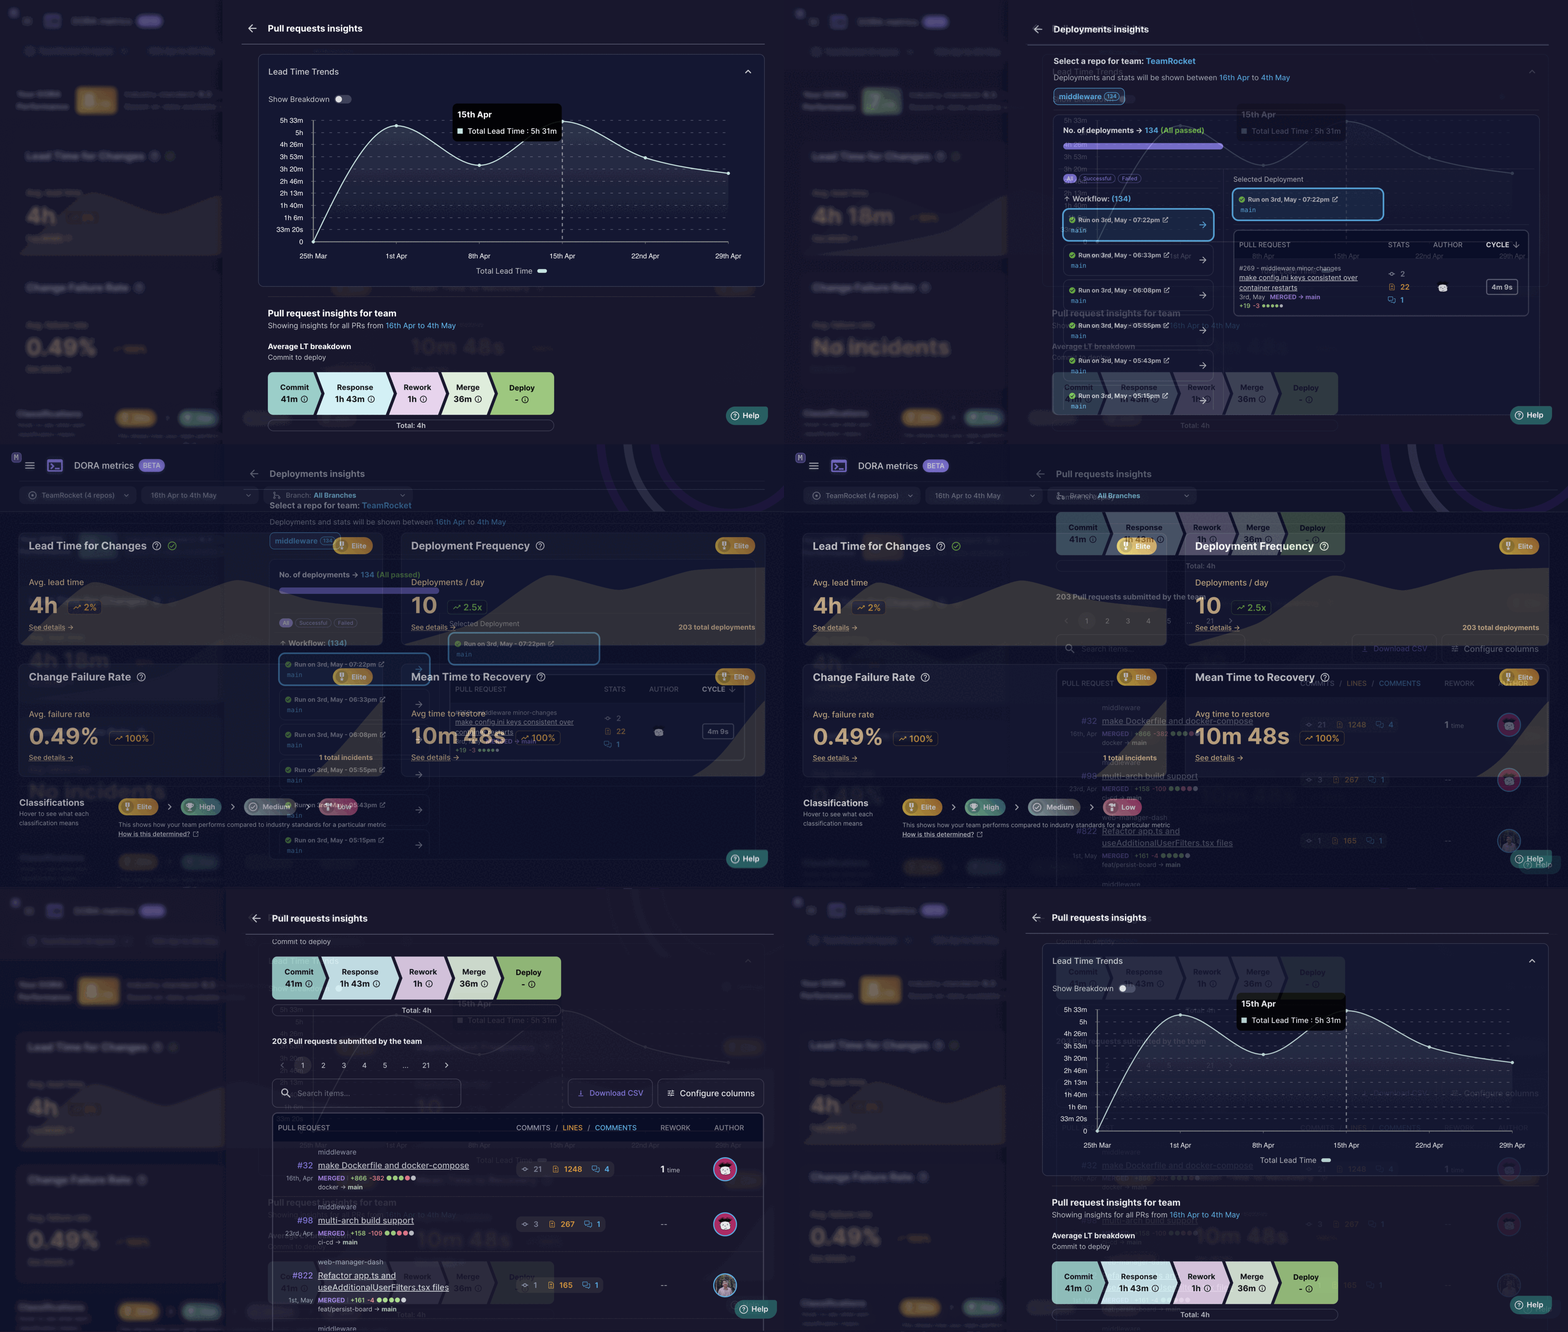
Lead Time for Changes
- Lead time consists of First Commit to PR Open time, First Response Time, Rework Time, Merge Time, and Merge to Deploy Time.
- When calculating DORA using git-based data, PR merges are regarded as deployments, hence the merge to deploy time is considered as 0, while the rest of the time components remain the same.
Deployment Frequency
- This metric gauges how frequently code changes are deployed to production.
- When considering PR merges as deployments, this can also represent the daily/weekly/monthly frequency of PR merges.
Mean Time to Recover (MTTR)
- MTTR measures how swiftly a team can restore service after a failure occurs in production.
- The team's average incident resolution time is utilized to compute its MTTR.
- When treating Revert PRs as incidents, the resolution time for an incident is calculated from the merging of the original PR to the merging of the revert PR.
Change Failure Rate (CFR)
- CFR quantifies the percentage of changes that result in a service impairment or outage in production, aiding in the evaluation of deployment process stability and reliability.
- CFR is computed by linking incidents to deployments within an interval; each deployment may have several or no incidents.
- Deployments that can be linked to any incident are considered as causing a failure or outage.
- The fraction of deployments causing outages to the total deployments in an interval is used to determine the CFR.
Coming Soon!
To get started contributing to middleware check out our CONTRIBUTING.md.
We appreciate your contributions and look forward to working together to make Middleware even better!
To get started contributing to middleware check out our SECURITY.md.
We look forward to your part in keeping Middleware secure!
This project is licensed under the Apache 2.0 License - see the LICENSE.md file for details.


