dyntapy is a macroscopic car traffic modelling toolkit that offers both Static and Dynamic assignment algorithms and support for visualizing assignment results in jupyter notebooks. It is designed to be extendable. Other assignment algorithms can be added rather easily, building on the provided definitions of supply, demand and assignment results.
Provided functionalities:
- Network generation from OSM using OSMnx complying with GMNS attribute names.
- Static Assignments (deterministic user equilibrium: DialB, MSA; stochastic, congested and uncongested: Dial's Algorithm)
- Dynamic User Equilibrium using the iterative link transmission model
- Visualization of static and dynamic attributes, including bidirectional flow visualization
- Fast shortest path computations
- Selected Link Analysis
There are demo tutorials available that you can run in Binder.
These tutorials are running with the latest released version of dyntapy.
All the user-facing functions also have documentation available.
If you use this package in your work please cite the associated paper:
Ortmann et al., (2022). dyntapy: dynamic and static traffic assignment in Python. Journal of Open Source Software, 7(77), 4593
dyntapy is available on conda-forge. Using
conda install -c conda-forge dyntapywill install dyntapy in your current environment.
Note that dyntapy is also available on pip, however we don't recommend installing it this way since some geo-dependencies, namely shapely, pyproj and fiona, rely on C-based libraries that cannot be installed via pip.
This is only for those who want to have the latest state of development of dyntapy.
Download or clone the repository. We assume you have conda installed. Navigate to the folder containing the environment.yml or pass on the full path.
conda env create environment.yml This will sort out dyntapy's dependencies using conda. Activate the environment.
From within the same folder containing the setup.py file, we now can install the package with
python -m pip install -e .using -e makes the repository editable.
We briefly demonstrate here the visualization capabilities within dyntapy, for a more detailed look at all the provided functionality we refer to the tutorials.
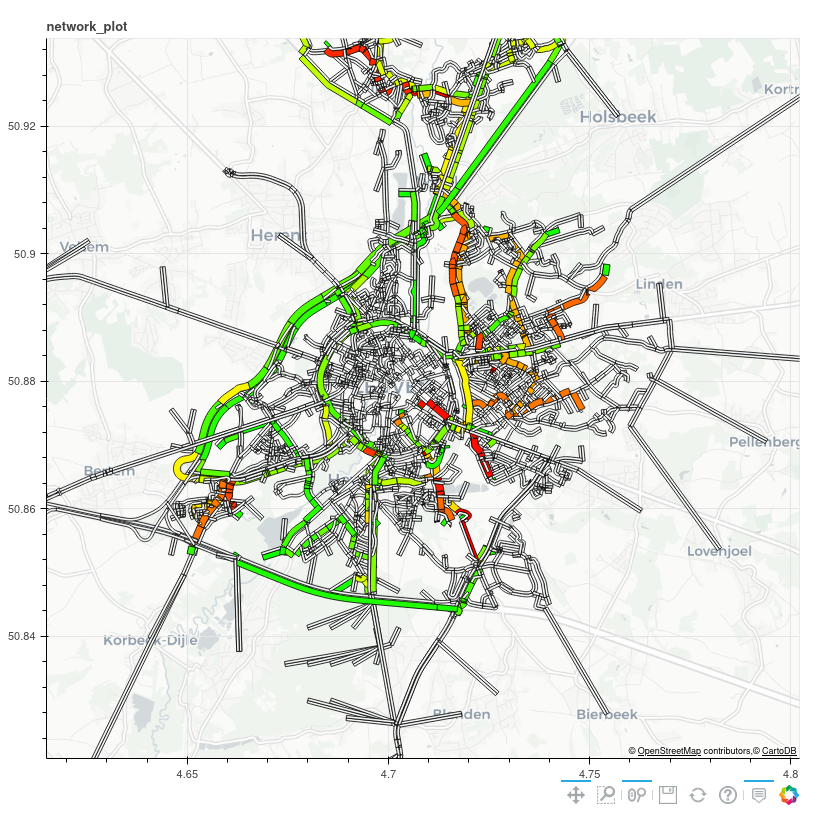
On the left: Results of an assignment with Dial's Algorithm B.
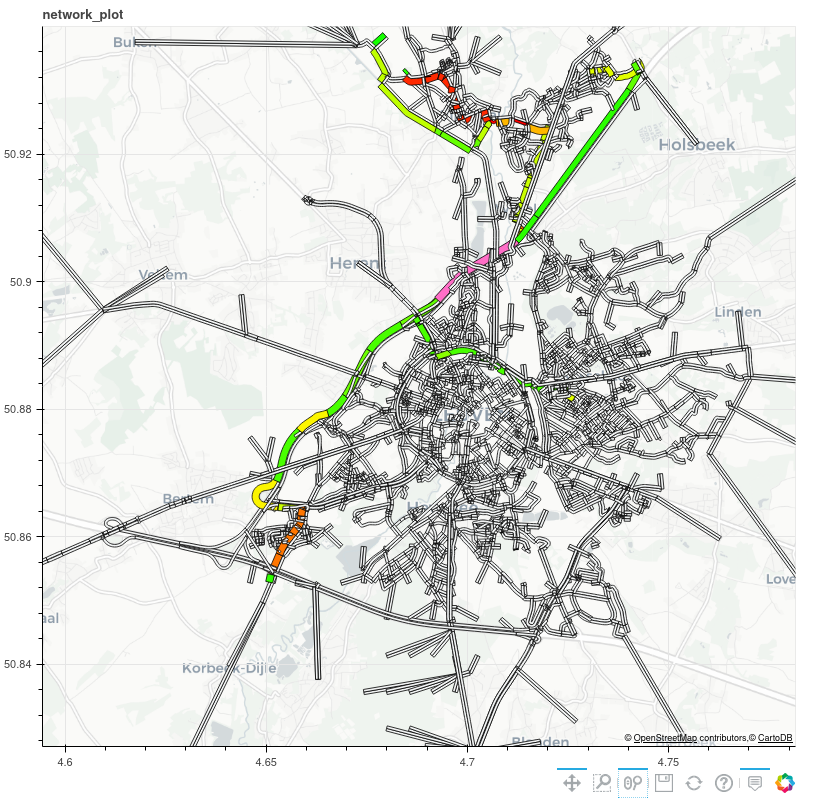
On the right: Selected Link Analysis of the link highlighted in pink.
The color transition from green to red mirror the volume-to-capacity ratio from 0 to >1. The width of the links is scaled to the largest flow in the network.
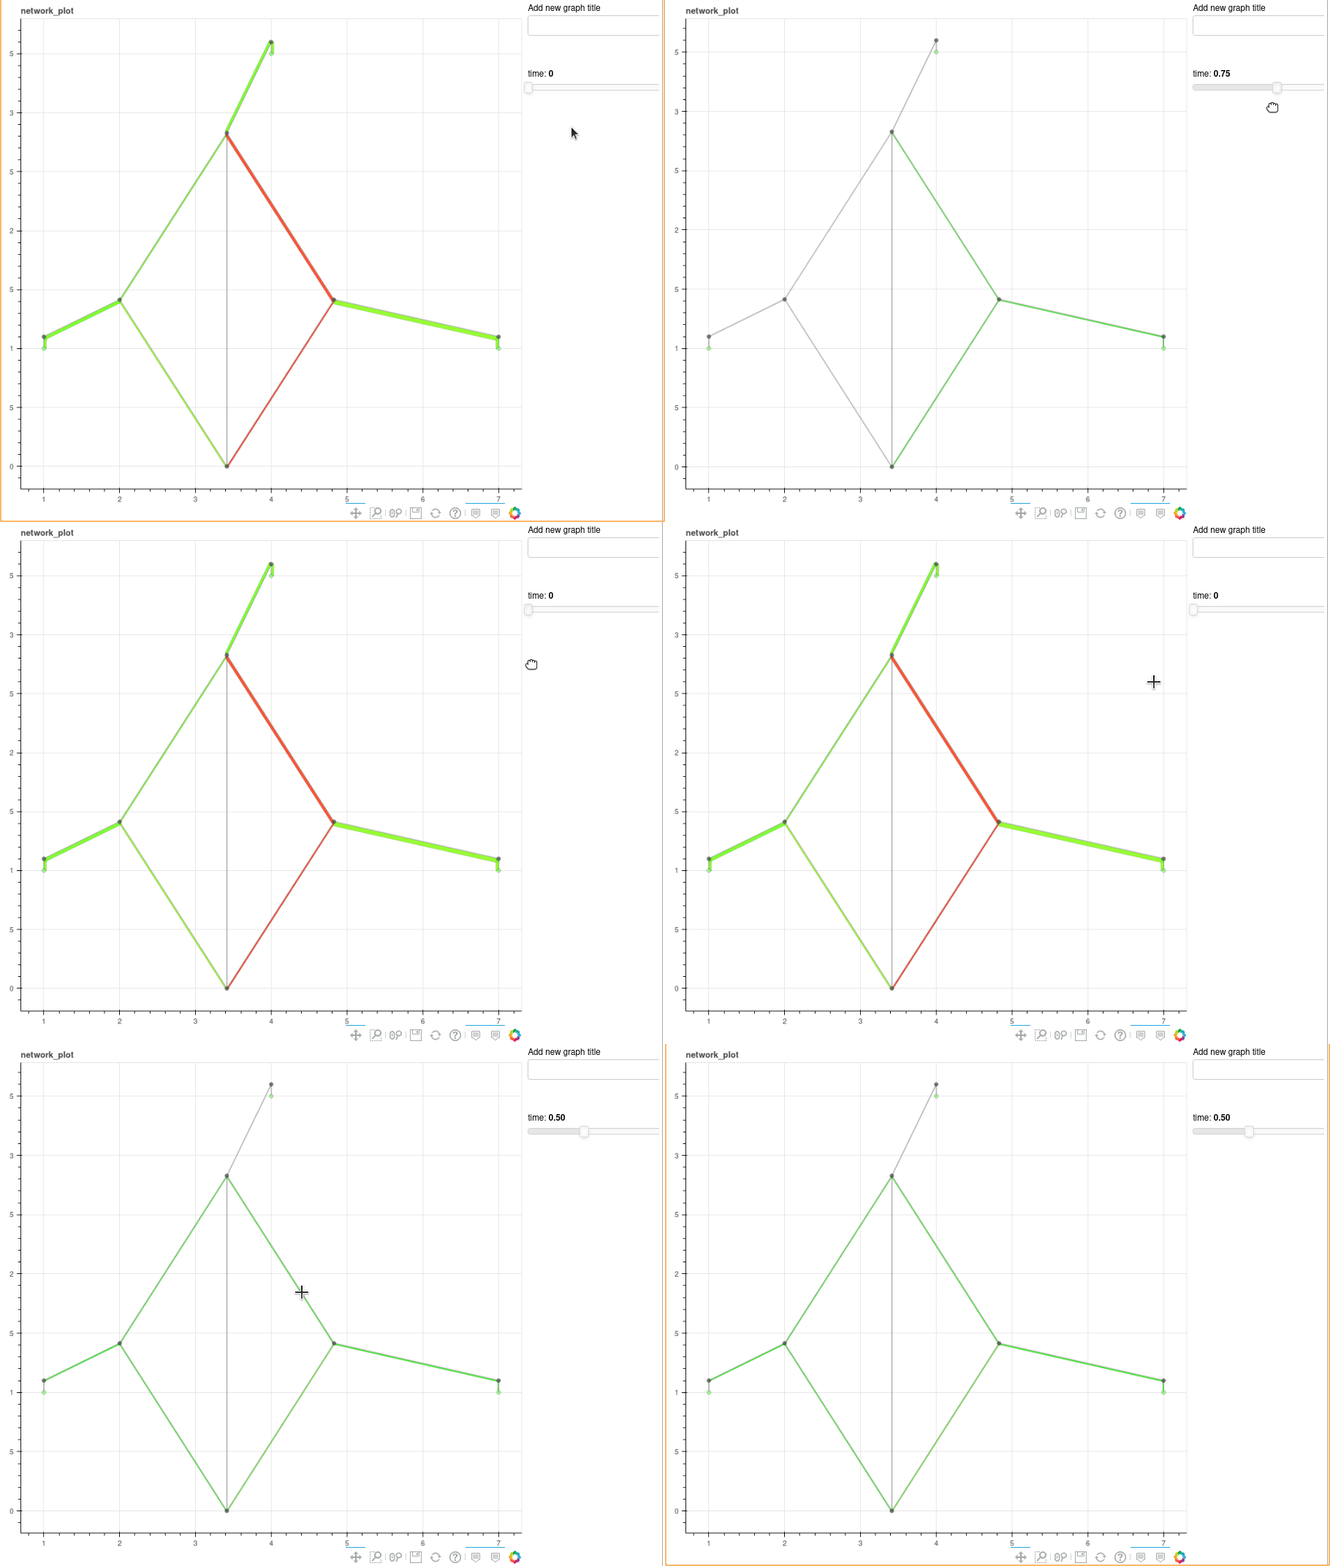
For analysis of dynamic scenarios a time slider can be used to step through different time discretization steps. The state of the plot is updated as the time slider is moved, the data that can be attained by hovering over elements is also changed dynamically.
AequilibraE is a traffic modelling kit that supports a set of static assignments paired with OpenStreetMap parsing. It aims to be an open source alternative to Visum and provides comprehensive visualization and network management capabilities in QGIS. dyntapy differs from AequilibraE mainly by its inclusion of dynamic models and command-driven visualization capabilities within jupyter notebooks.
Similar to other popular graph packages, such as igraph and networkx, we offer shortest path computations. Our implementations are more than twice as fast as igraph and more than 20x faster than networkx for road networks.
Take a look at the community guidelines. Note that the repository that is hosted on KU Leuven premises is not the place for filing issues as an external, you should submit both issues and pull requests on the GitHub mirror.
A part of the development of this package has been funded by DUET - Digital Urban European Twins as part of the Horizon 2020 funding program (Grant ID 870607).


