This is an opinionated, inexpensive and simple to set up suite of NuCypher node monitoring and alerting services using Prometheus and Grafana. It's boiled down to be of use to the less techincal node operators out there: in a professional setting we expect the users to have more sophisticated setups.
This guide was wrote for persons who complete NuCypher installation guide using SystemD service installation and set --prometheus --metrics-port 9101 parameters
The guide was tested on Ubuntu 18.04 and should be applicable to all modern debian-based distributions.
Feel free to open issues or pull requests, but we won't accept PRs that make monitoring setup or maintenance significantly more difficult or expensive.
-
Clone the repository
git clone https://github.com/p2p-org/nucypher-monitoring.git
-
Install docker and docker-compose if you didn't it before. It needs root privileges to run (so, run it using
sudoor under root user).curl -fsSL https://get.docker.com -o- | sh curl -fsSL https://github.com/docker/compose/releases/download/1.25.4/docker-compose-`uname -s`-`uname -m` -o /usr/local/bin/docker-compose && \ chmod +x /usr/local/bin/docker-compose && \ ln -s /usr/local/bin/docker-compose /usr/bin/docker-compose && \ curl -fsSL https://raw.githubusercontent.com/docker/compose/1.25.4/contrib/completion/bash/docker-compose -o /etc/bash_completion.d/docker-compose
-
Install node-exporter, set listening address to
127.0.0.1and enable expose systemd metrics. You can use bash-scriptinstall-prometheus-node-exporter.shto do all that automaticalle. It needs root privileges to run../install-prometheus-node-exporter.sh
NB: this setup exposes grafana publicly over HTTP. For a more secure setup consider getting a domain and setting up SSL or using ngrok.
You need to setup environment variables.
- Open file
grafana.envin any text editor; - Replace
0.0.0.0inGF_SERVER_ROOT_URLwith your server's external address or DNS name for correct url in alert notifications; - If you want to receive email notifications then you need to configure SMTP settings:
- Replace
host:portinGF_SMTP_HOSTwith your SMTP server DNS name or IP and port; - Set
GF_SMTP_USER,GF_SMTP_FROM_ADDRESSandGF_SMTP_PASSWORDto Email/Password from which the notifications will be sent.
- Replace
- Save changes.
For example, for the address admin@gmail.com:
GF_SMTP_HOST=smtp.gmail.com:465
GF_SMTP_USER=admin@gmail.com
GF_SMTP_PASSWORD=examplePassword
GF_SMTP_FROM_ADDRESS=admin@gmail.com
Do not use your main e-mail account for this, register a throwaway.
-
Run docker-compose.
docker-compose up -d
Now you can see your dashboard at http://your.server.ip.address.or.dns.name:3000/. In a fresh grafana isntall, you will be prompted for username/password. Use username admin with password admin. You will be prompted to change your password.
-
Get telegram bot token by using appropriate telegram bot guide, also get your chat id (e.g. via @get_id_bot, see additional guides in grafana community);
-
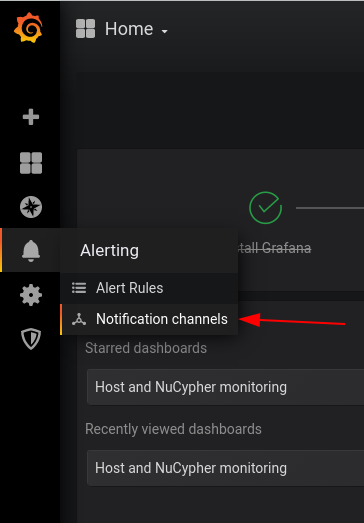
Go to grafana
Alerting->Notification channels; -
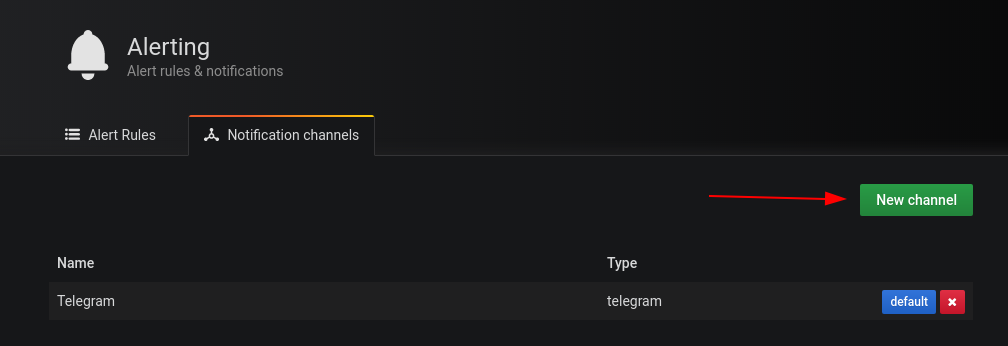
Click on
New channelbutton; -
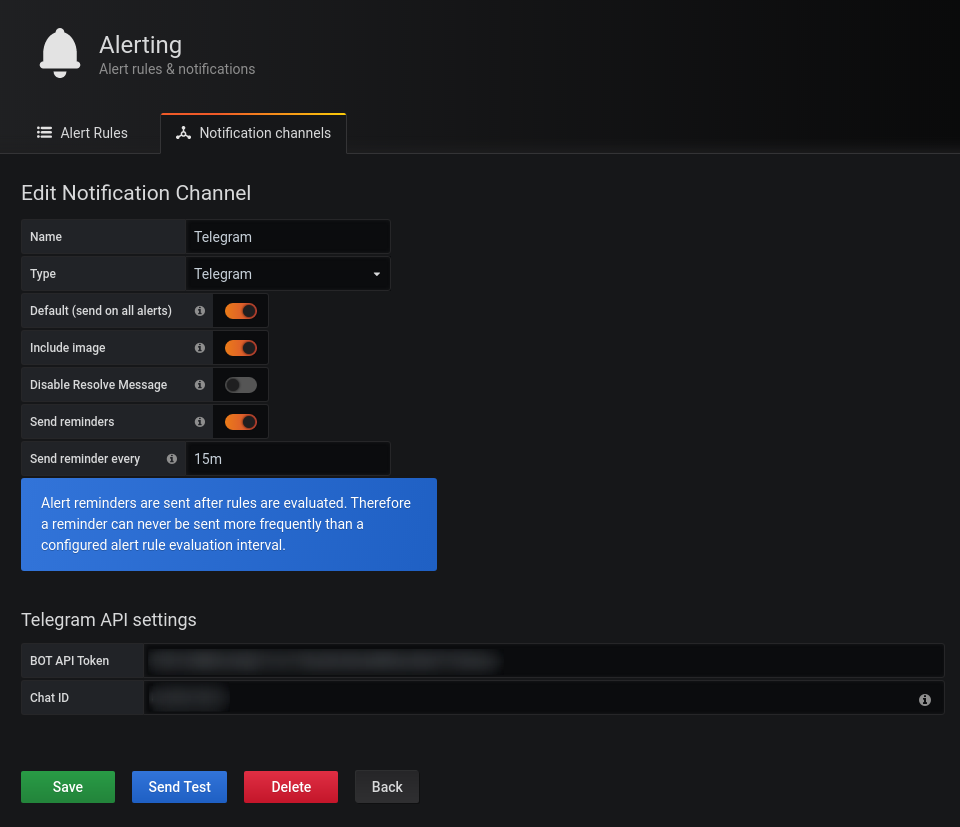
Select
Type->Telegram; -
Fill
Name, paste your bot token toBOT API Tokenfield and your chat id toChat IDfield. Click onSend Testto check the sending of alerts and if it's OK click onSavebutton; -
Additionally you can set another options for including image into messages, send reminders, etc., like on screenshot below.
OpsGenie allows for mobile network based alerts like SMS or phone calls. You can use an other similar service for that.
- Get API key as described in OpsGenie documentation;
- Repeat items 2, 3 on the list above;
- Select
Type->OpsGenie; - Fill
Name, paste your API key toAPI key. Click onSend Testto check the sending of alerts and if it's OK click onSavebutton;
NB: for e-mail alerting to work you need to set up email-related environment variables, as described in Setting up environment
-
Go to grafana
Alerting->Notification channels; -
Click on
New channelbutton; -
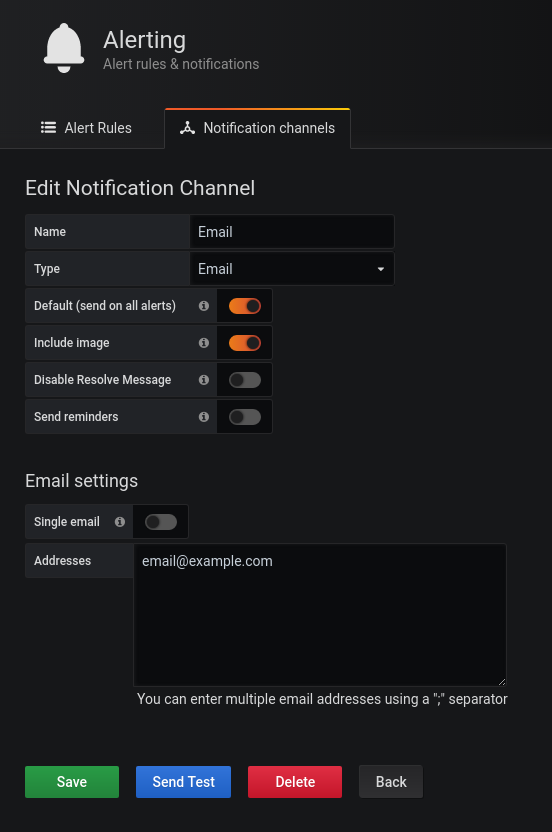
Select
Type->Email; -
Fill
Nameand fill in theAddressesfield with the Emails to which notifications will be received.
We highly recommend to configure external HTTP monitoring for grafana dashboard and ursula's status page. That way you'll recieve an alert even if your server, ursula node or grafana service goes down. We describe using Uptime Robot because it has a pretty good entry level free plan at the time of the writing, but there are dozens of services like that that could be used for the purpose.
-
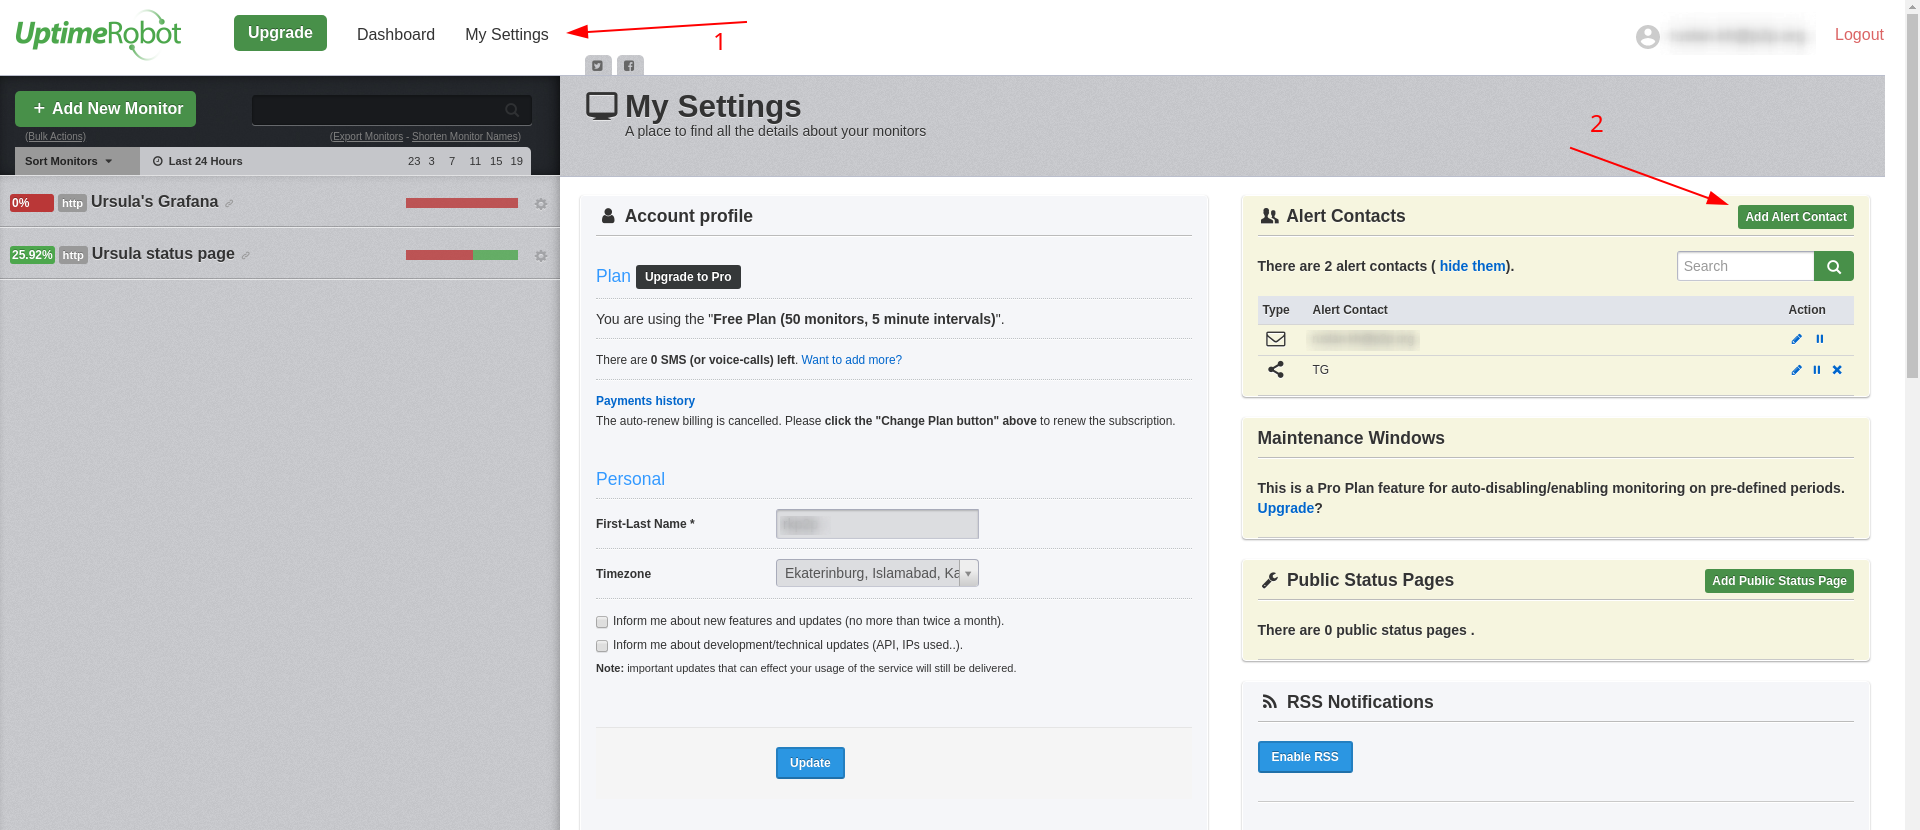
Go to
My settings(1) and click onCreate Alert Contact(2). -
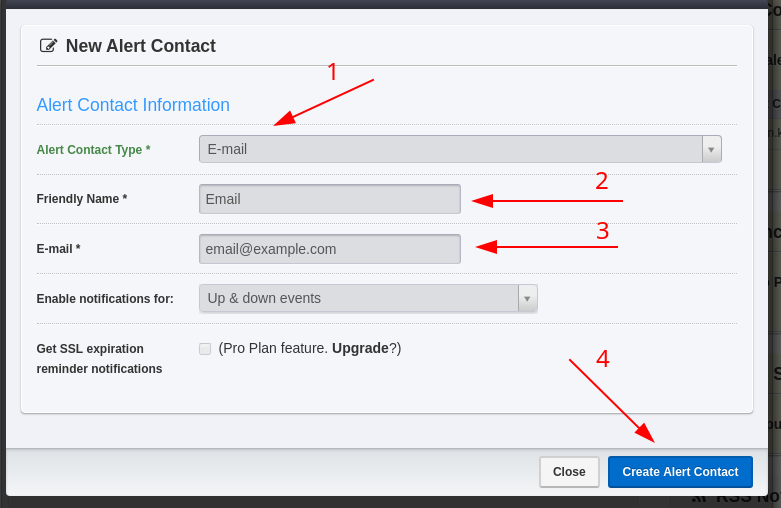
Fill all fields like on screenshot.
-
Click on
Create Alert contact(4).
-
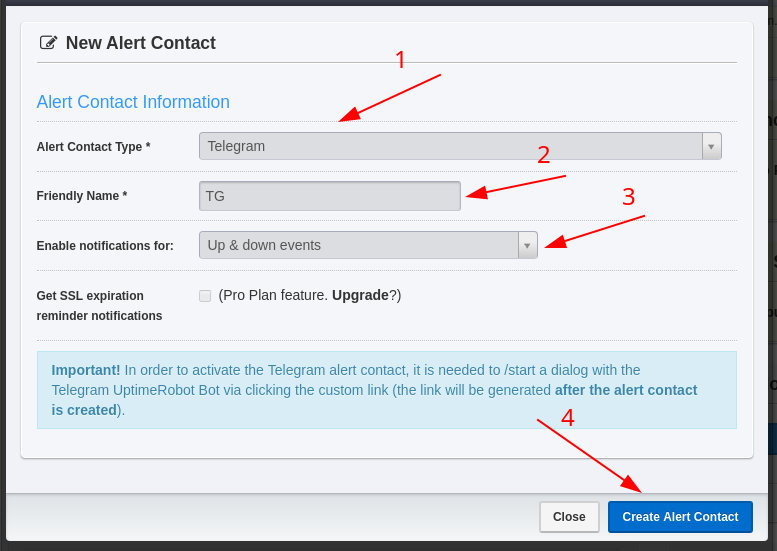
Go to
My settingsand click onCreate Alert Contact. -
Fill all fields like on screenshot.
-
Click on
Create Alert contact. -
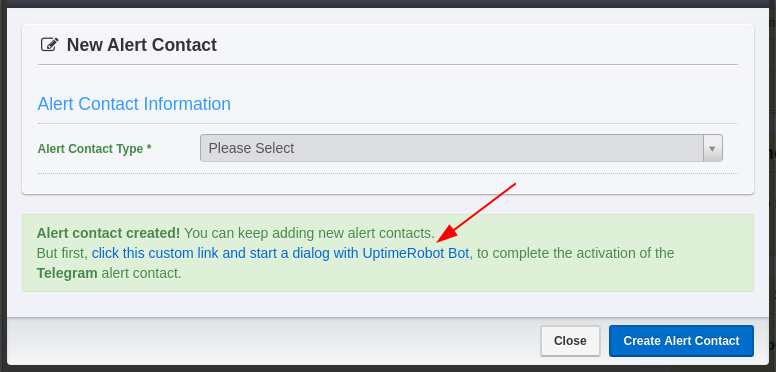
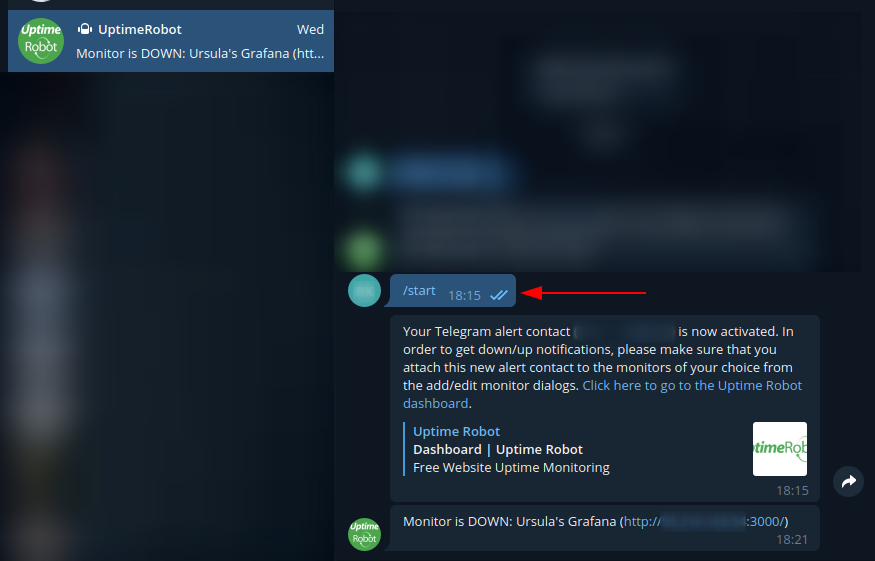
Click on custom link (see screenshot). It will open Telegram chat with UptimeRobot bot.
-
Type command
/start.
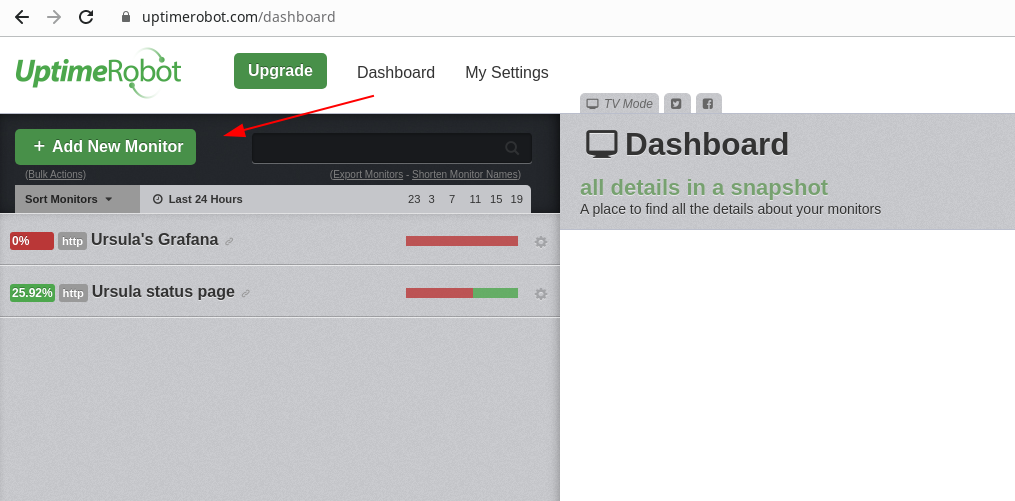
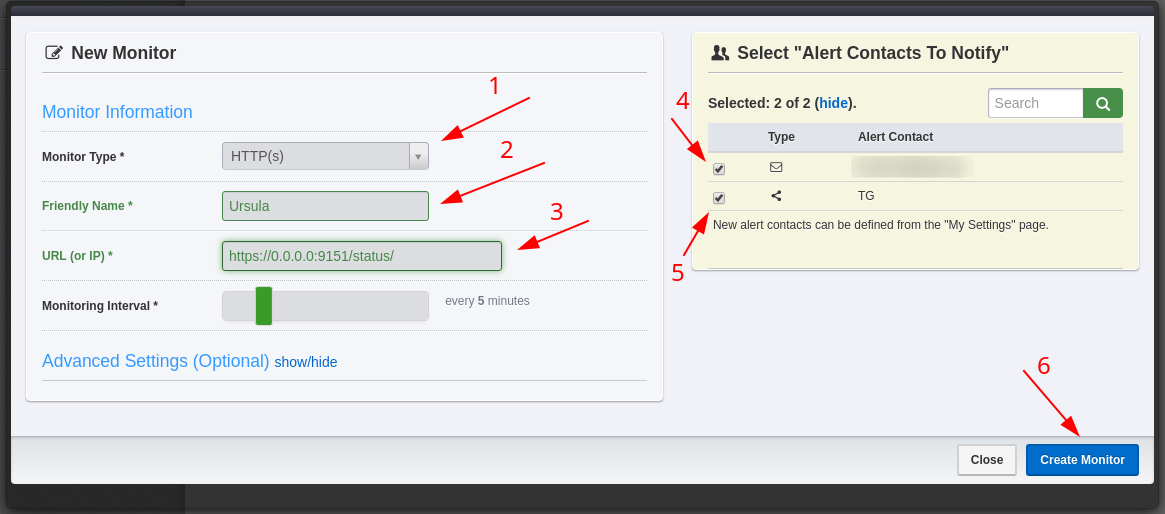
Create one monitor for Ursula's status page URL https://YOUR_SERVER_EXTERNAL_IP:9151/status/ and another one for grafana dashboard URL (e.g. http://YOUR_SERVER_EXTERNAL_IP:3000/)
