The goal of this repo is to create an scalable load tester that can get a load shape as input and create a user workload based on that.
This load tester uses locust for handling distributed load testing and gathering the statistics of the requests.
For further information, read the following urls to get familiar with locust and how to write
a locustfile.py:
Uninstall locust library:
pip uninstall locust locustio
# Check successful uninstall
pip freeze | grep locust
Install the DDSL locust library:
pip install -r requirements.txtFor running examples:
pip install -r examples/requirements.txtTo run the example, change your directory to the examples/ directory and run the following
command.
As mentioned before, the locust library is responsible to make the requests to the target url.
To start the locust server, create a locustfile.py and run the following command:
ddsl_locust --host=THE_TEST_URL -f locustfile.pyThis will use the locustfile.py or we can specify the file name using -f option.
- Note that one should use two terminals to specify the "THE_TEST_URL" and running the "locustfile.py".
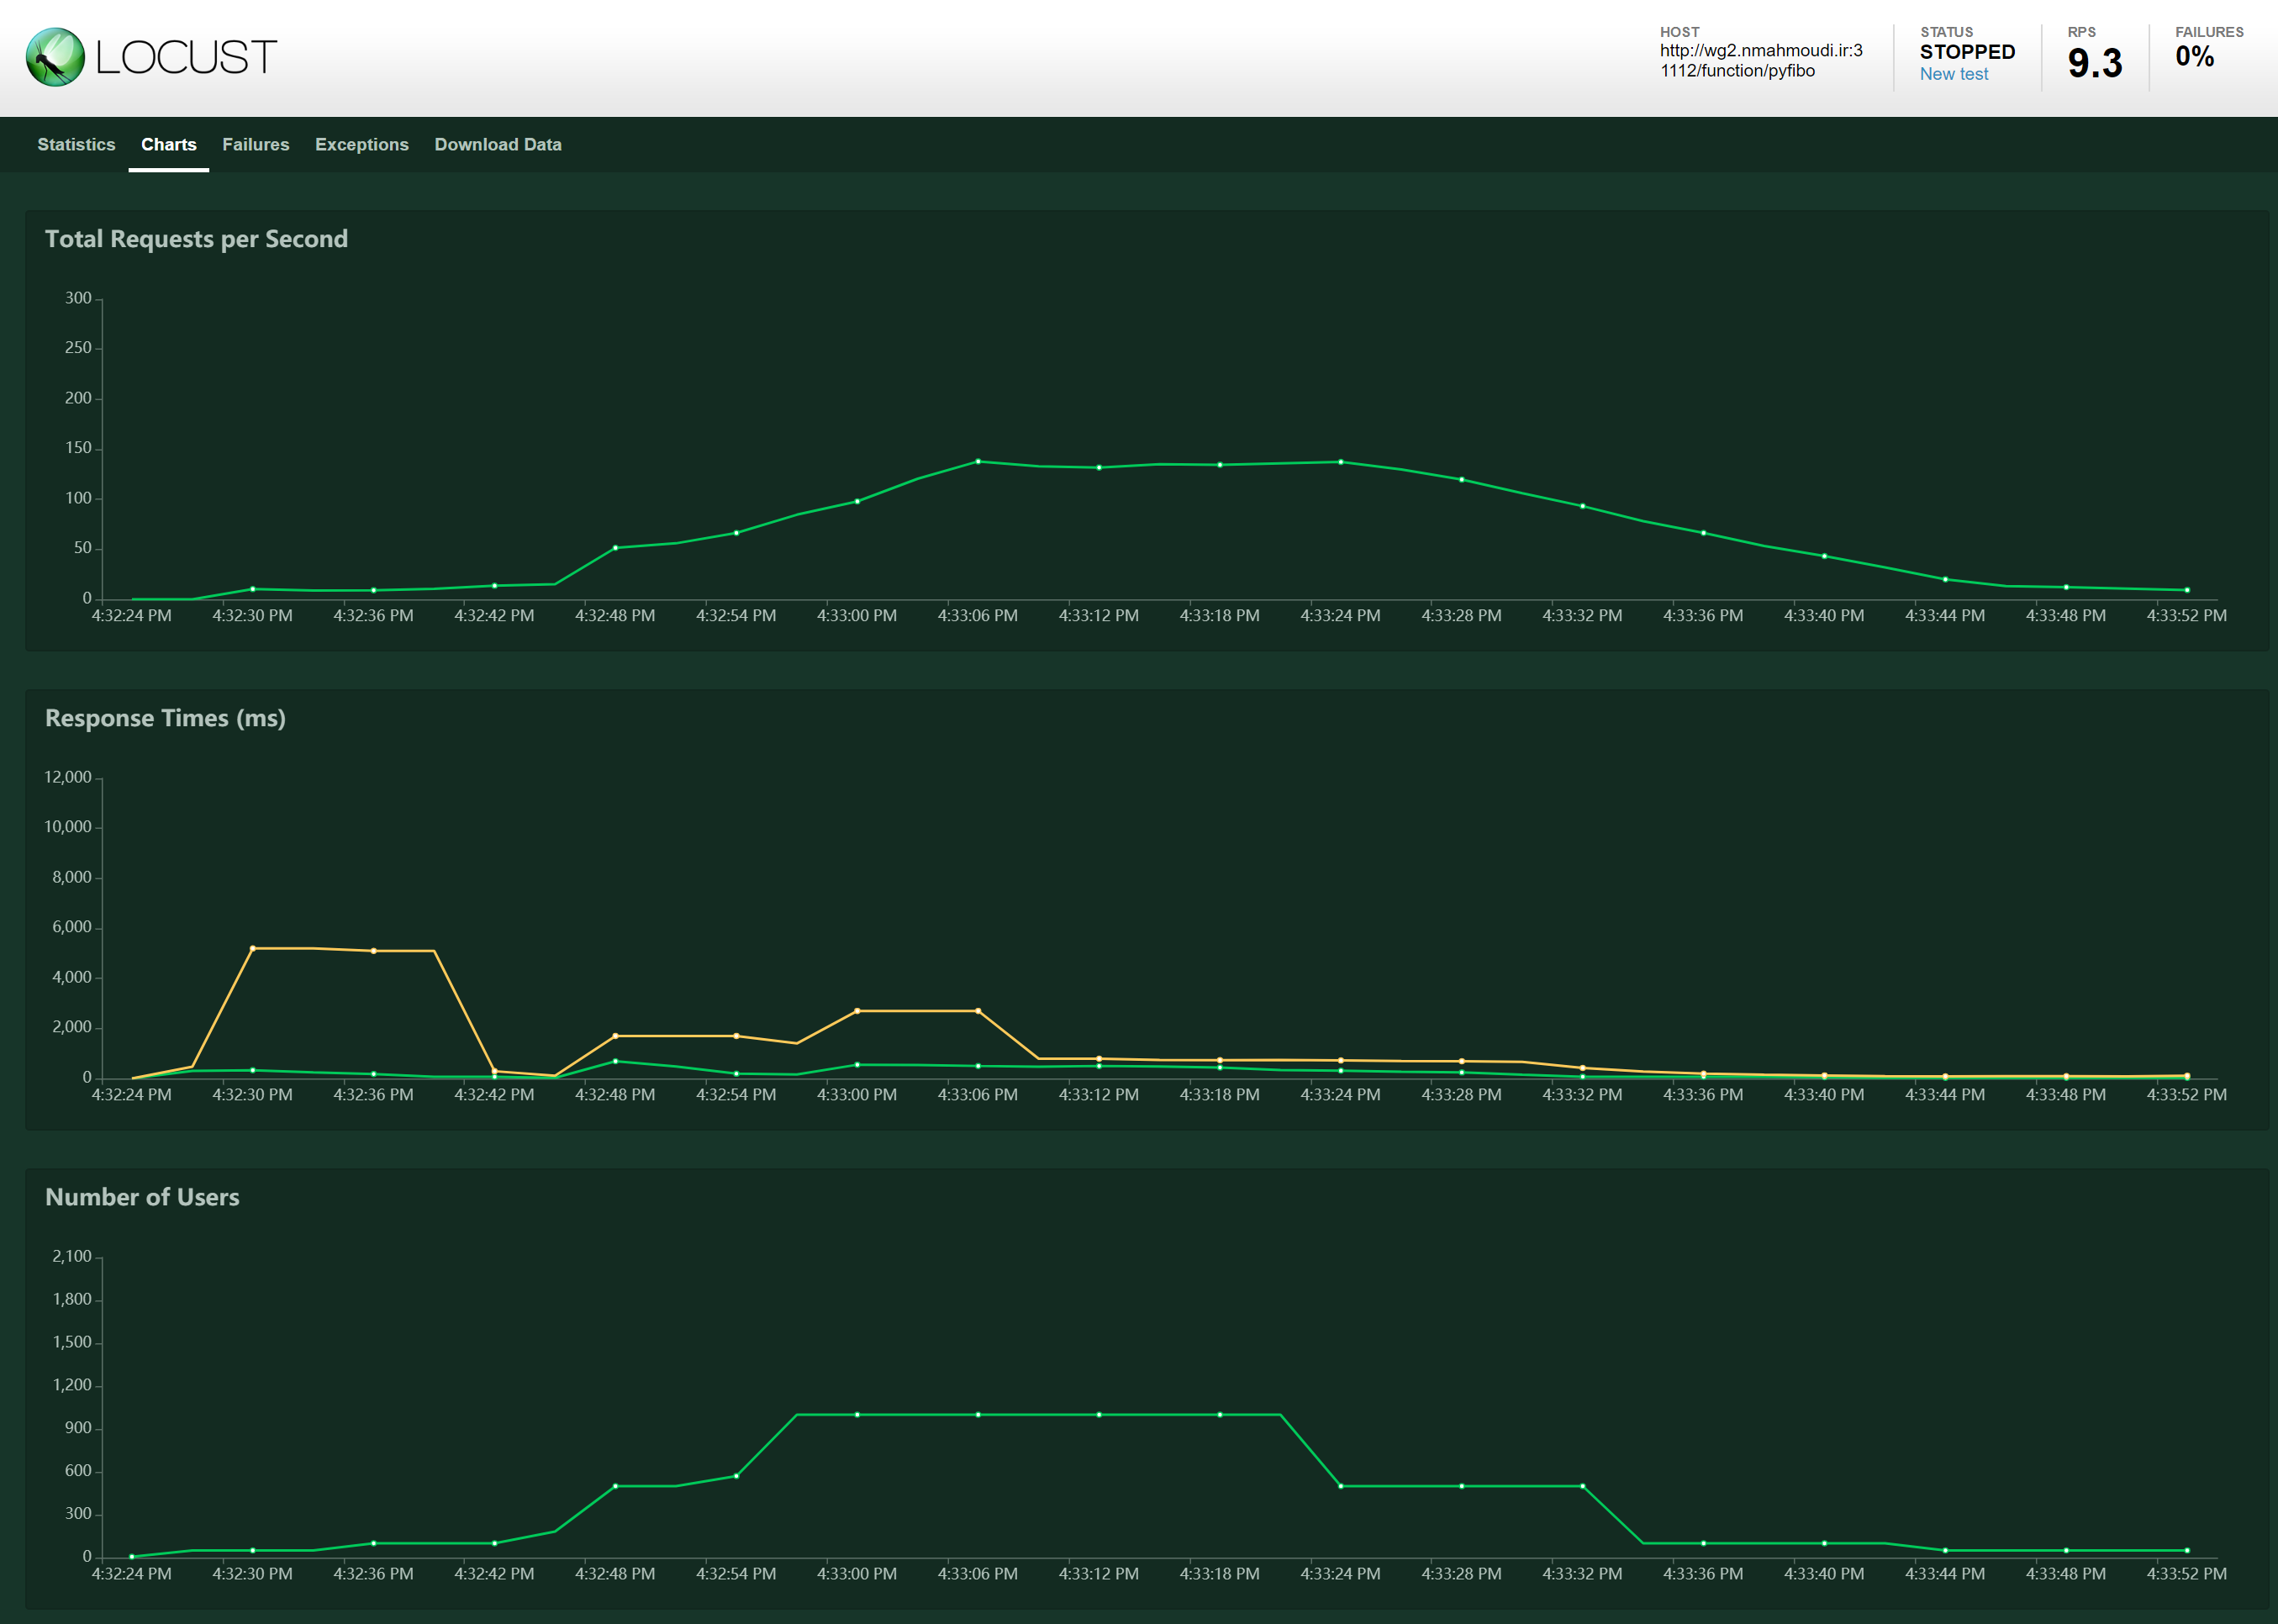
You can look at the locust dashboard onhttp://localhost:8089. It will show the stats about the requests and should look like this:
In this section, we will mention how the library should be used. Keep in mind that this
library assumes a running instance of locust (read starting locust server section).
Just make sure to use the command ddsl_locust instead of locust.
To use this library, first you will need to add it to your PYTHONPATH. Here's how:
import sys
sys.path.append("./ddsl_load_tester")
You could also use the absolute or any other relative path to the library folder.
import ddsl_load_tester as load_testerThe base variables is the adress to your running locust host.
lt = load_tester.DdslLoadTester(hatch_rate=1000, temp_stat_max_len=5, base='http://localhost:8089/')
lt.change_count(user_sequence[0])
lt.start_capturing()
hatch_rate is the maximum number of users created in 1 second. temp_stat_max_len specifies maximum number of stats
that are going to be collected and kept before getting them using lt.get_all_stats().
Using change_count(new_count) you can set the number of users making requests to the server.
After lt.start_capturing() is called, a new thread is created that will query the locust server
and store the stats in the temp_stats variable. You can read these stats later on using
lt.get_all_stats(). Keep in mind that calling this function will clear the temp variable.
So, each time you query this function, you will only get the latest results since your last
query. The number of temporary stats that are kept is set using temp_stat_max_len variable.
Running lt.stop_test() will stop the test and kill the thread that is querying locust for
latest stats.
Please note that the locust stats are updated every 2 seconds, thus new stats come in every 2 seconds as well.
For getting the original stats from the locust server (without change):
load_tester.get_current_stats(base='http://localhost:8089/')Example output:
{'current_max_response_time': 790,
 'current_min_response_time': 360,
 'current_response_time_average': 395,
 'current_response_time_percentile_50': 480,
 'current_response_time_percentile_95': 790,
 'errors': [],
 'fail_ratio': 0.0,
 'state': 'running',
 'stats': [{'avg_content_length': 100.31967213114754,
   'avg_response_time': 529.8116343920348,
   'current_rps': 0.8,
   'max_response_time': 793.5733795166016,
   'median_response_time': 520,
   'method': 'GET',
   'min_response_time': 305.24539947509766,
   'name': '/',
   'num_failures': 0,
   'num_requests': 244},
  {'avg_content_length': 100.31967213114754,
   'avg_response_time': 529.8116343920348,
   'current_rps': 0.8,
   'max_response_time': 793.5733795166016,
   'median_response_time': 520,
   'method': None,
   'min_response_time': 305.24539947509766,
   'name': 'Total',
   'num_failures': 0,
   'num_requests': 244}],
 'total_average_response_time': 529.8116343920348,
 'total_rps': 0.8,
'user_count': 1}The result to lt.get_all_stats() is similar to this:
{'time': [1557525595.4061227,
  1557525597.4071448,
  1557525599.406913,
  1557525601.4073427,
  1557525603.4075553],
 'current_response_time_percentile_50': [21000, 21000, 21000, 21000, 21000],
 'current_response_time_percentile_95': [21000, 23000, 23000, 23000, 21000],
 'current_response_time_average': [1386, 12200, 12200, 3388, 2111],
 'current_max_response_time': [23000, 23000, 23000, 23000, 21000],
 'current_min_response_time': [17000, 17000, 17000, 17000, 17000],
 'fail_ratio': [0.9035933391761612,
  0.9038461538461539,
  0.9038461538461539,
  0.9049265341400173,
  0.9050086355785838],
 'total_rps': [5.7, 4.4, 4.4, 4.4, 0.6],
 'user_count': [50, 50, 50, 50, 50],
 'avg_response_time': [21932.348761821817,
  21929.921705822846,
  21929.921705822846,
  21919.53922348385,
  21918.748792177244],
 'current_rps': [5.7, 4.4, 4.4, 4.4, 0.6],
 'max_response_time': [56428.02929878235,
  56428.02929878235,
  56428.02929878235,
  56428.02929878235,
  56428.02929878235],
 'median_response_time': [21000, 21000, 21000, 21000, 21000],
 'min_response_time': [3427.8957843780518,
  3427.8957843780518,
  3427.8957843780518,
  3427.8957843780518,
  3427.8957843780518],
 'num_failures': [1031, 1034, 1034, 1047, 1048],
'num_requests': [1141, 1144, 1144, 1157, 1158]}This example will run a sequence of number of users, then collect the results in a pandas
DataFrame. This can be used to plot and analyze the results later on. The resulting csv
file is saved to the results/ folder. If this folder doesn't exist, create it using mkdir.
import time
import pandas as pd

import sys
sys.path.append("../ddsl_load_tester")

import ddsl_load_tester as load_tester

from tqdm.auto import tqdm
tqdm.pandas()

loop_timer = load_tester.TimerClass()

user_sequence = [50,100,500,1000,1000,1000,500,100,50]
lt = load_tester.DdslLoadTester(hatch_rate=1000, temp_stat_max_len=5, base='http://localhost:8089/')
lt.change_count(user_sequence[0])
lt.start_capturing()

# This value is best to be kept over 10 seconds.
loop_time_in_secs = load_tester.get_loop_time_in_secs('10s')

loop_timer.tic()

results = None
for i in tqdm(range(len(user_sequence))):
    user_count = user_sequence[i]
    lt.change_count(user_count)

    # decrement the loop processing time to have an accurate time for the loop
    time.sleep(loop_time_in_secs - loop_timer.toc())

    loop_timer.tic()

    result = lt.get_all_stats()
    df_result = pd.DataFrame(data=result)

    # ANY CONTROL ACTION GOES HERE

    if results is None:
        results = df_result
    else:
        results = results.append(df_result)

lt.stop_test()

results, filename = lt.prepare_results_from_df(results)

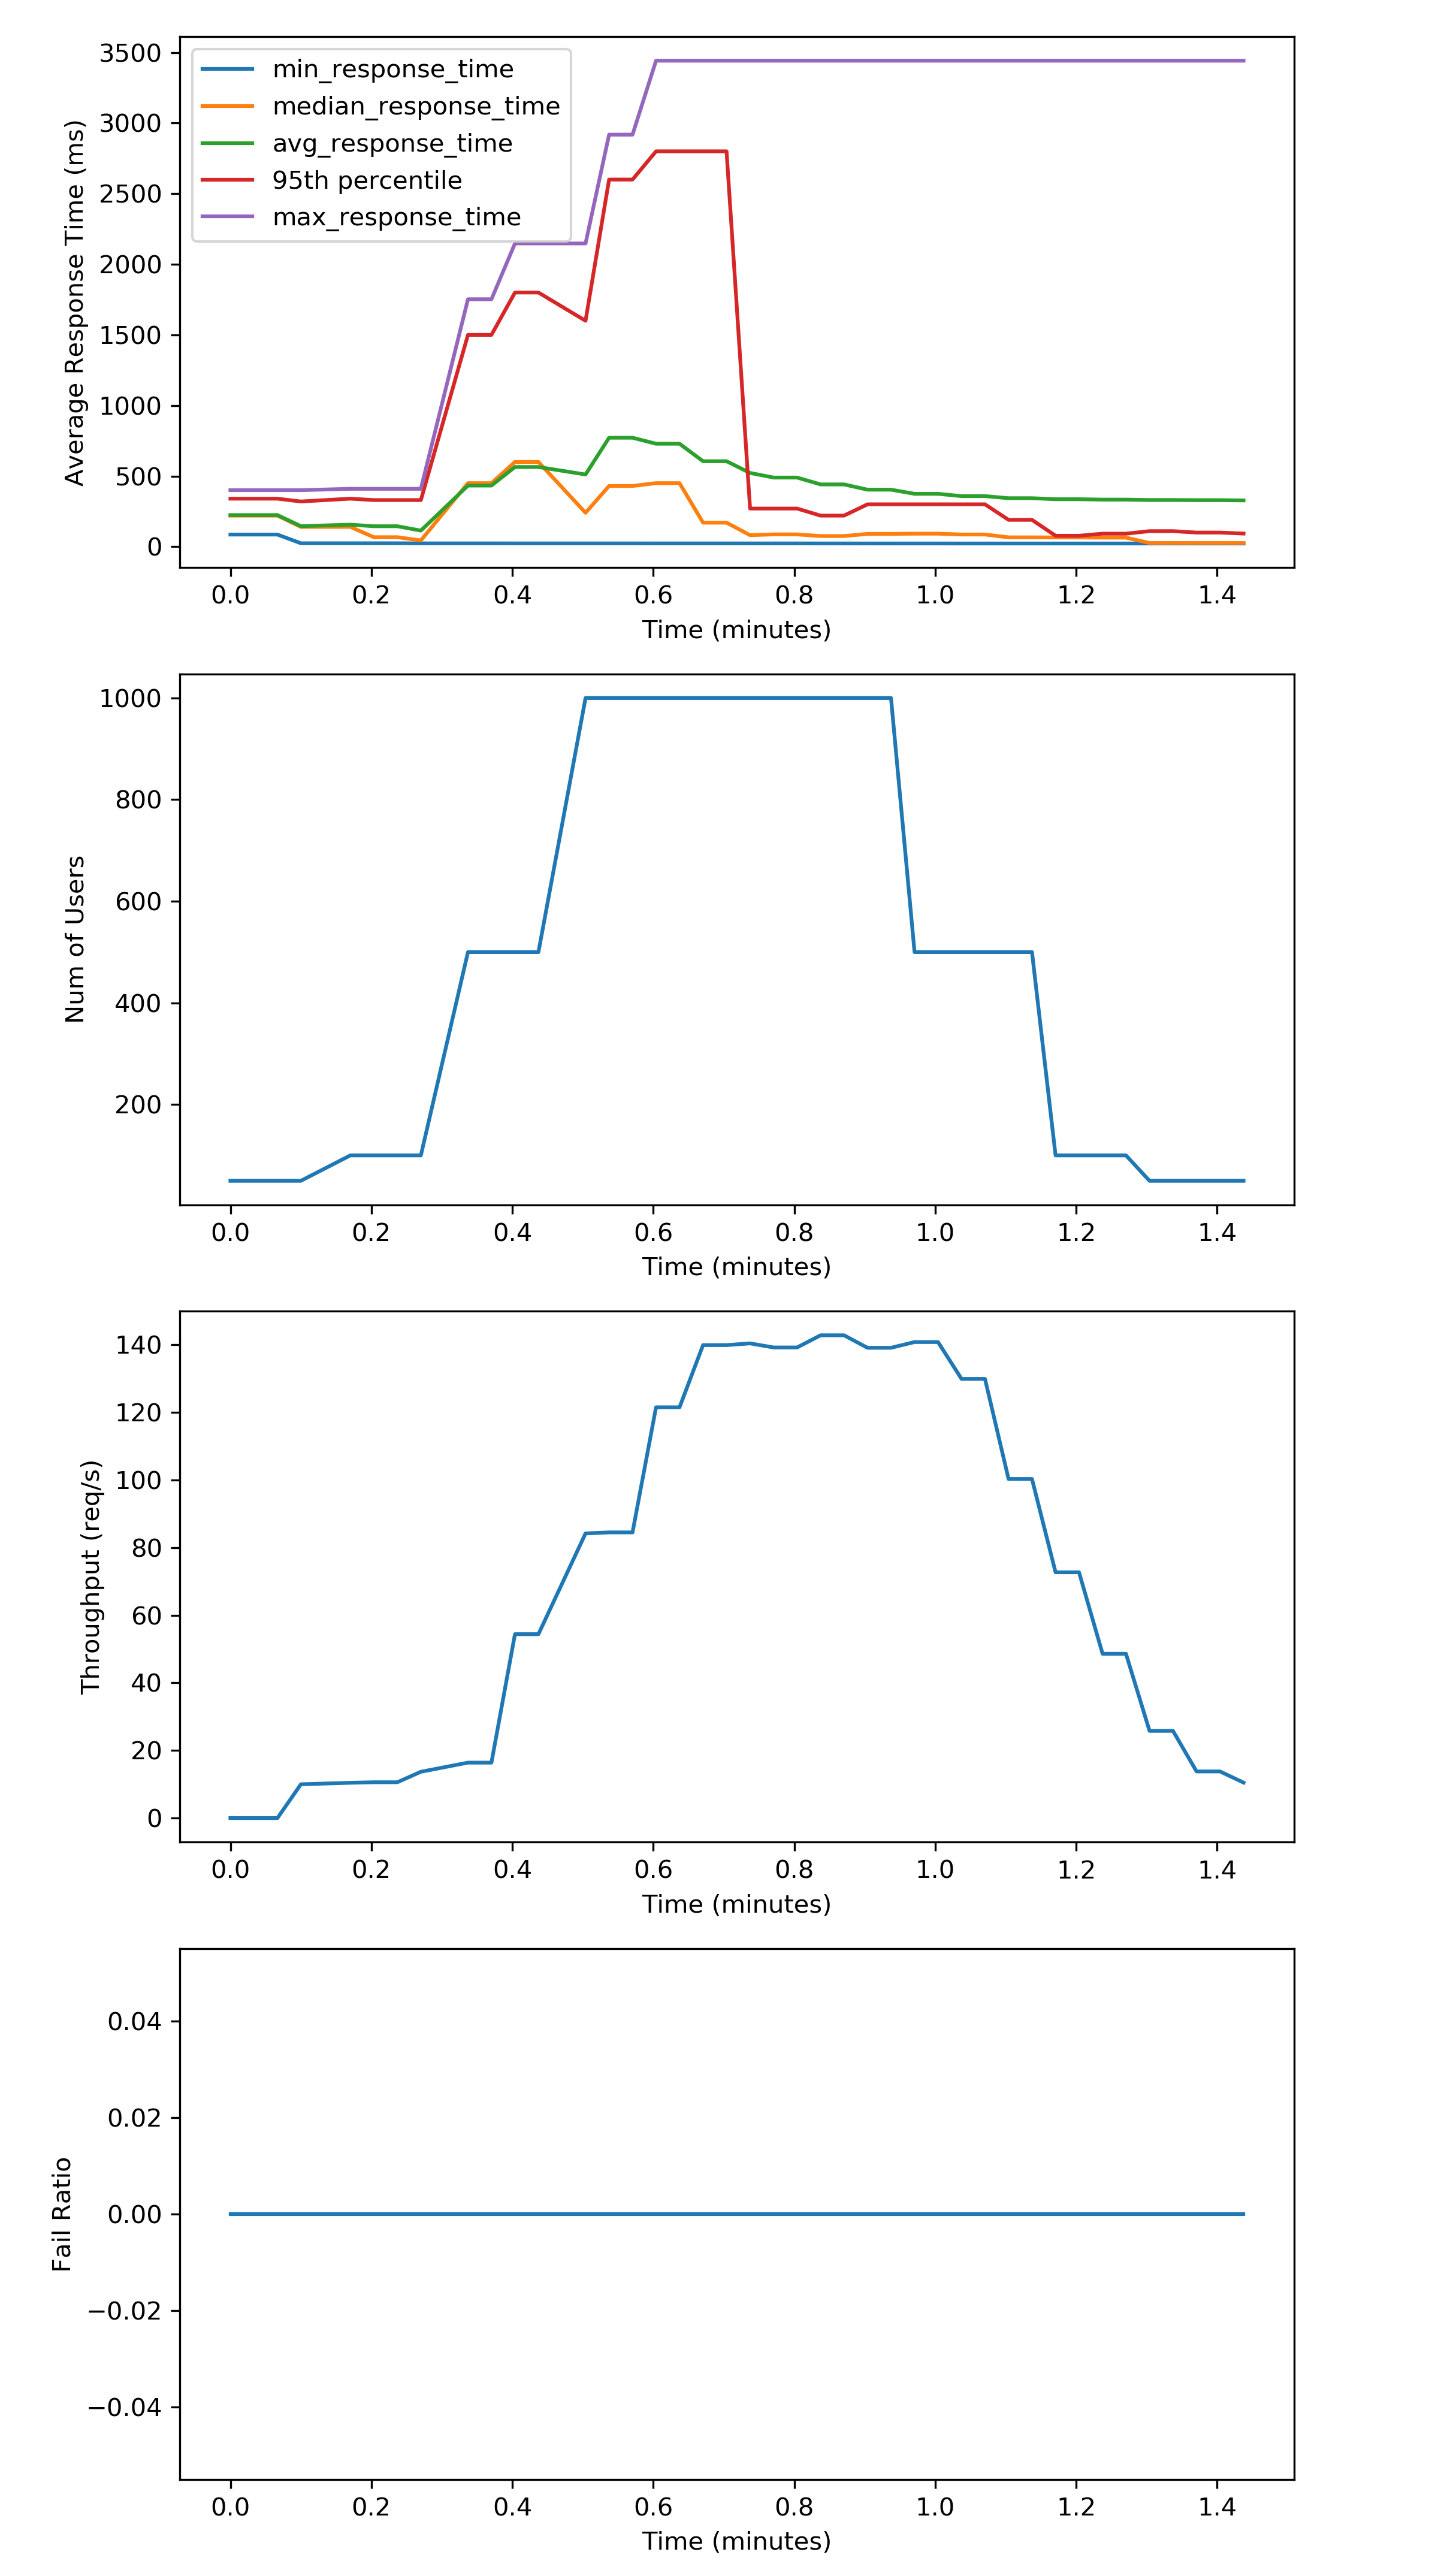
results.head()This will plot the results of running a sequence of different number of users over time.
res = results

import matplotlib.pyplot as plt

%matplotlib inline

plt.figure(figsize=(8,18))
plt.subplot(411)
plt.plot(res['elapsed_min'], res['current_min_response_time'], label='current_min_response_time')
plt.plot(res['elapsed_min'], res['current_response_time_percentile_50'], label='median_response_time')
plt.plot(res['elapsed_min'], res['current_response_time_average'], label='avg_response_time')
plt.plot(res['elapsed_min'], res['current_response_time_percentile_95'], label='95th percentile')
plt.plot(res['elapsed_min'], res['current_max_response_time'], label='current_max_response_time')

plt.xlabel('Time (minutes)')
plt.ylabel('Average Response Time (ms)')
plt.legend()

plt.subplot(412)
plt.plot(res['elapsed_min'], res['user_count'])
plt.xlabel('Time (minutes)')
plt.ylabel('Num of Users')

plt.subplot(413)
plt.plot(res['elapsed_min'], res['total_rps'])
plt.xlabel('Time (minutes)')
plt.ylabel('Throughput (req/s)')

plt.subplot(414)
plt.plot(res['elapsed_min'], res['fail_ratio'])
plt.xlabel('Time (minutes)')
plt.ylabel('Fail Ratio')

filename = filename.replace('.csv', '')
plt.savefig(filename + '.png', dpi=300)
plt.savefig(filename + '.pdf')
plt.show()
The resulting figure looks like this:
In case you need to sense something other than what is already being measured (like the replication factor) just like other measurements, you can add a custom_sensing() function and return a dictionary of the variables that you are trying to sense. Here is an example:
def custom_sensing():
    import random
    return {'random':random.random()}

lt.custom_sensing = custom_sensing
These values will appear in the measurements with a prefix of custom_. See the example file for a full implementation.

