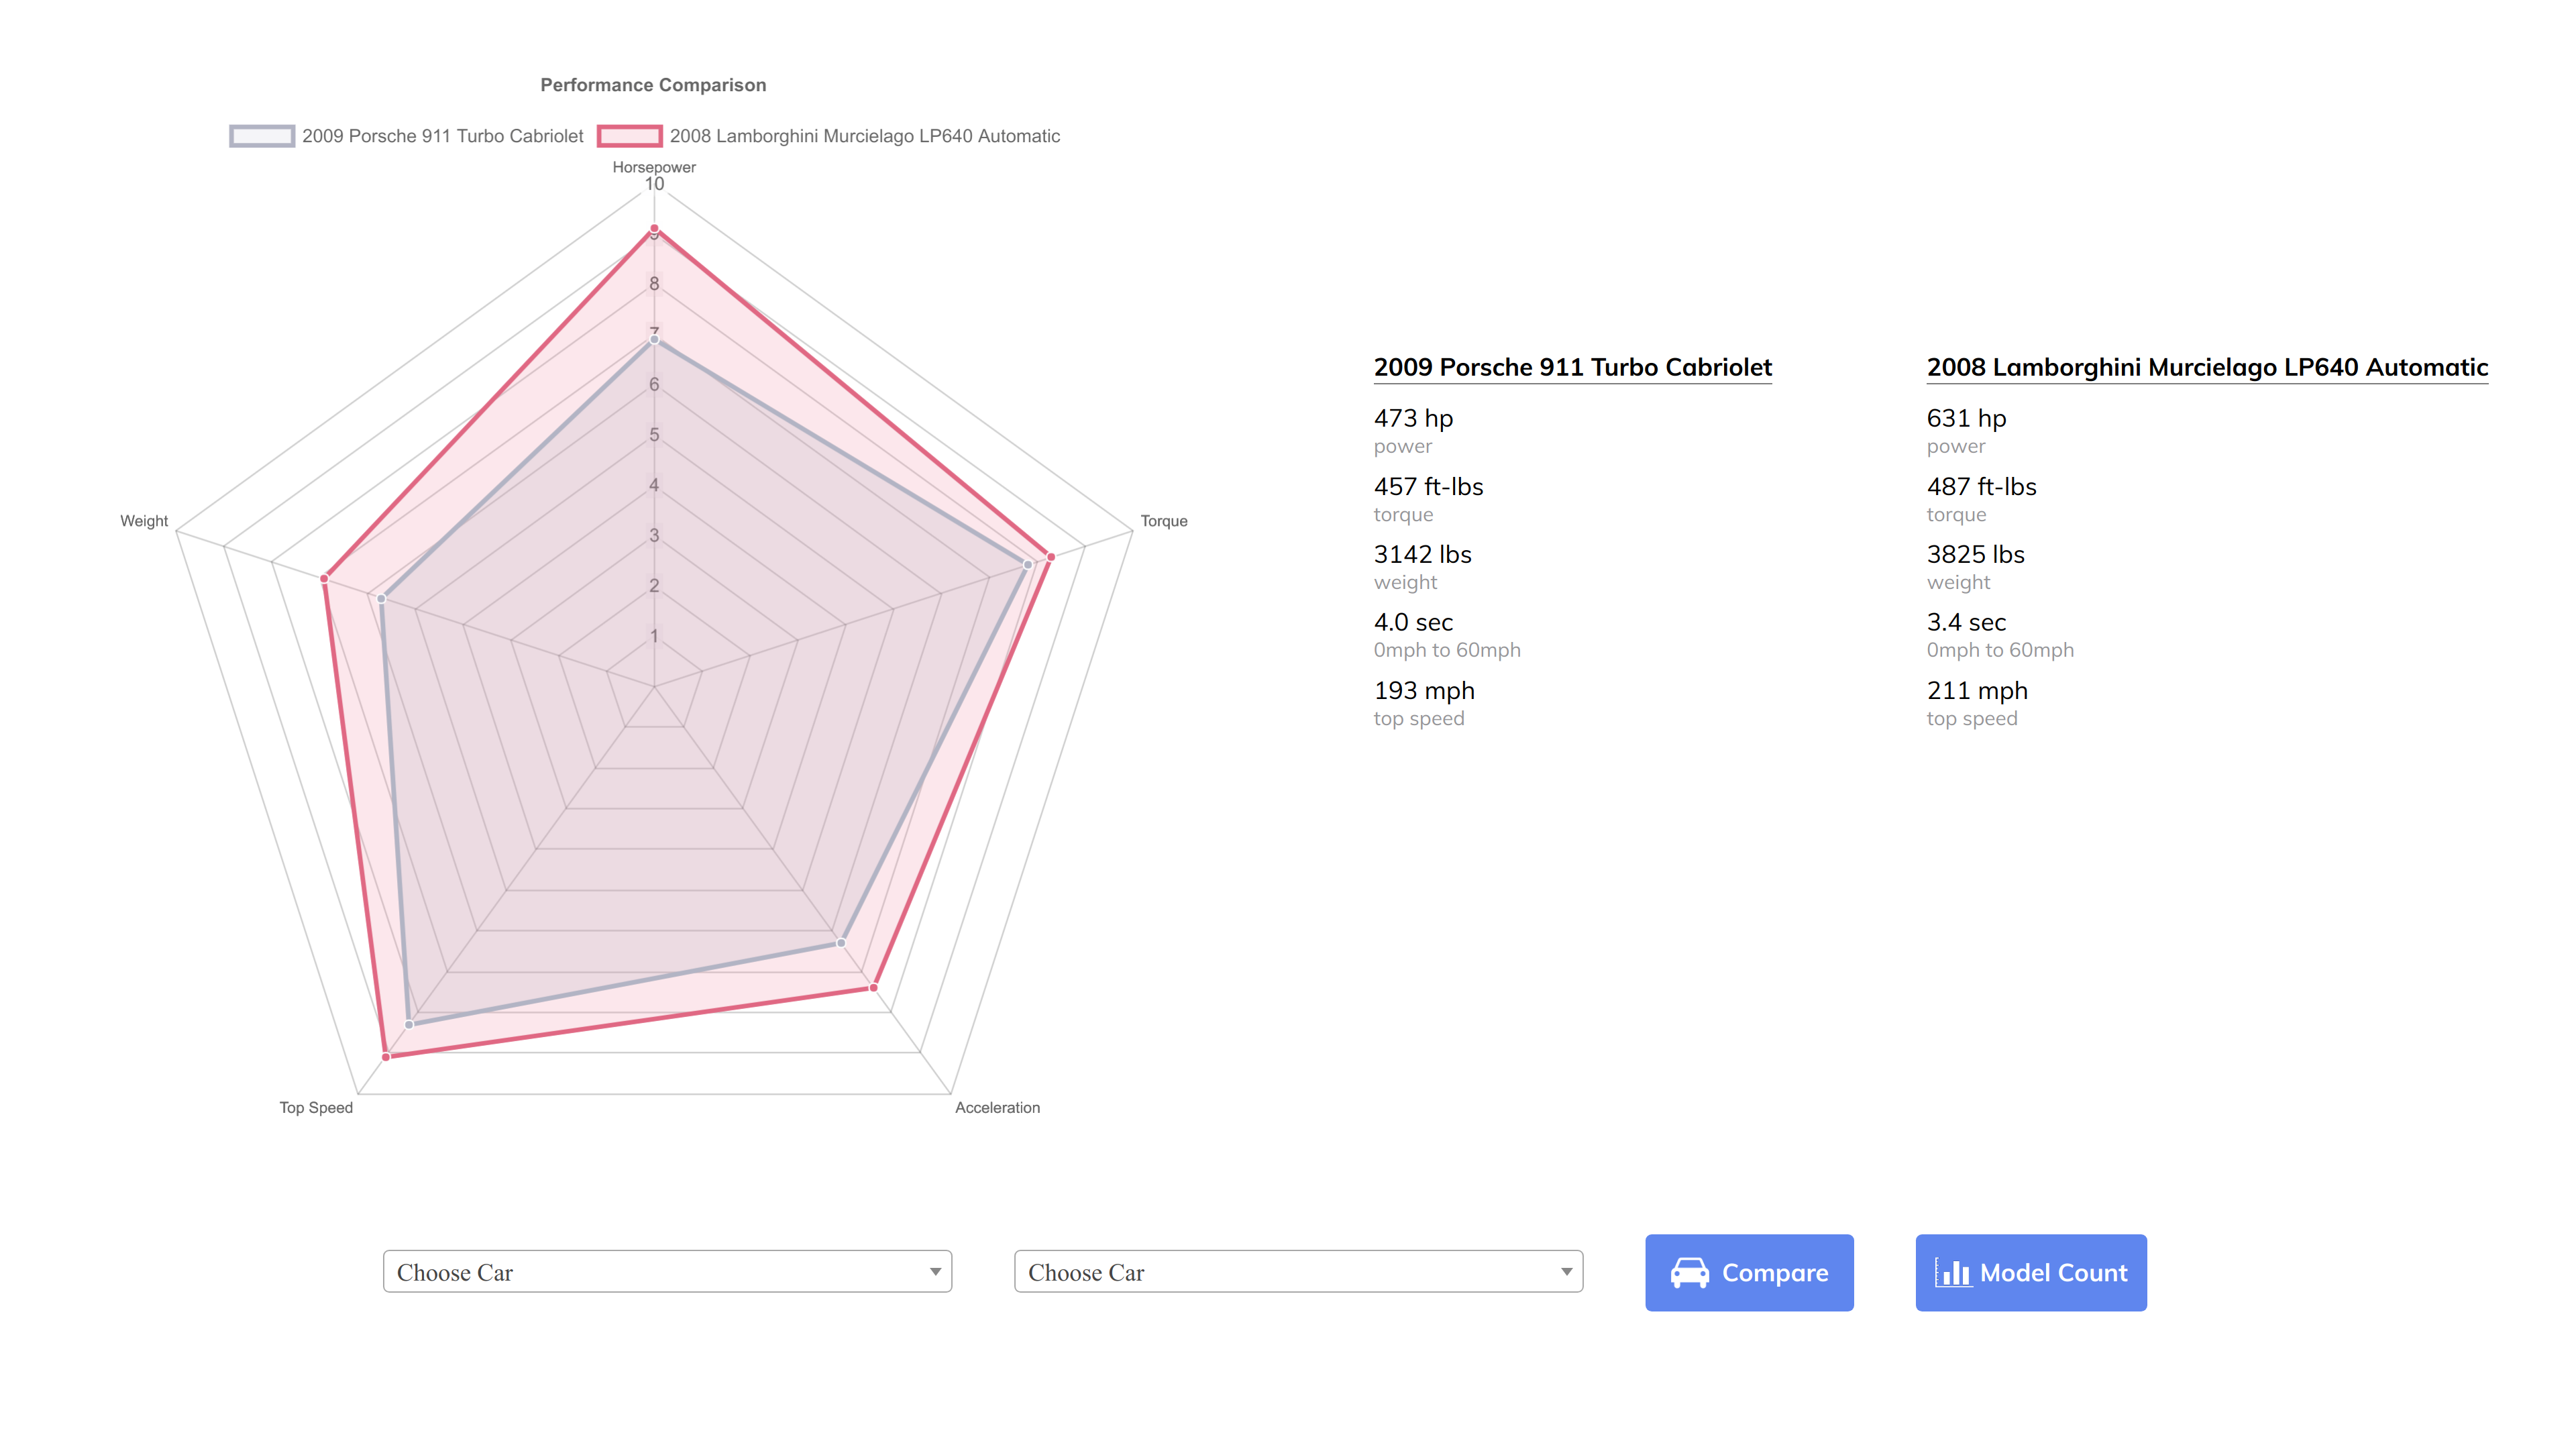
Car Data Visualizer is a lightweight web application that displays performance comparisons between different cars and charts manufactures of performance models. It's a frontend application that utilizes Javascript, CSS3, and HTML5, as well as the Chart.js library.
Users may select cars from two searchable drop-down menus and click compare to render a radar chart that displays the normalized ratings of five performance categories. The selected cars' specifications are dynamically displayed next to the radar chart, changing upon re-render of the chart.
Users may display the manufactures bar chart, which displays the number of models over 400HP for each make. The display is a sliding pane activated on the click of the model count button; the pane animation is done with CSS3 and Javascript triggers the opening and closing actions.
Future add-ons include a map displaying the countries of origin of performance models, with a hover tooltip indicating the number of models from that particular country. Also planned is the utilization of the d3.js library to create more dynamic data visualizations.

