Can I add an audio breakpoint for debugging the source code?
- In Sources > Add a breakpoint by clicking the line number > Right click and select "Edit Breakpoint...".
- Click Add Action > Select "Play Sound" to hear a beep sound each time the statement is executed.
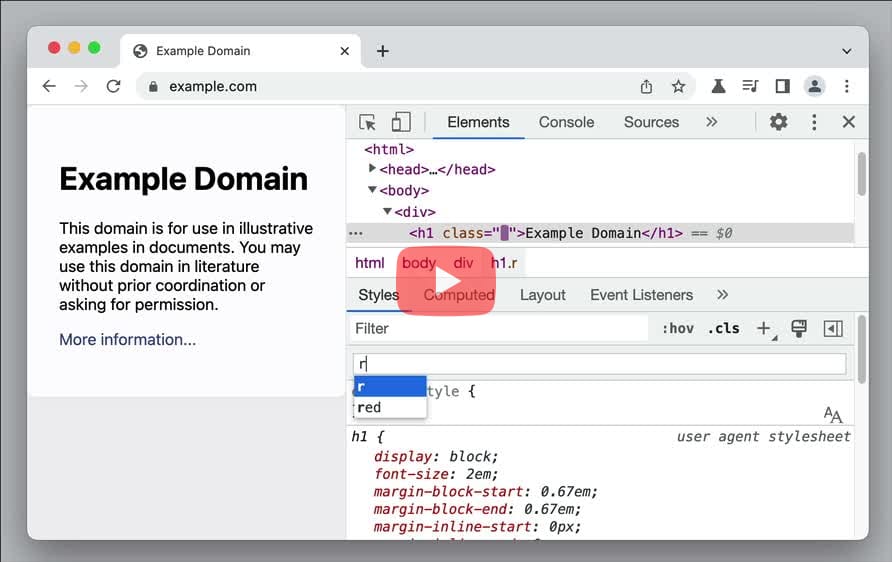
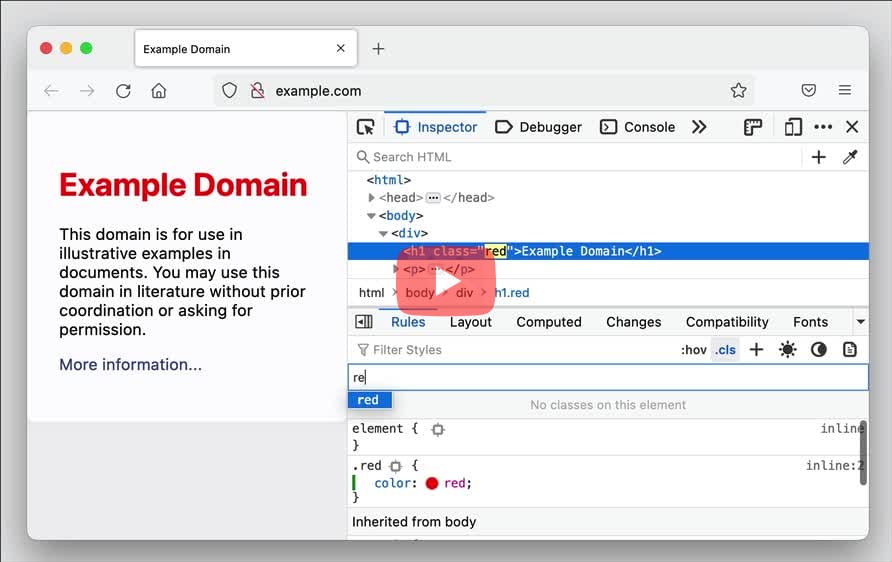
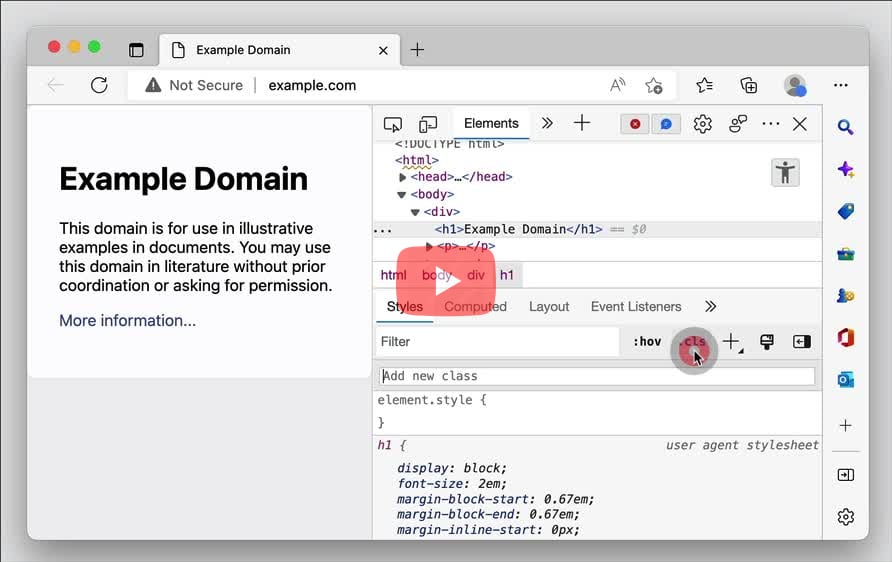
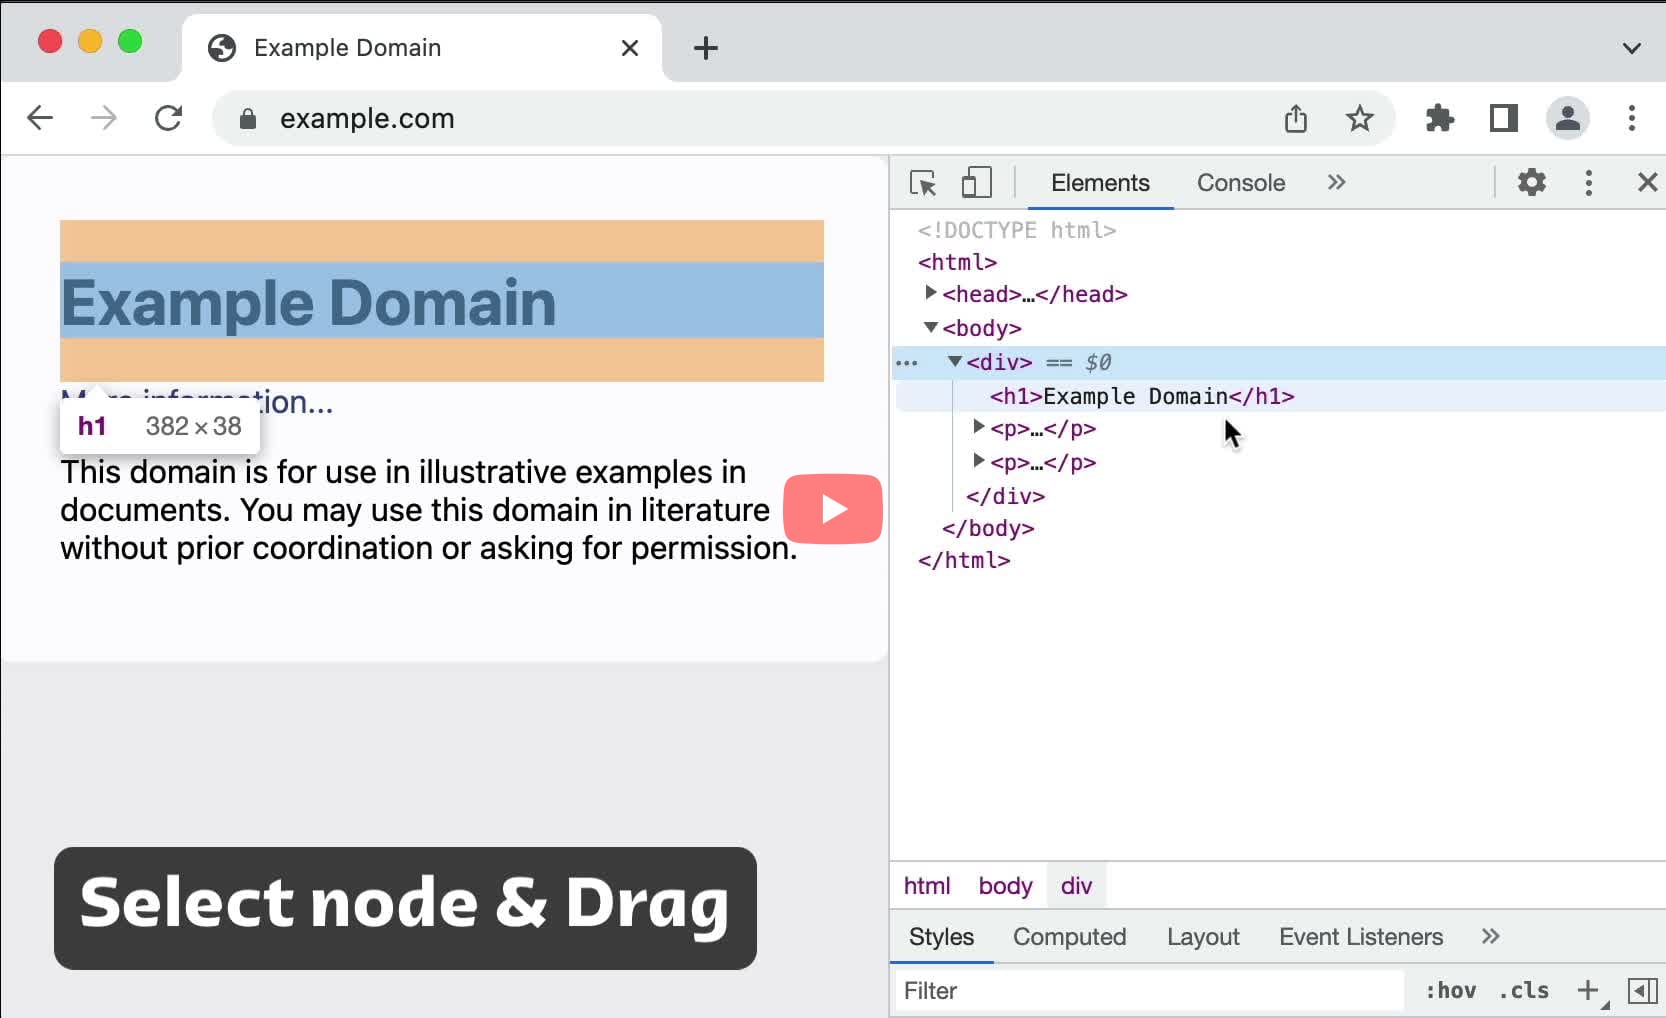
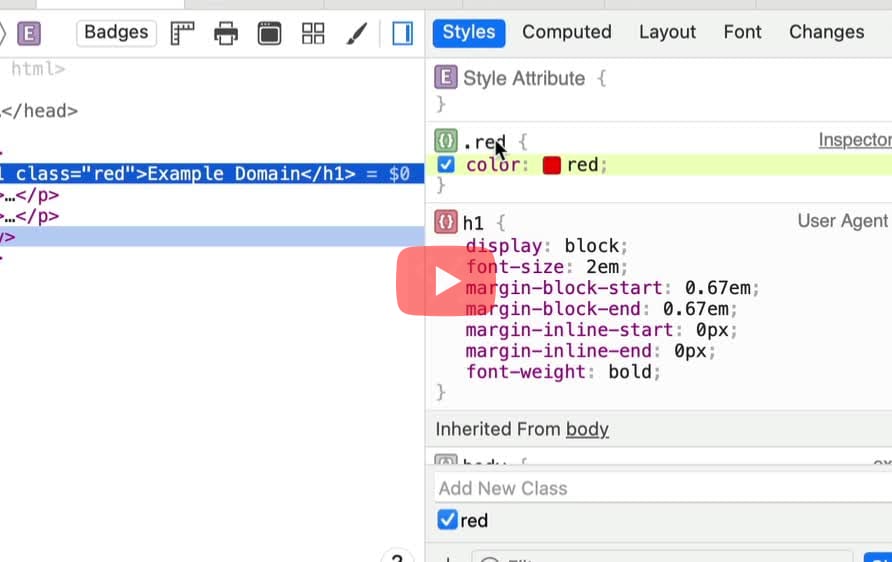
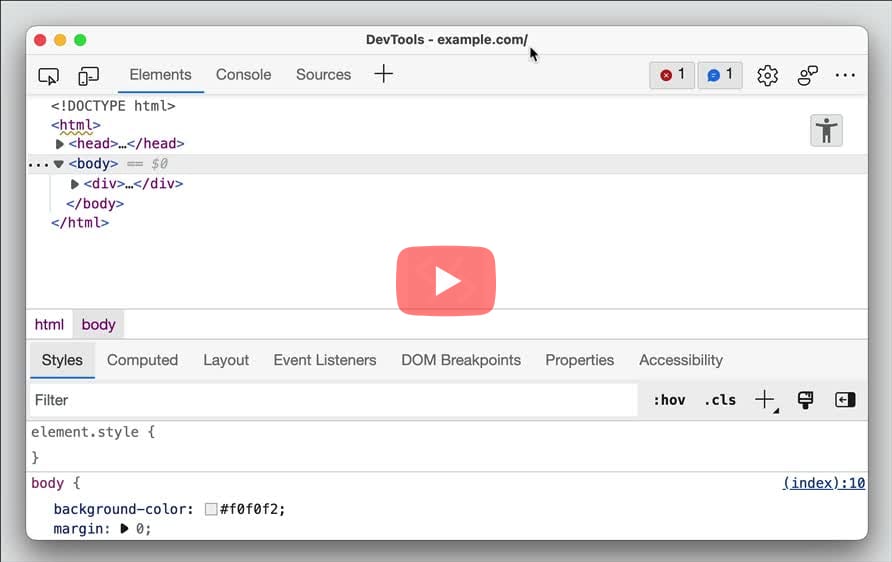
Can I add an existing CSS class to an HTML element?
- Inspect the element > Look for ".cls" button in the Styles pane next to the Filter field.
- Click the button and search for the existing class names to add to the element.
- Inspect the element > Look for ".cls" button in the styles section next to the Filter Styles field.
- Click the button and search for the existing class names to add to the element.
Edge:
- Select the element in the DOM tree. In the Styles pane, click .cls and search from the list of available class names in the Add new class textbox. Press
Enterto add the class to the element.
- Inspect the element > Look for "Classes" button in bottom row of the styles section next to the Filter field.
- Click the button and search for the existing class names to add to the element.
- Inspect the element > Open the "attributes" tab
- Add a new class into the class field, known classes from the page and CSS will automatically be suggested.
- If there is no class attribute yet, add it as a new attribute and known classes will also be automatically suggested.
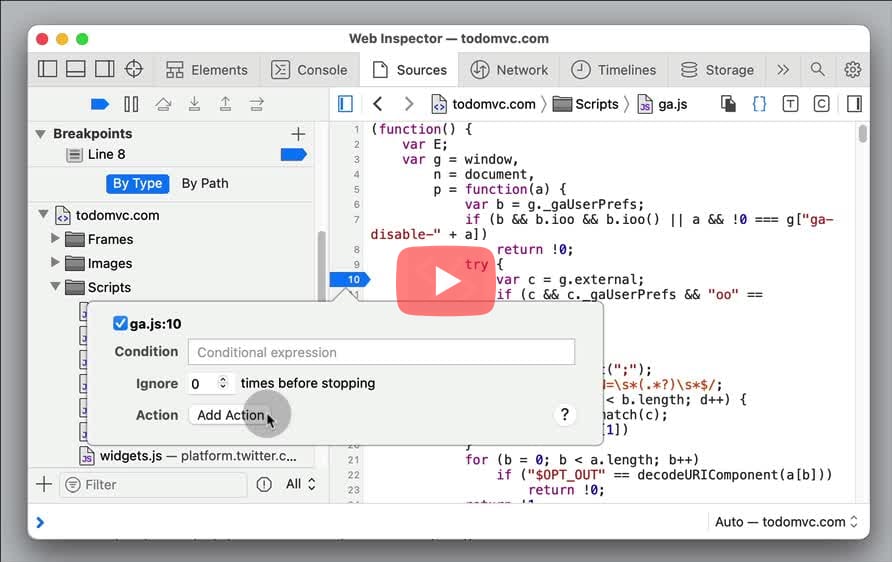
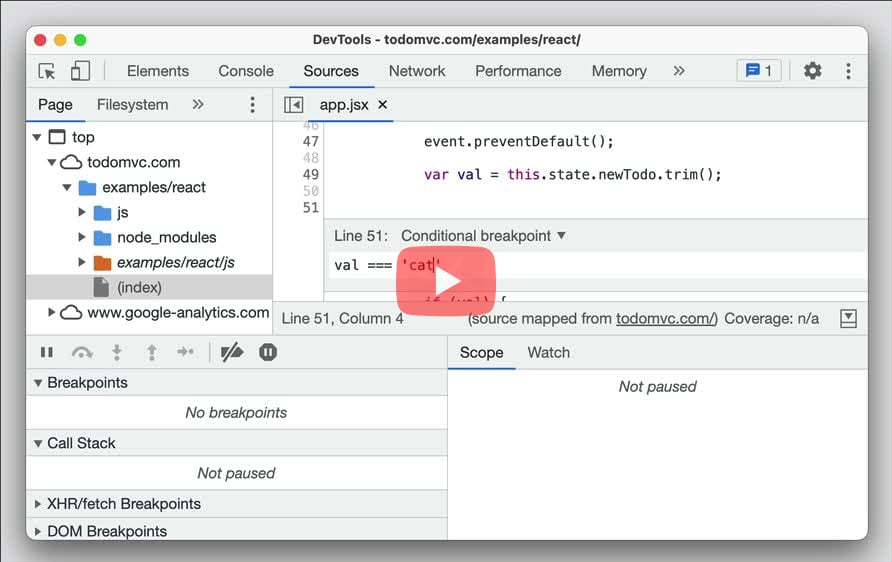
Can I set a conditional breakpoint for debugging?
- In Sources, right click the line number and select "Add a conditional breakpoint..."
- Input the conditional expression on which the execution should pause, and press
Enter.
- In Debugger, right click the line number and select "Add condition"
- Input the conditional expression on which the execution should pause, and press
Enter.
Edge:
- In the Sources panel, right click on the line number and select Add conditional breakpoint.... Enter the conditional expression and press
Enter.
Can I add a custom device for a responsive design mode?
- Open Settings (
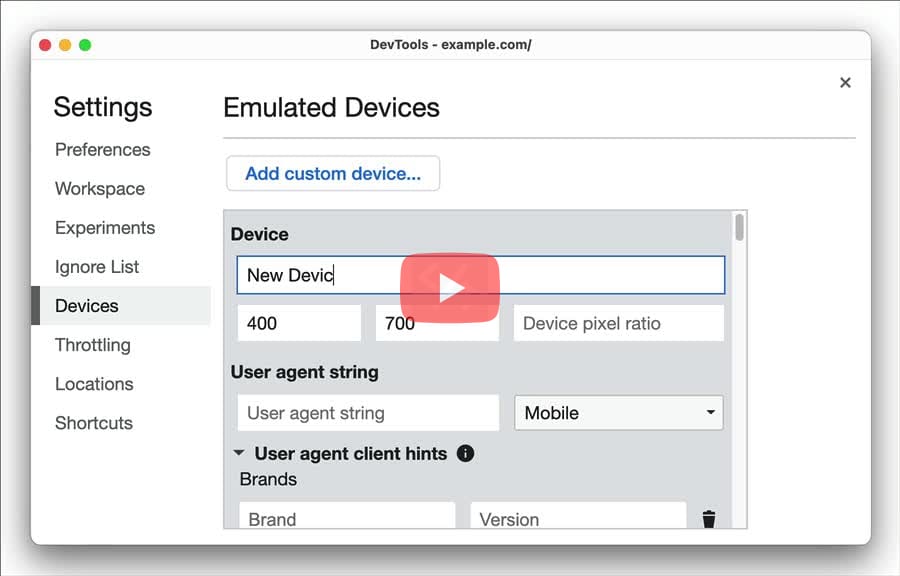
F1orShift+?) > Devices > Click "Add custom device...". - Enter the "Device Name" and other details associated with the device. Click the "Add" button.
- Open Responsive Design Mode (
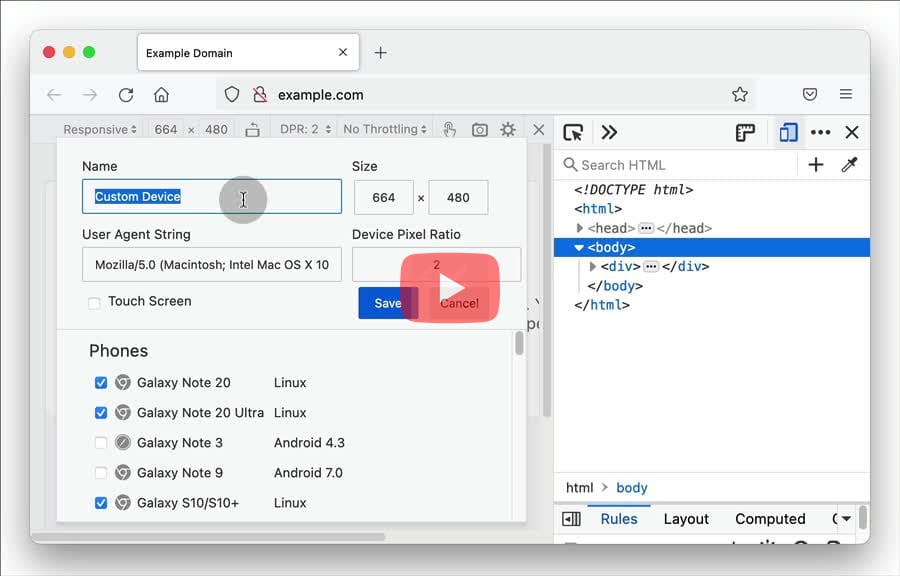
Cmd+Opt+MorCtrl+Shift+M) > Select "Edit List..." from the list of devices. - In Device Settings, click "Add Custom Device..." > Enter the Name and other related details > Click "Save".
Edge:
- Open Settings (
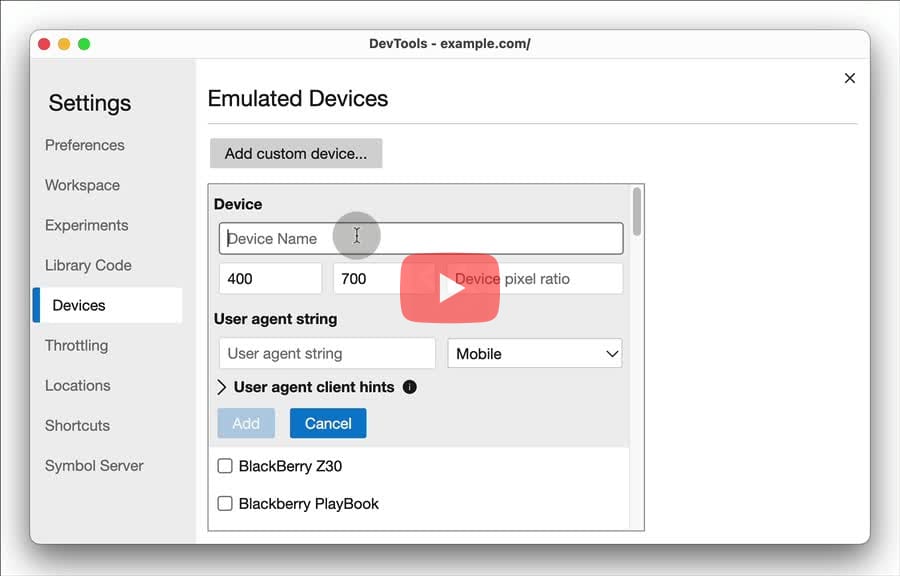
F1orShift+?) > Devices > Click Add custom device.... - Enter the Device Name and other details associated with the device. Click Add to add the custom device.
- Click the "+" button in the workspace, double-click anywhere in the free space, or press
Ctrl/Cmd+N - Once the new device is added you can resize it manually and set the device and emulation options with the Emulation settings.
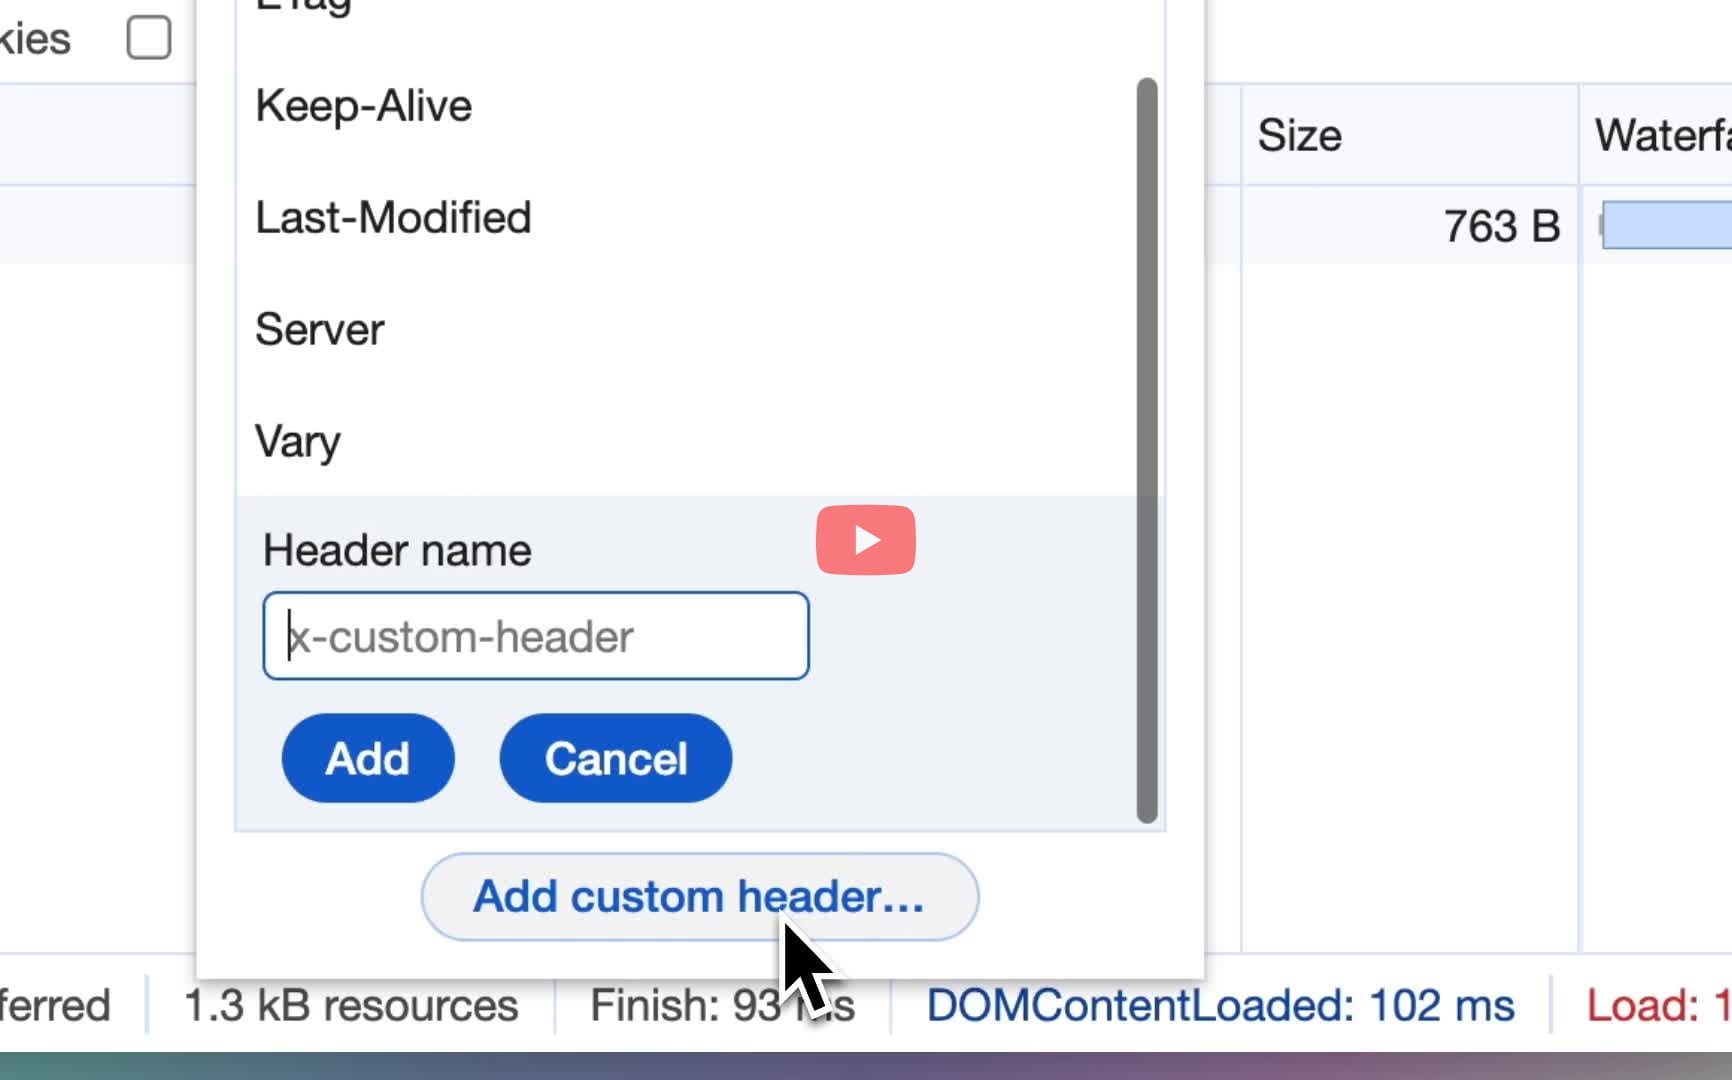
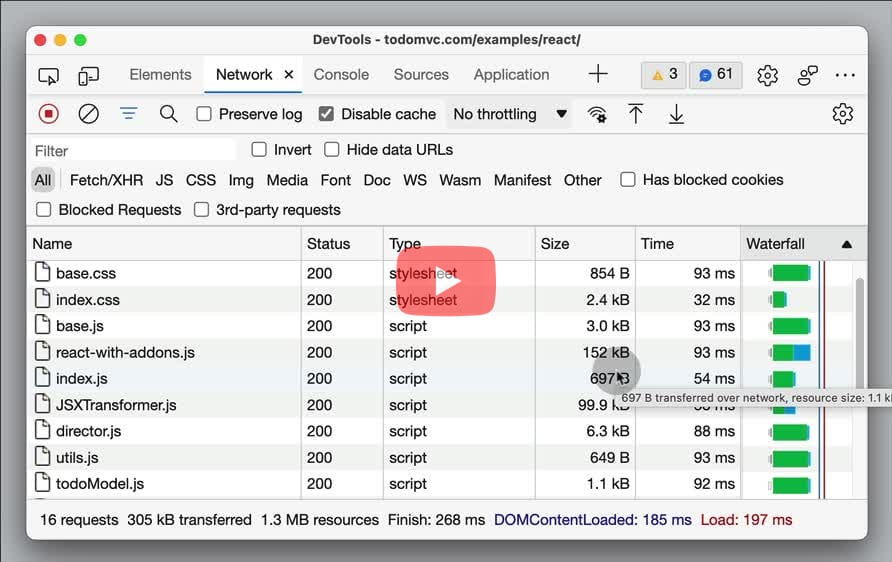
Can I add custom header columns to the Network requests table?
- In the Network panel, right click on the column headers > Response Headers > Manage Header Columns.
- In the Manage Header Columns popup window, click "Add Custom Header". Enter the custom header name, and click Add to add a new column to the Network requests table.
Edge:
- In the Network panel, right click on the column headers > Response Headers > Manage Header Columns.
- In the Manage Header Columns popup window, click "Add Custom Header". Enter the custom header name, and click Add to add a new column to the Network requests table.
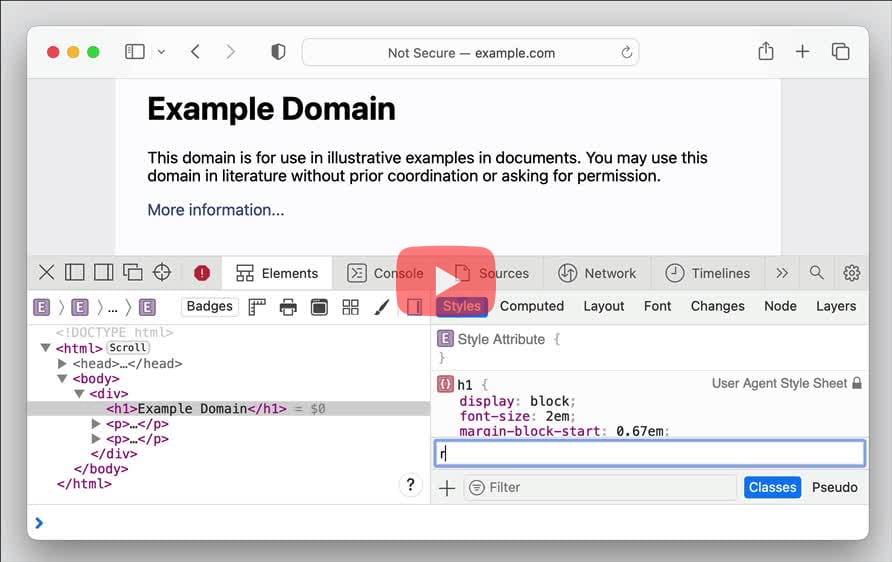
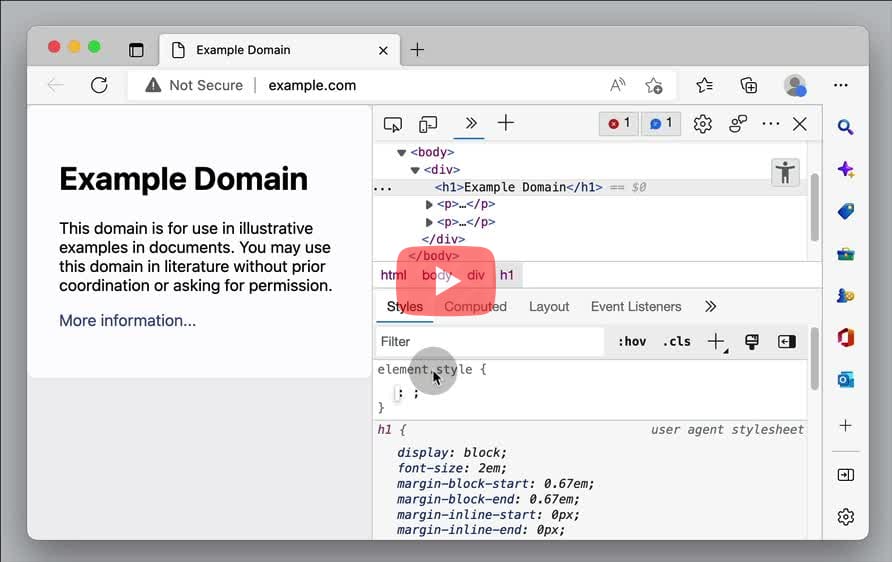
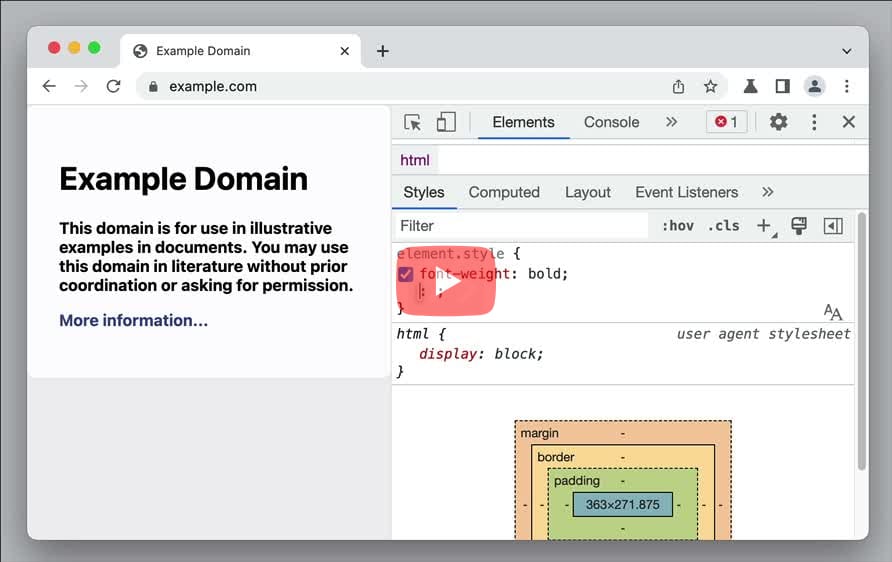
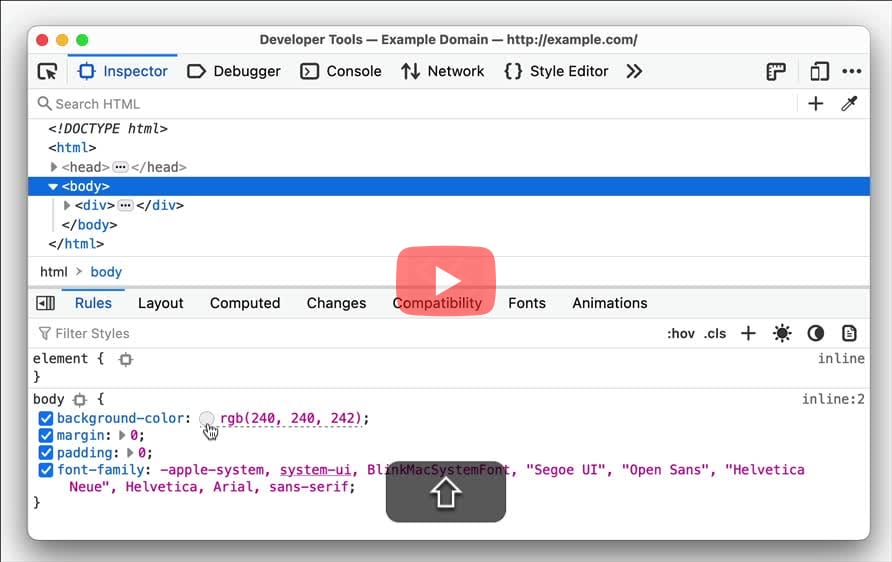
Can I add inline styles to an HTML element?
- Inspect element > In the Styles pane, click "element.style" to input the inline style.
- Inspect element > In the Rules pane, click "element" to input the inline style.
Edge:
- Select the element in the DOM tree > In the Styles pane, click element.style and add the property: value declaration.
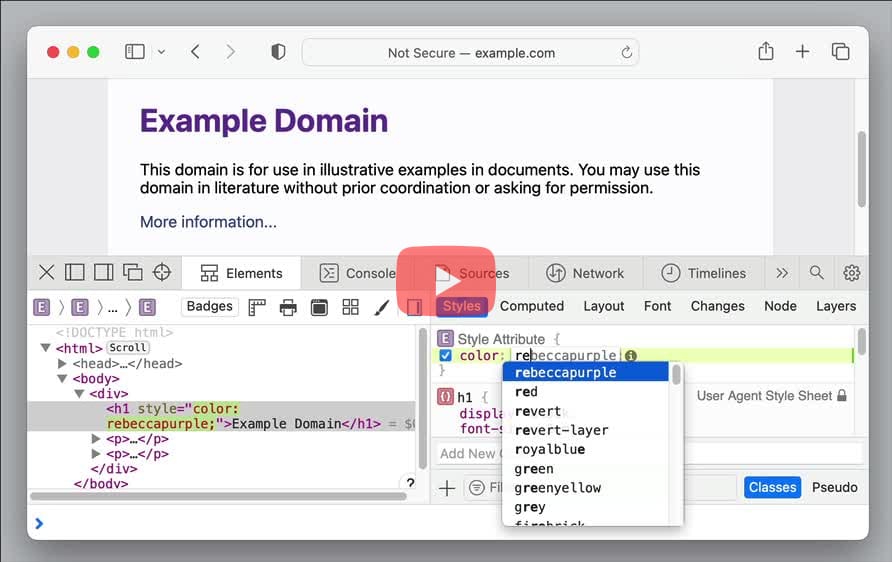
- Inspect element > In the Styles pane, click inside "Style Attribute" braces to input the inline style.
- Inspect element > In the Styles pane, click "property" under "element.style" to input the inline style.
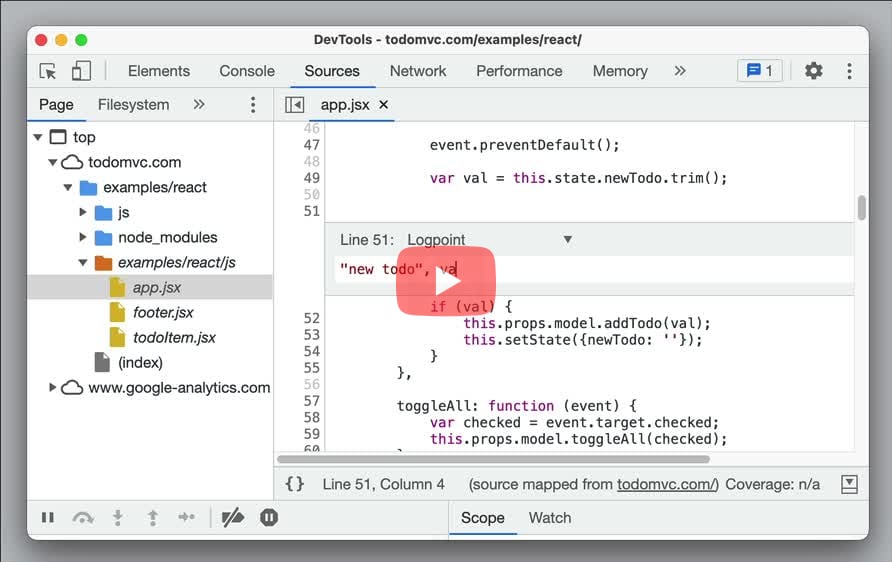
Can I add log points to source code for debugging?
- In Sources > Right click on the line number and select "Add logpoint..." > Input the log statement to print in the Console without actually writing
console.logstatements.
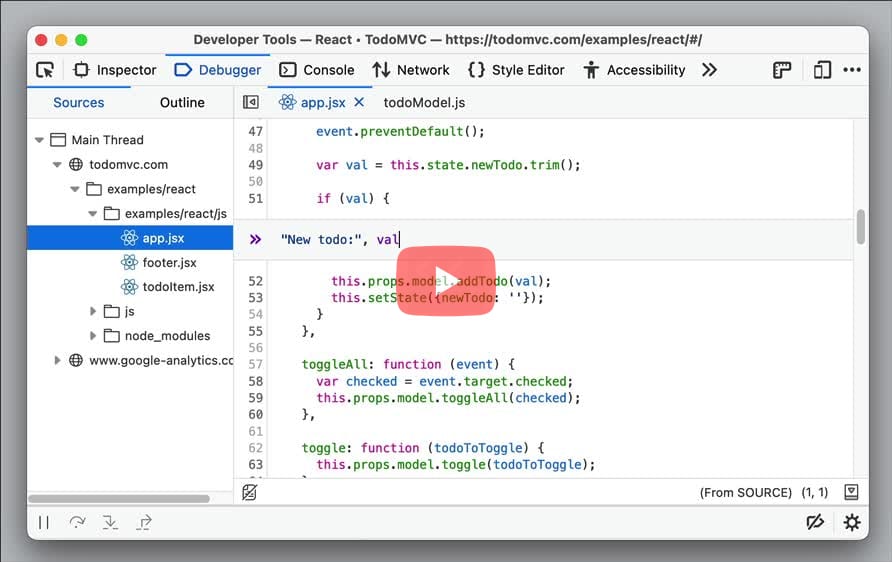
- In Debugger > Right click on the line number and select "Add log" > Input the log statement to print in the Console without actually writing
console.logstatements.
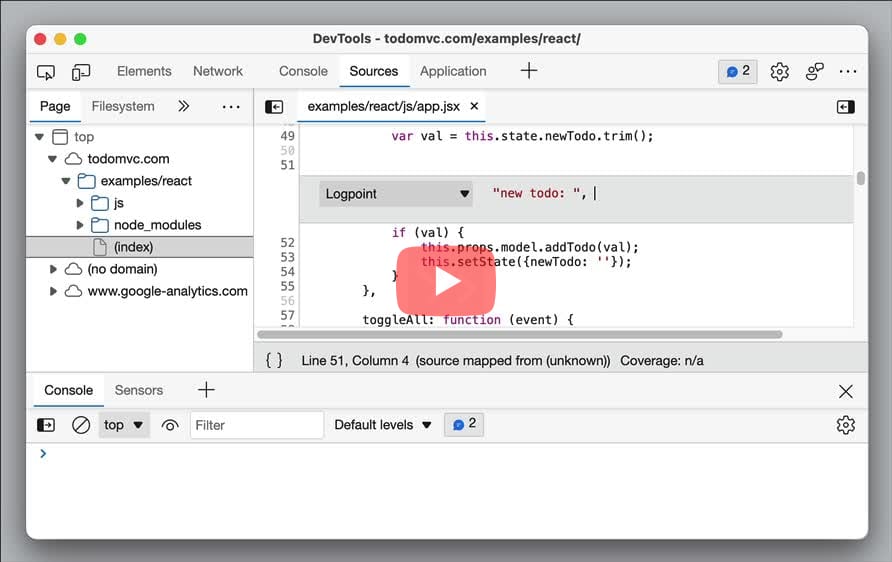
Edge:
- In Sources > Right click on the line number and select "Add logpoint..." > Input the log statement to print in the Console without actually writing
console.logstatements.
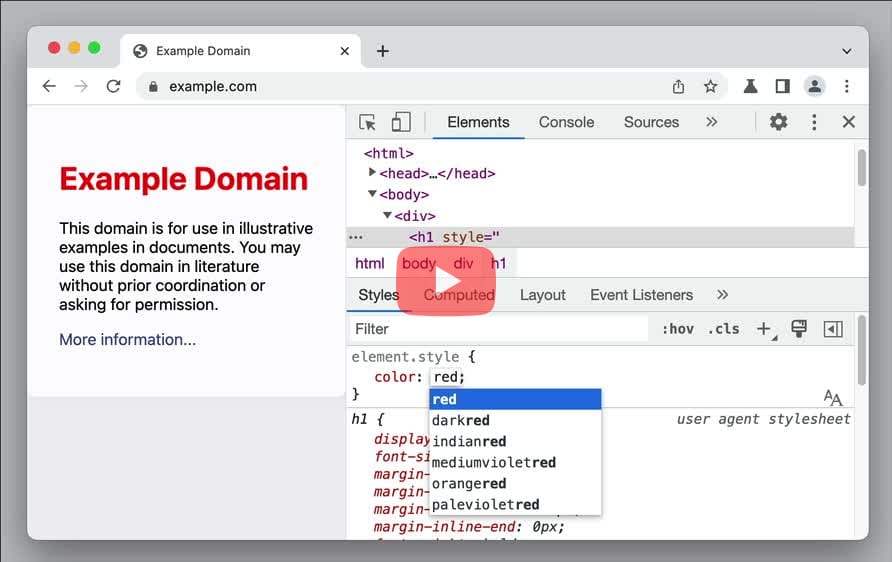
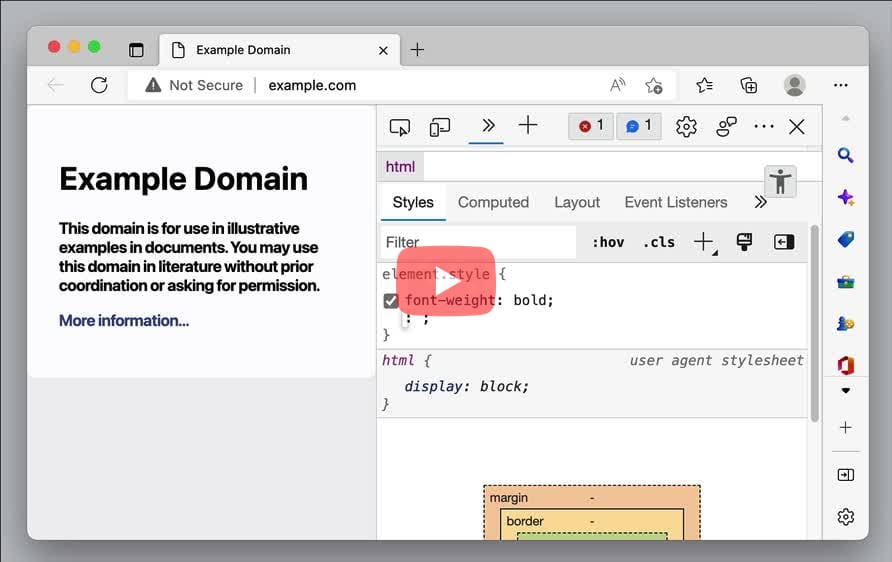
Can I autocomplete style declaration just using values?
- Inspect an element > Navigate to the styles section (next to the DOM tree).
- Add new styles by directly entering the values like "bold", "italic" etc., and the devtools will automatically suggest the corresponding
<property>: <value>pair for the given input.
Edge:
- Inspect an element > Navigate to the styles section (next to the DOM tree).
- Add new styles by directly entering the values like "bold", "italic" etc., and the devtools will automatically suggest the corresponding
<property>: <value>pair for the given input.
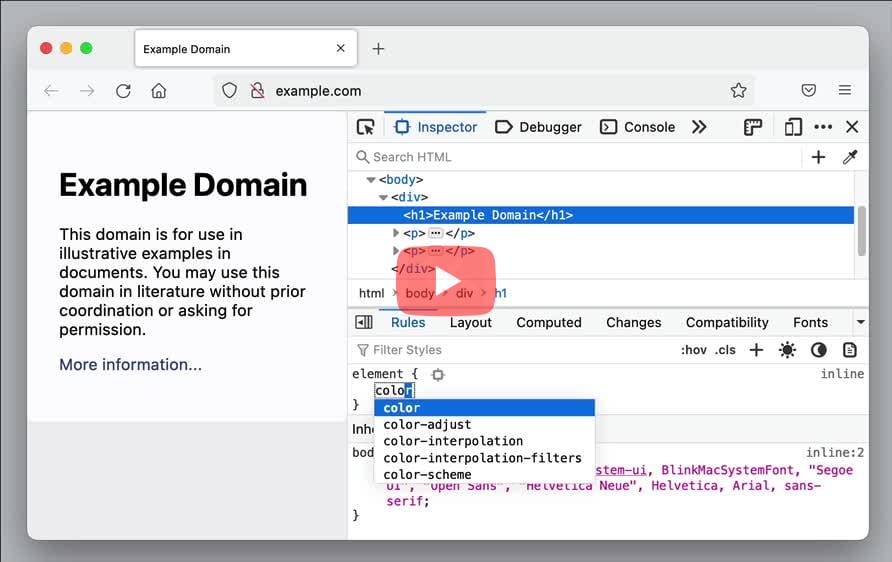
- Inspect an element > Navigate to the styles tab
- Click the "propety" field under the style you want to edit, and the devtools will automatically suggest appropriate style properties and values for the current element.
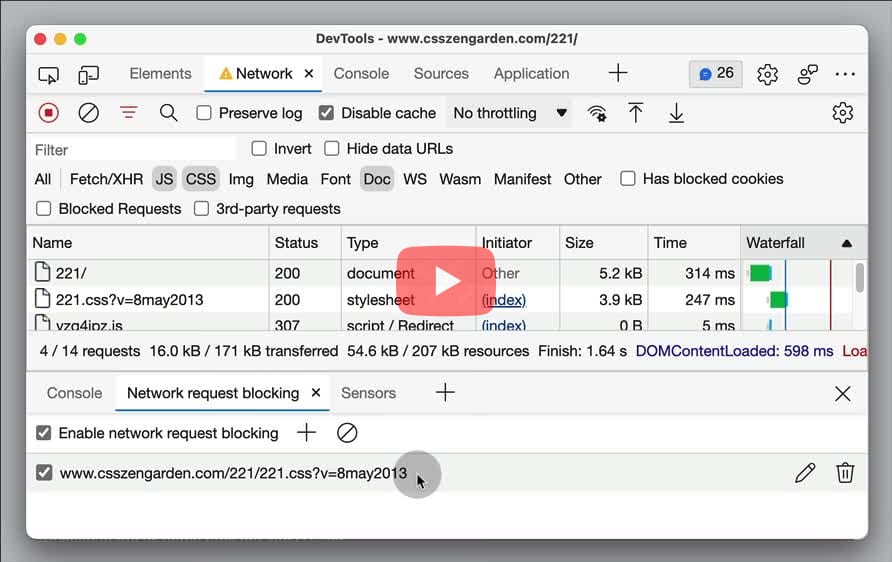
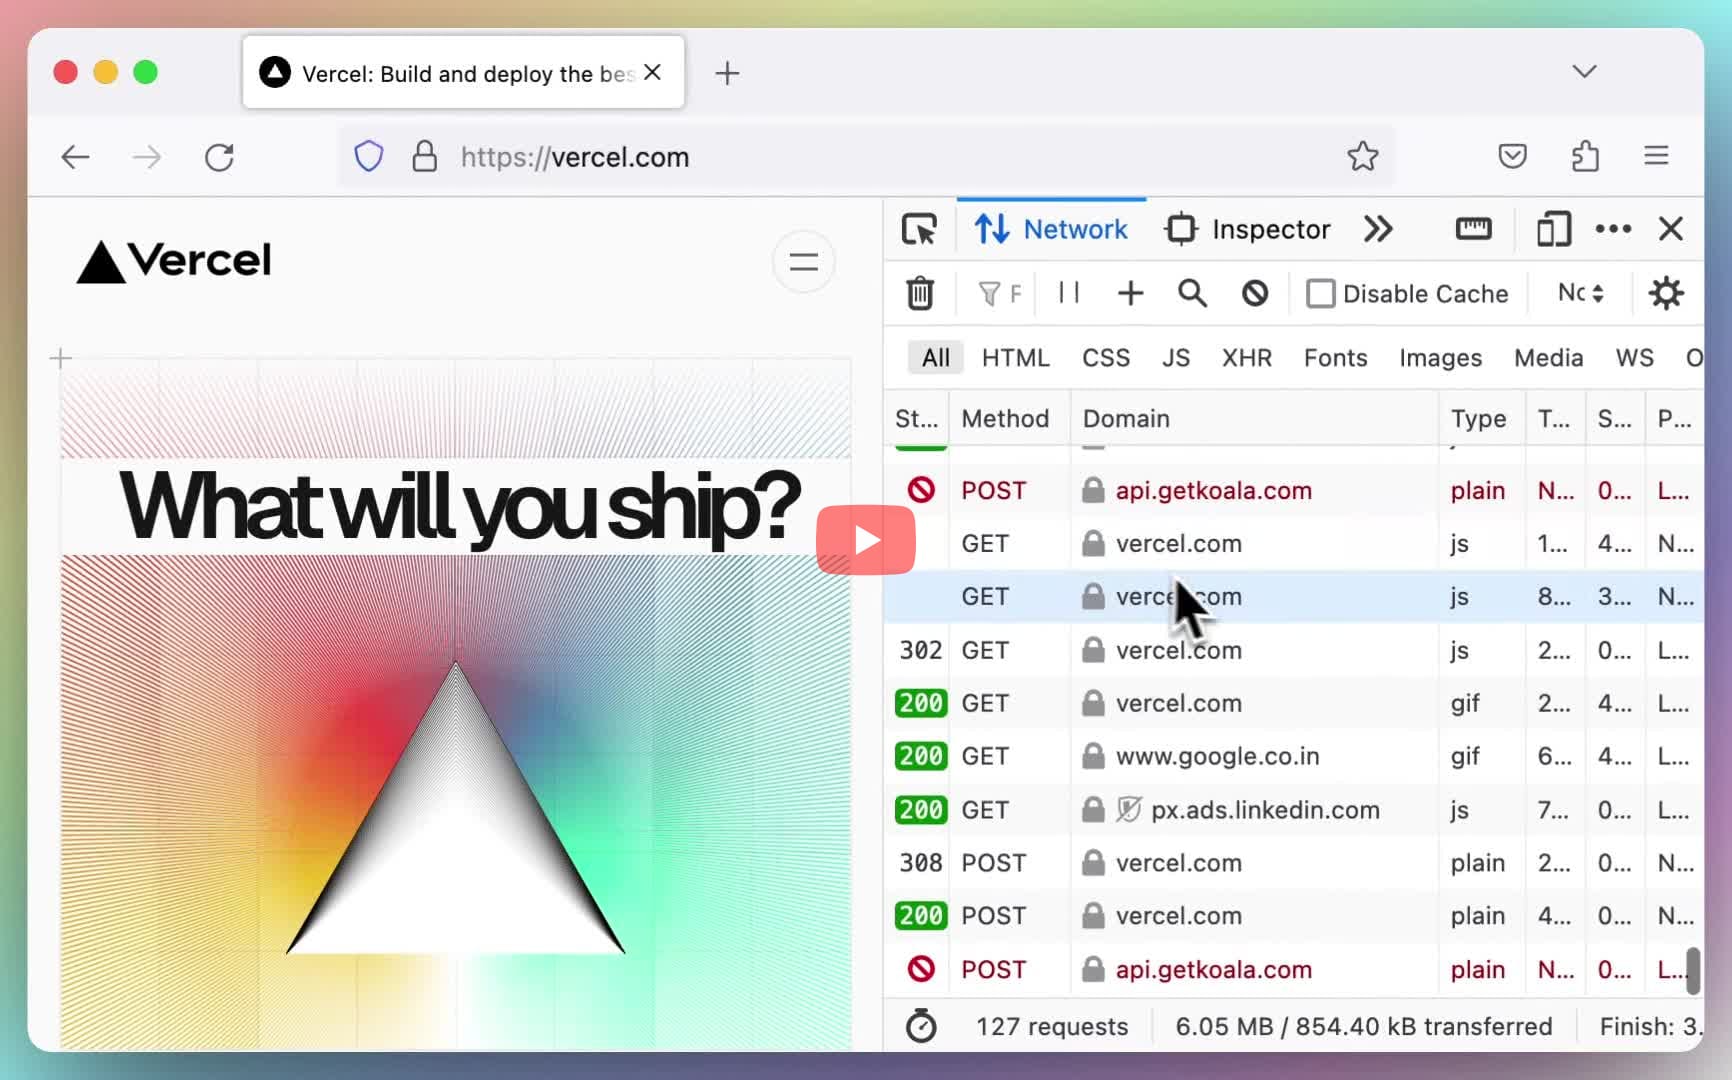
Can I block all network requests of a domain?
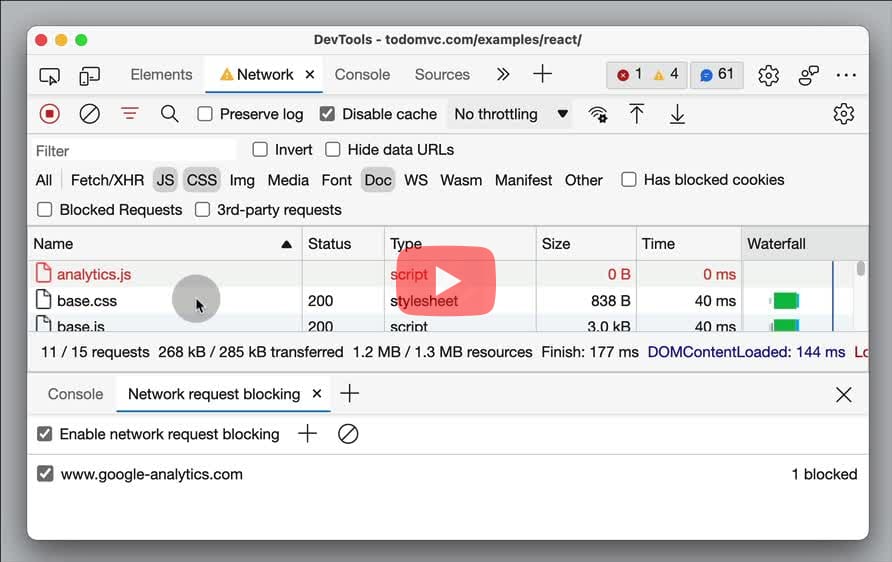
- In the Network panel, right click on the network request, and select "Block request domain". This will open the Network request blocking drawer that will let you manage blocked network requests.
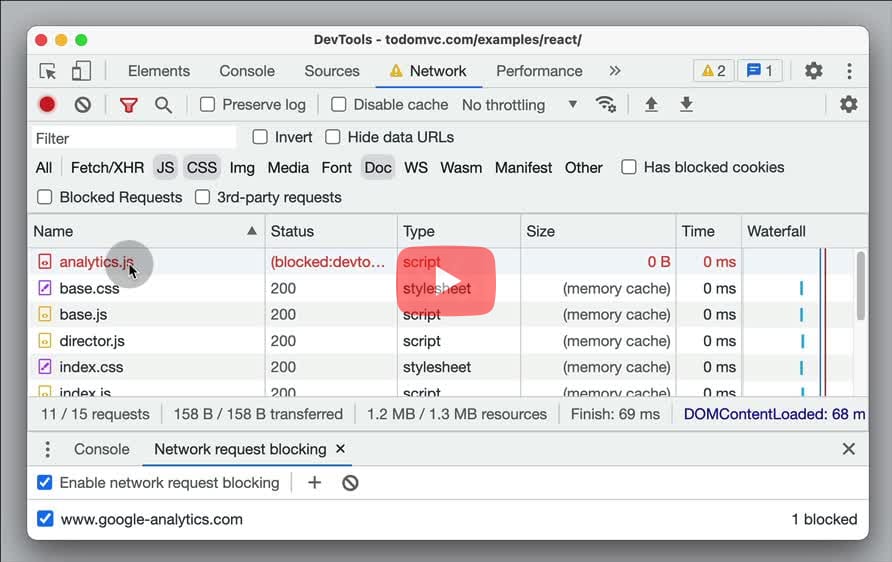
- In the Network panel, click the "Request Blocking" icon in the toolbar to open the Blocking pane in the left sidebar.
- Add the domain name in the input box to block all the matching requests for that domain.
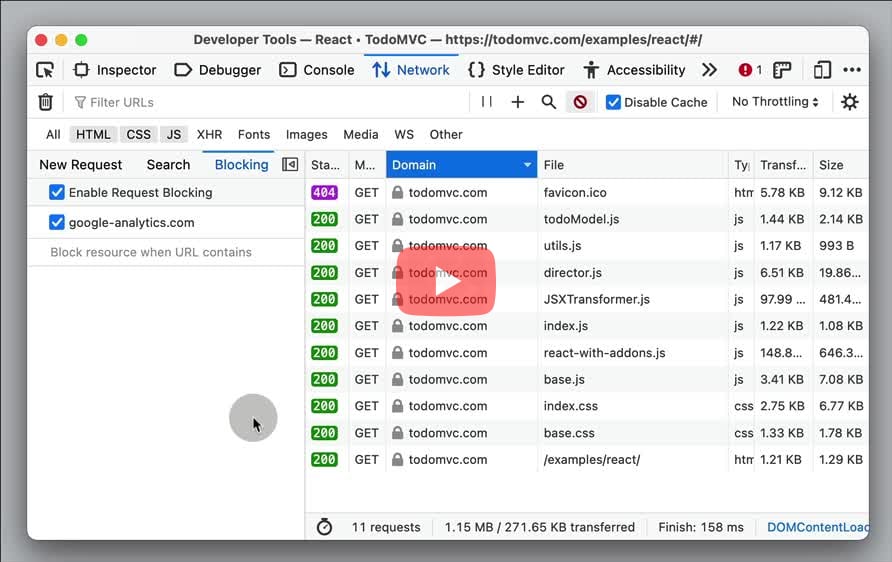
Edge:
- In the Network panel, right click on the network request, and select Block request domain. This will open the Network request blocking drawer that will let you manage the blocked network requests.
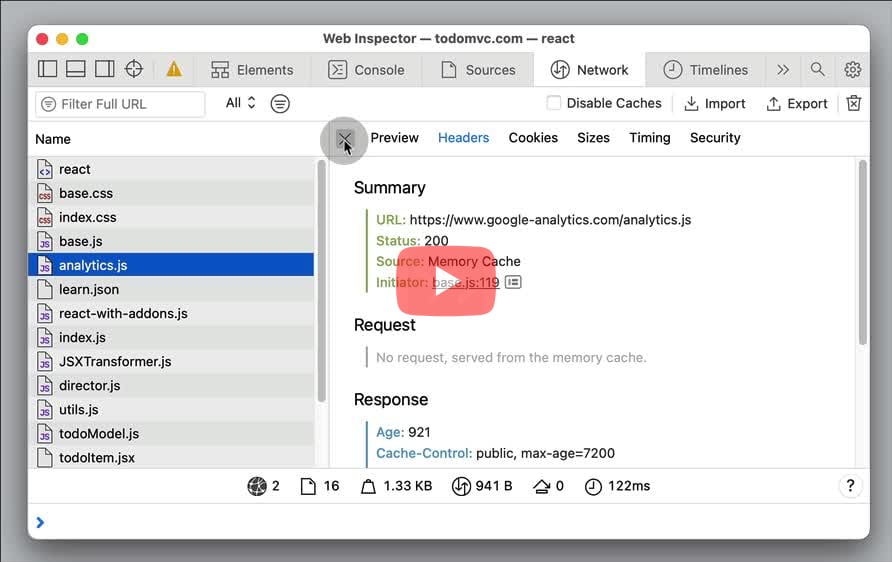
- In the Network panel, right click on the request and select "Create Response Local Override" to open the Sources panel, which contains the list of all local overrides.
- Right click on the override and select "Edit Local Override...". Add the domain name in the URL pattern and use Status as
404: Not Foundto block all the network requests for that domain.
Can I block all network request matching a URL pattern?
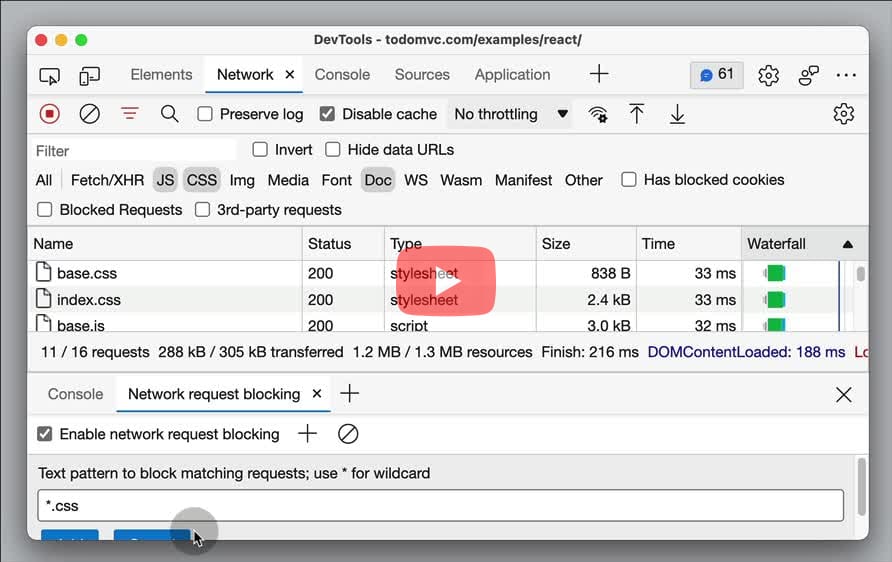
- Open Command Menu (
Cmd+Shift+PorCtrl+Shift+P) > Run "Show Network request blocking". This will open the Network request blocking drawer. - Click the "+" button and add the URL pattern > Add. Reload the page for the changes to take effect. Filter on Blocked Requests by enabling the checkbox in the toolbar.
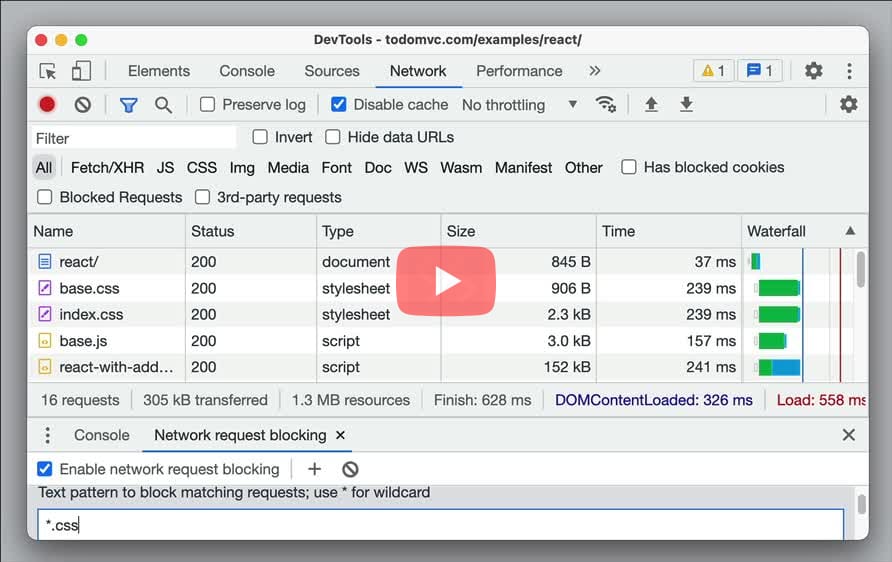
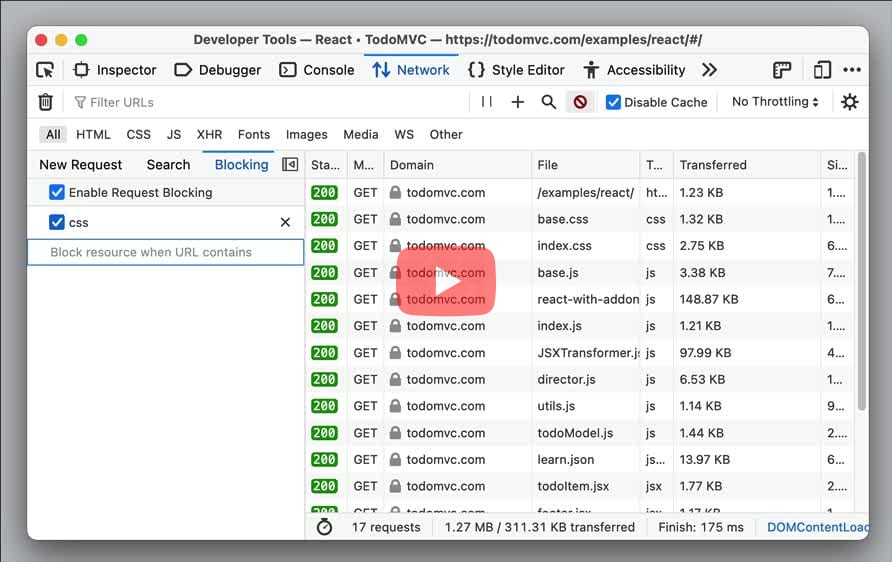
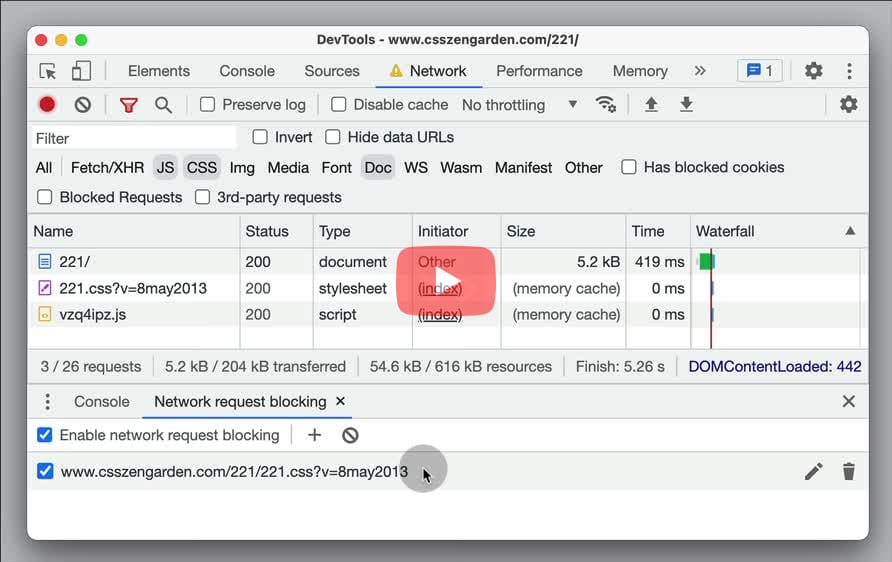
- In the Network panel, click the Request Blocking icon in the toolbar, to open the Blocking pane in the left sidebar.
- Input the URL pattern and press
Enter. Reload the page to see the changes take effect.
Edge:
- Open Command Menu (
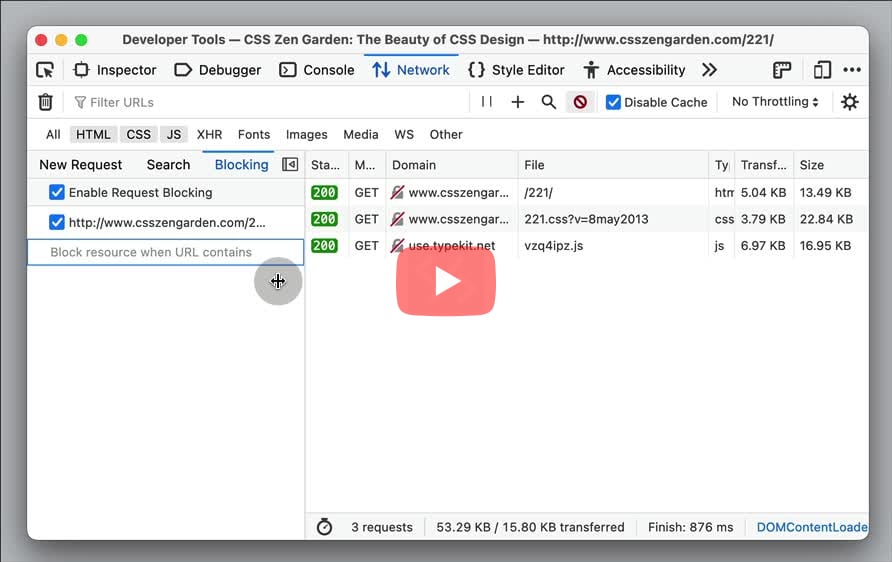
Cmd+Shift+PorCtrl+Shift+P) and Run "Show Network request blocking". PressEnterto open the Network request blocking drawer. - Click the Add pattern button and add the URL pattern > Add. Reload the page for the changes to take effect.
- The number of blocked network requests is indicated in the Network request blocking tool. In the Network panel, enable Blocked Requests to filter on the all the requests blocked by the DevTools in the Network table.
- Hover on the URL pattern to either remove or edit the pattern. Click the Remove all patterns button to remove all the URL patterns.
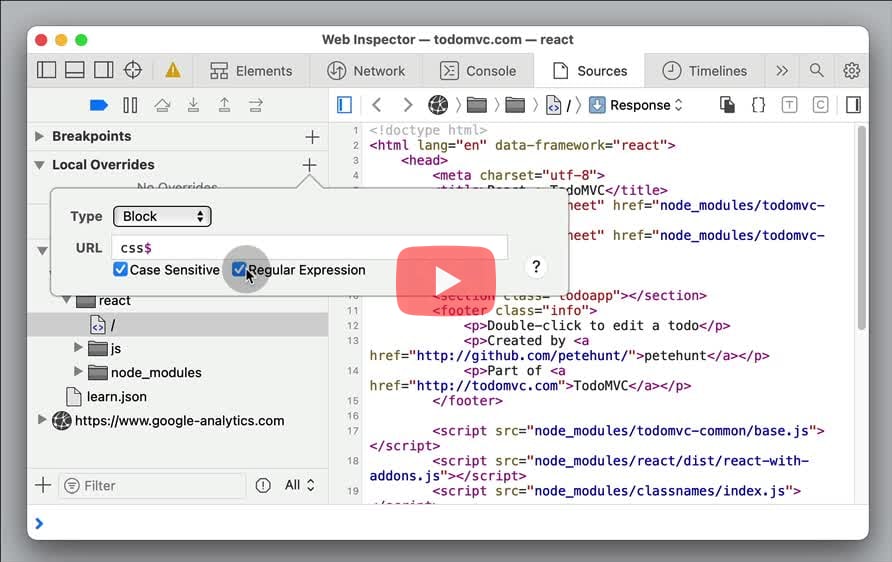
- In the Sources panel, Add a new Local Override by clicking the "+" (Create Resource) button.
- Select the Type as "Block", and enter the regex for the URL pattern to override the network request for. Reload the page to see the changes take effect.
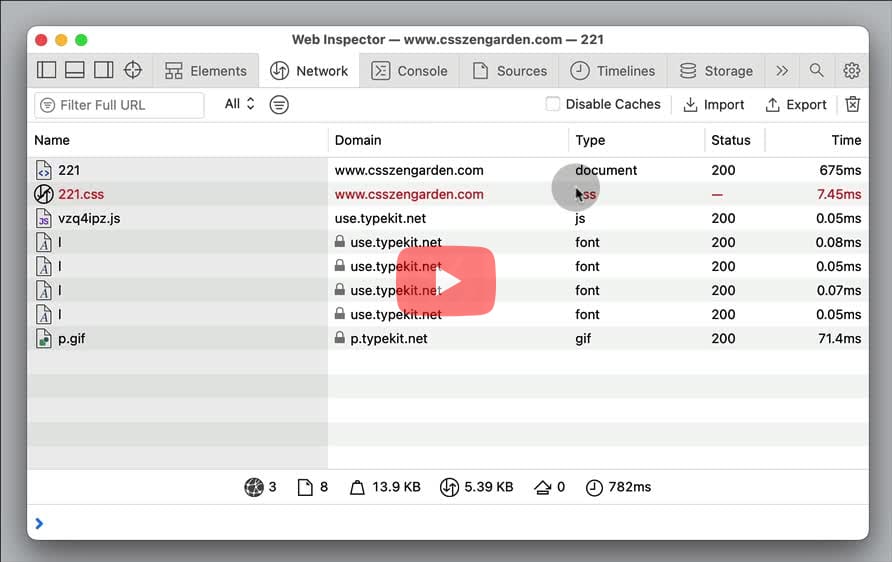
Can I block a specific network request by URL?
- In the Network tab, right click on the request and select "Block request URL". This will open the "Network request blocking" drawer that will let you manage all your blocked requests.
- In the Network tab, right click on the request and select "Block URL". This will open the "Blocking" pane in the left sidebar to manage all the blocking requests.
Edge:
- In the Network panel, right click on the request and select Block request URL. This will open the Network request blocking drawer that will let you manage all the blocked requests.
- In the Network tab, right click on the request Name, and select "Block Request URL".
- In the Sources tab, under the Local Overrides section in the left sidebar, you can manage the blocked request.
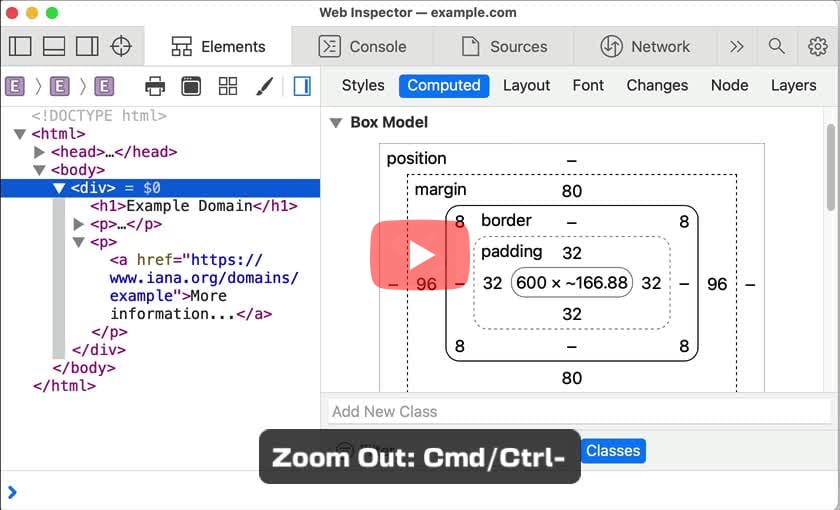
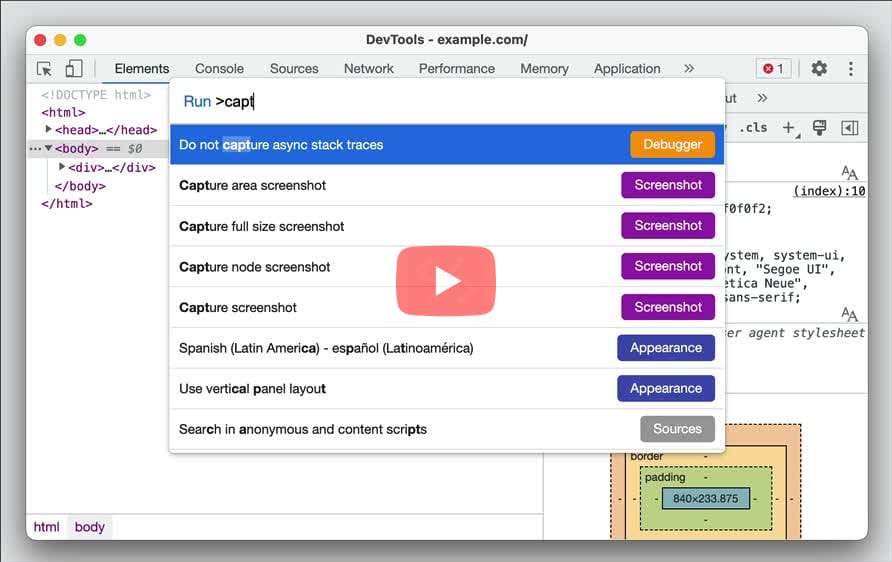
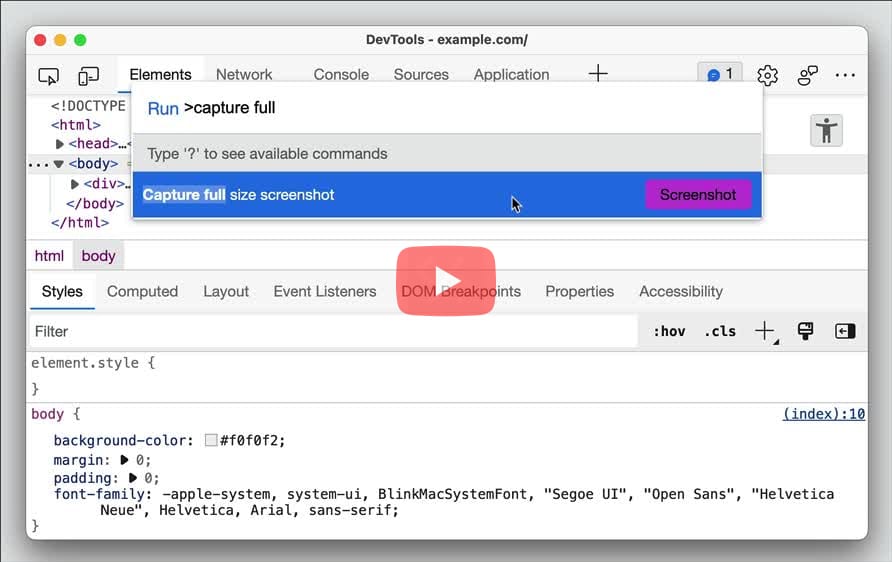
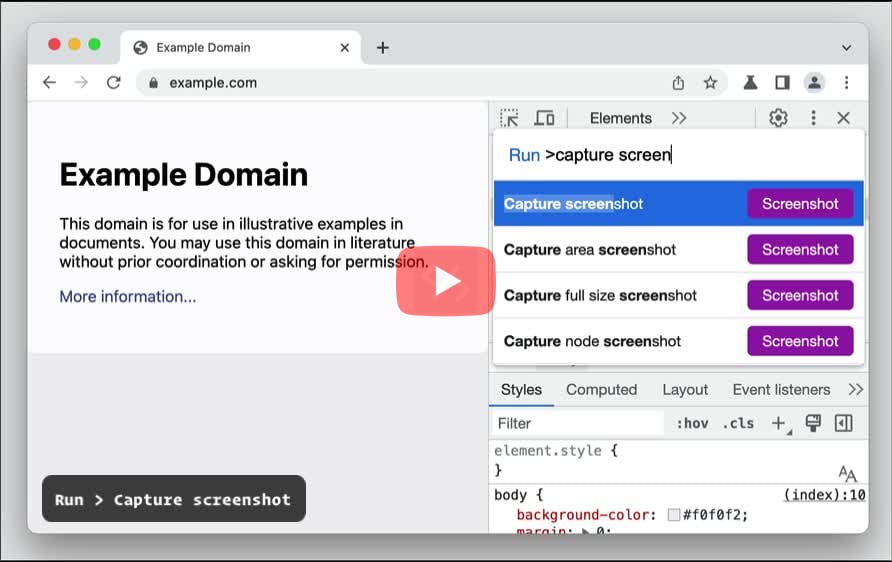
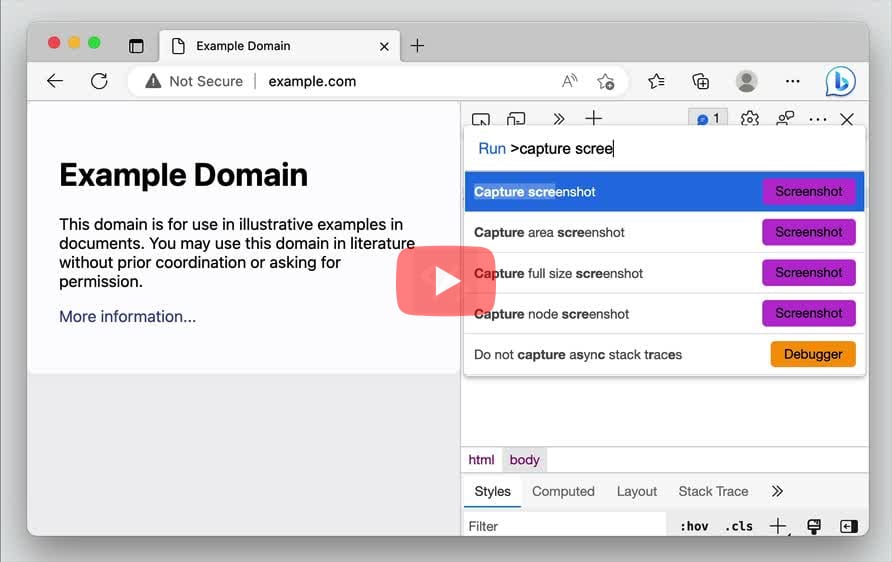
Can I take full page screenshot of a website?
- Open Command Menu (
Cmd+Shift+PorCtrl+Shift+P) & Run > "Capture full size screenshot" and pressEnter. - This will save a PNG image with url as the filename in the Downloads directory.
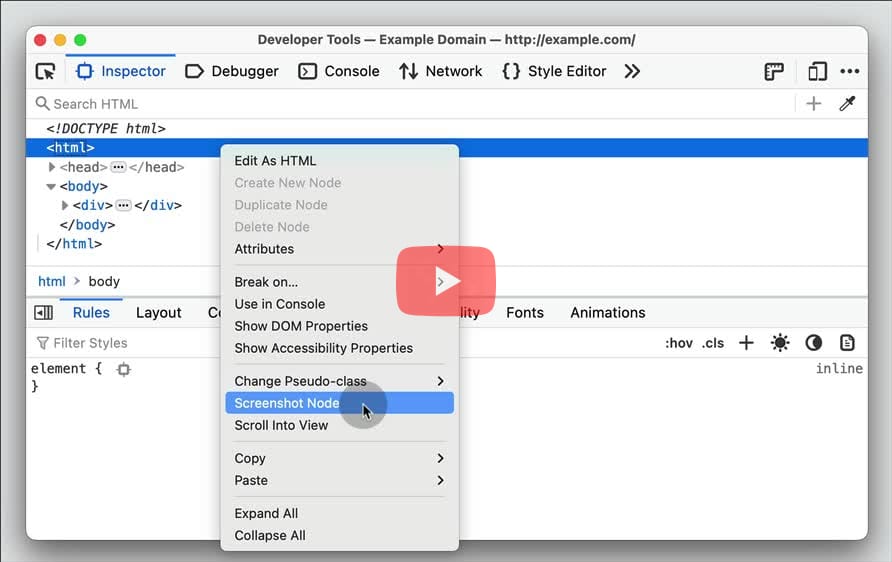
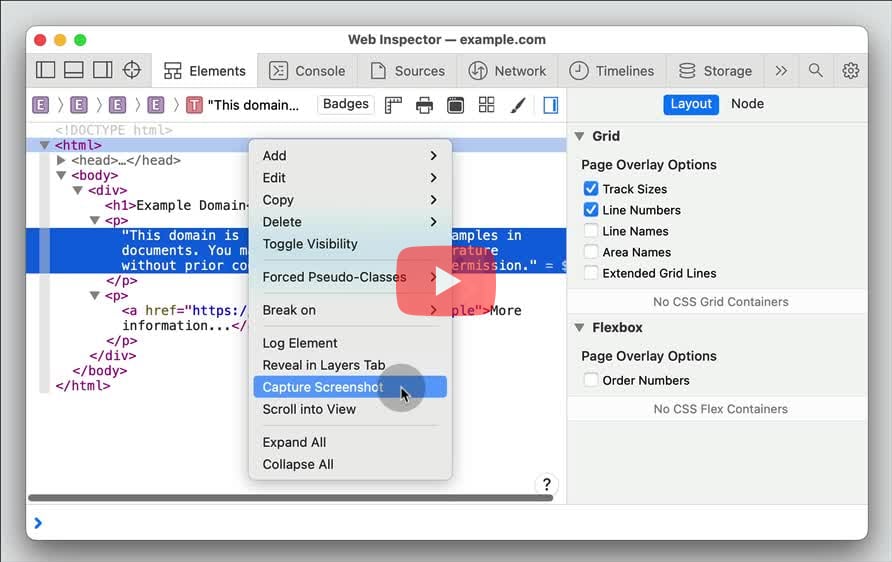
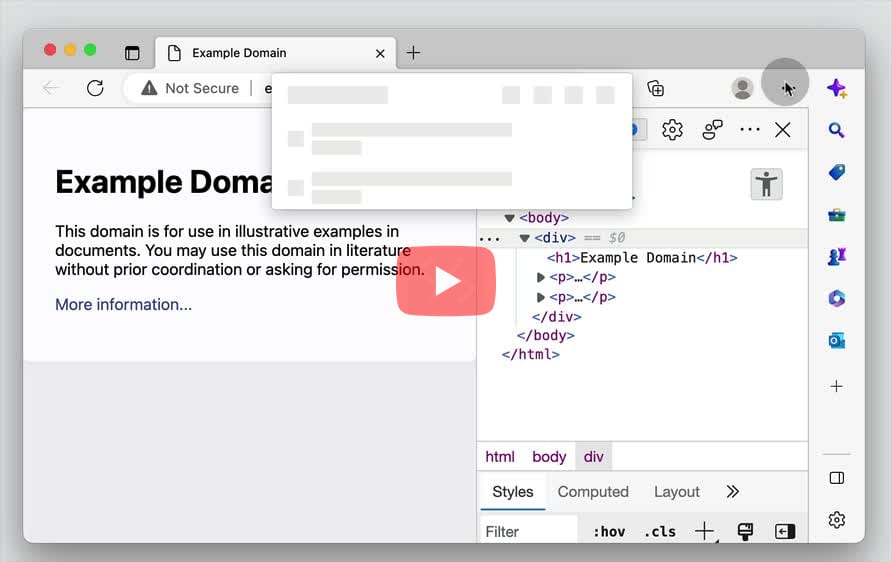
- In the Inspector panel, right click on the
htmlnode > select "Screenshot Node". - This will save a PNG image with current date time as the filename in the Downloads directory.
Edge:
- Open Command Menu (
Cmd+Shift+PorCtrl+Shift+P) & Run > "Capture full size screenshot" and pressEnter. - This will save a PNG image with url as the filename in the Downloads directory.
- In the Elements panel, right click on the
htmlnode and select "Capture Screenshot". - This will save a PNG image with current date time as the filename in the Downloads directory.
- Click the "Camera" icon above the pane you want to screenshot and select "Full page". This will open the screenshot in the screenshot editor.
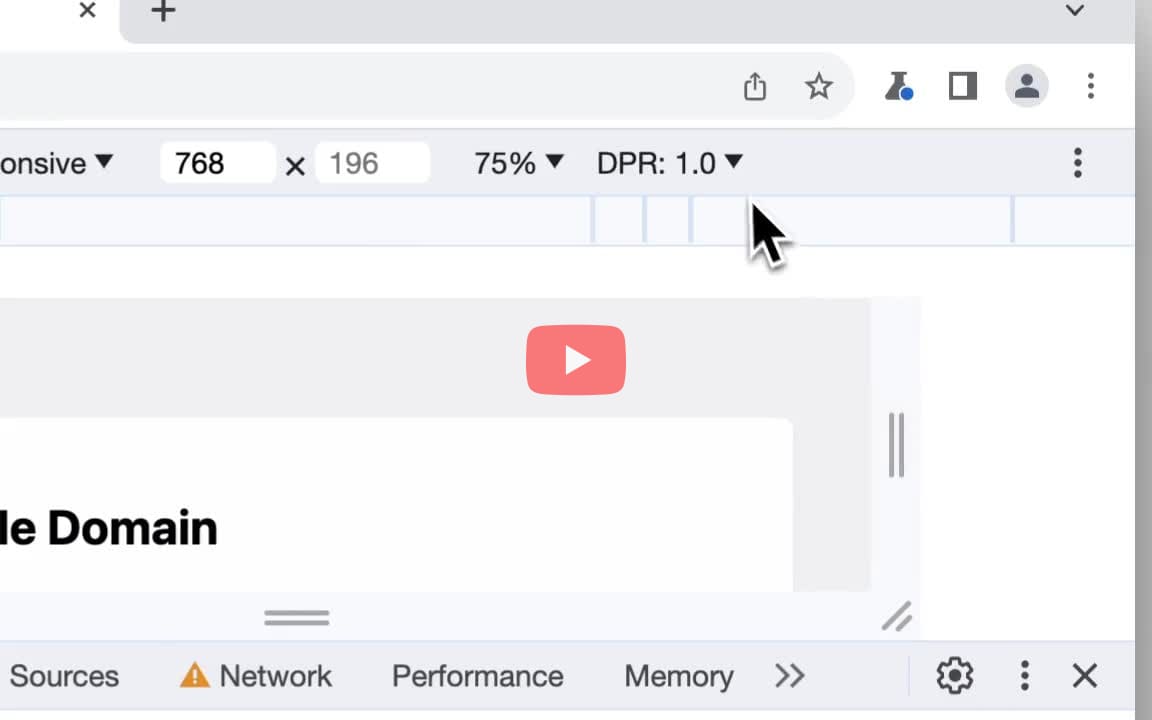
Can I capture a high definition screenshot of the page?
- In DevTools, click the Toggle device toolbar icon (
Cmd+Shift+MorCtrl+Shift+M) to enter the responsive design mode. - In the device toolbar, click More options (
⋮) > Add device pixel ratio. In the action bar at the top of the viewport, select a DPR value from the new DPR drop-down menu. - Click More options > select Capture screenshot for viewport or Capture full size screenshot for the entire page.
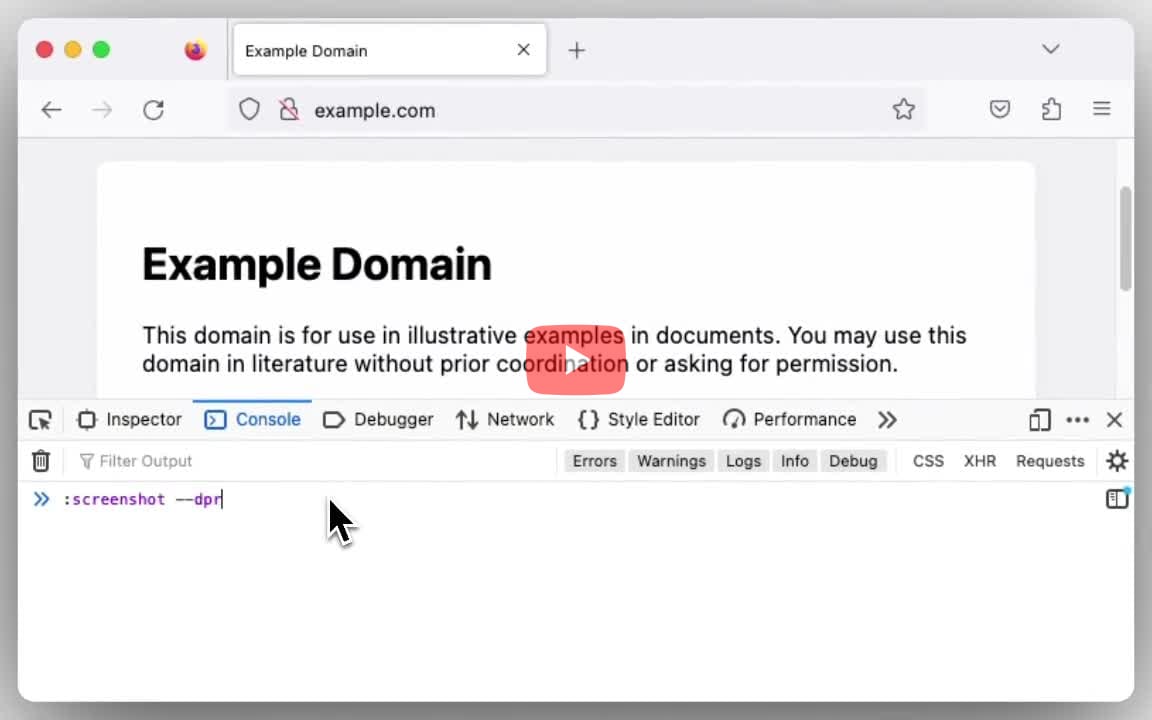
- In the Console panel, run the command
:screenshot --dpr 3to take a high definition screenshot of the page with the device pixel ratio set to 3.
Edge:
- In Devtools, click the Toggle device toolbar icon (
Cmd+Shift+MorCtrl+Shift+M) to enter the responsive design mode. - In the device toolbar, click More options (
⋮) > Add device pixel ratio. In the action bar at the top of the viewport, select a DPR value from the new DPR drop-down menu. - Click More options > select Capture screenshot for viewport or Capture full size screenshot for the entire page.
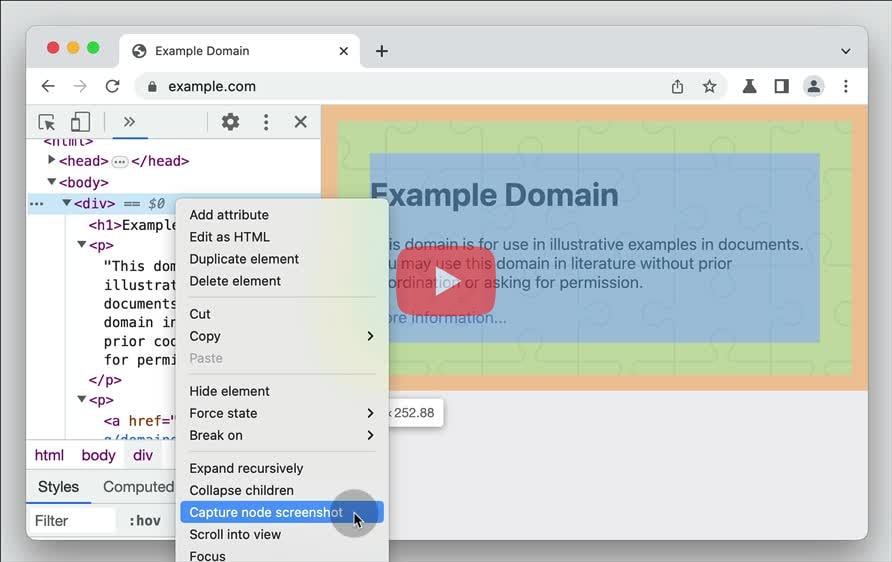
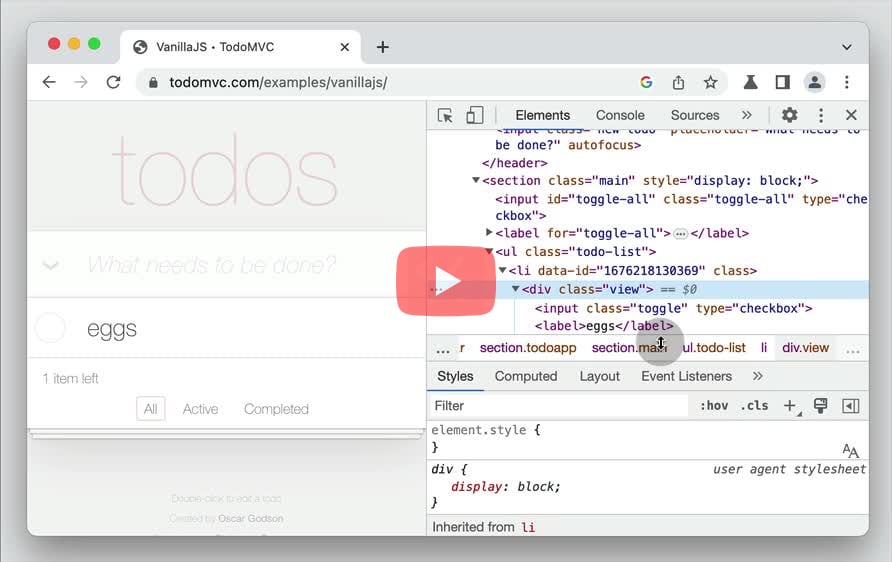
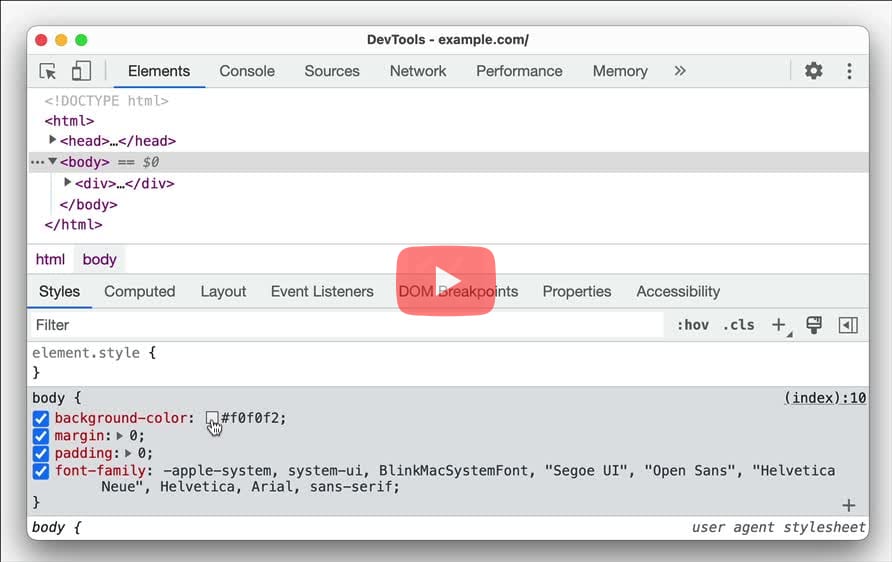
Can I take a screenshot of the DOM node?
- In the Elements panel, right click on the node and select "Capture node screenshot".
- It retains visible background colour of elements with no background colour applied.
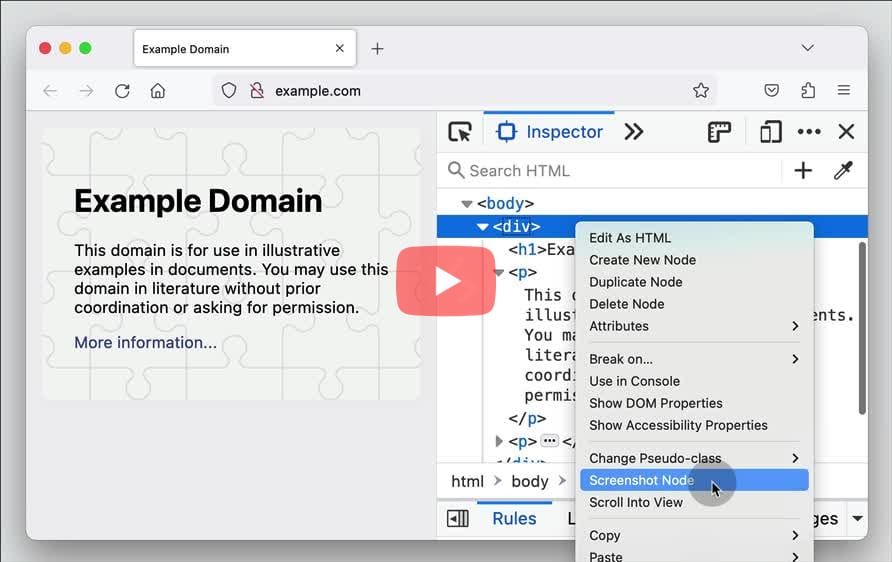
- In the Inspector panel, right click on the node, and select "Screenshot Node".
- Firefox does not retain background transparency of the element in the screenshot.
Edge:
- In the Elements panel, right click on the node and select "Capture node screenshot".
- It retains visible background colour of the elements with no background colour applied."
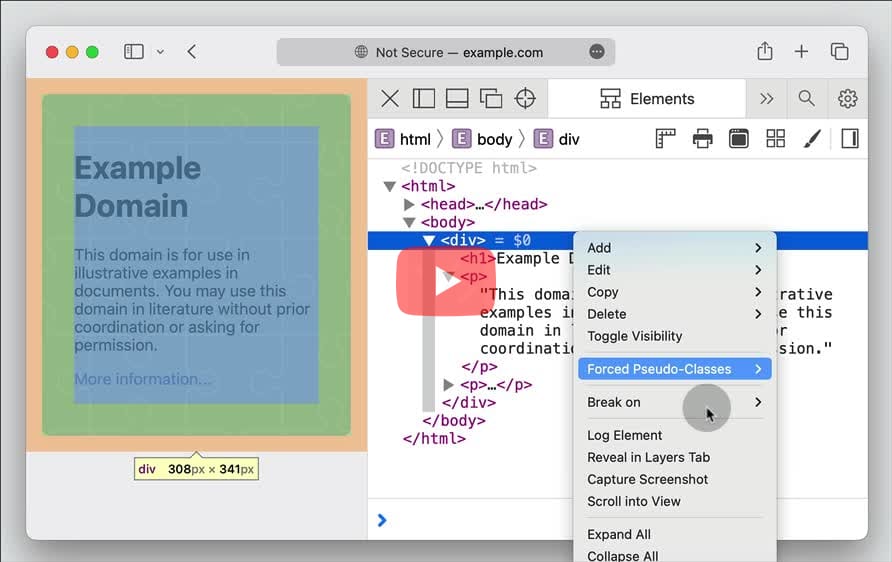
- In the Elements panel, right click on the node in the DOM tree and click on "Capture Screenshot".
- Safari preserves the transparency for the elements with no applied background colour.
- Click the "Camera" icon above the pane you want to screenshot and select "Element". 2. Click the element you want to screenshot. 3. Alternatively, click the "Camera" icon in the Element inspector to screenshot the selected DOM node.
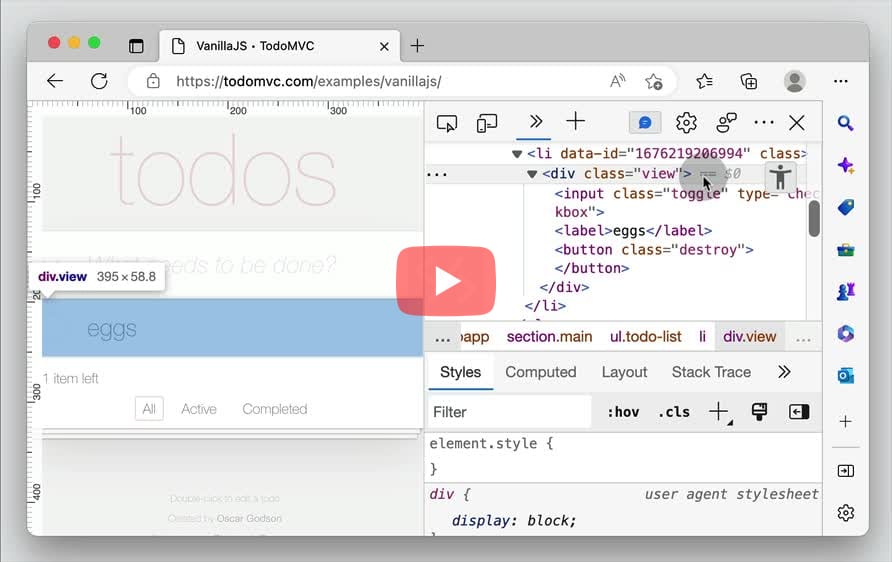
Can I capture node creation stack trace?
- Enable "Capture node creation stacks" in Settings (
F1) > Experiments. - In the Elements panel > Select the node > Open the Stack Trace pane in the side panel to show the stack trace of the node creation.
Edge:
- Enable "Capture node creation stacks" in Settings (
F1) > Experiments. - In the Elements panel > Select the node > Open the Stack Trace pane in the side panel to show the stack trace of the node creation.
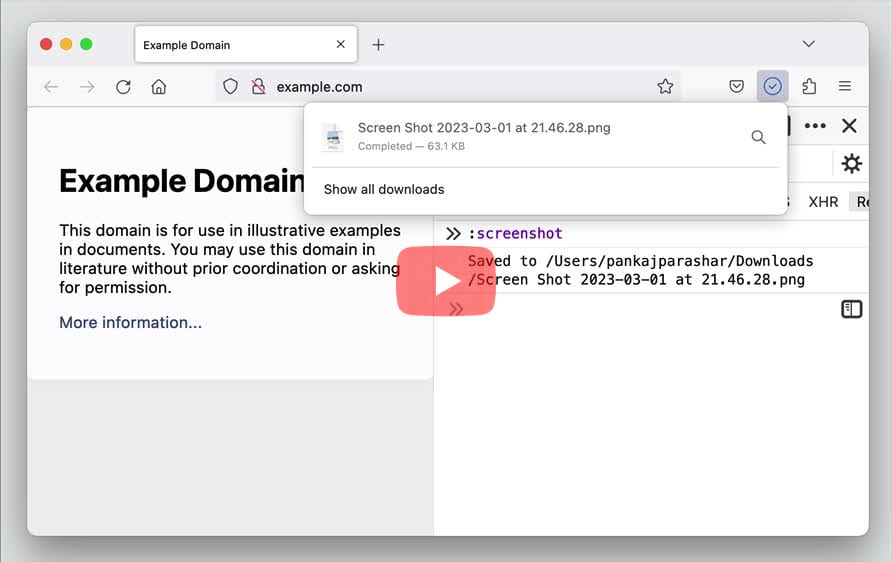
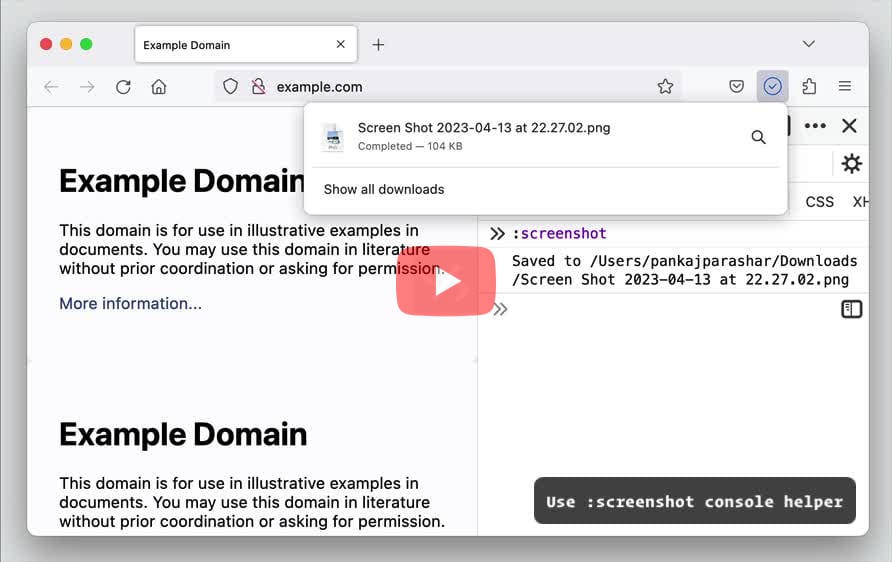
Can I take screenshot of a web page from the console?
- Firefox has a built-in helper function
:screenshotto capture screenshot of the current page from the console. - For example:
    :screenshot
    :screenshot --fullpage
    :screenshot --selector .css-selector
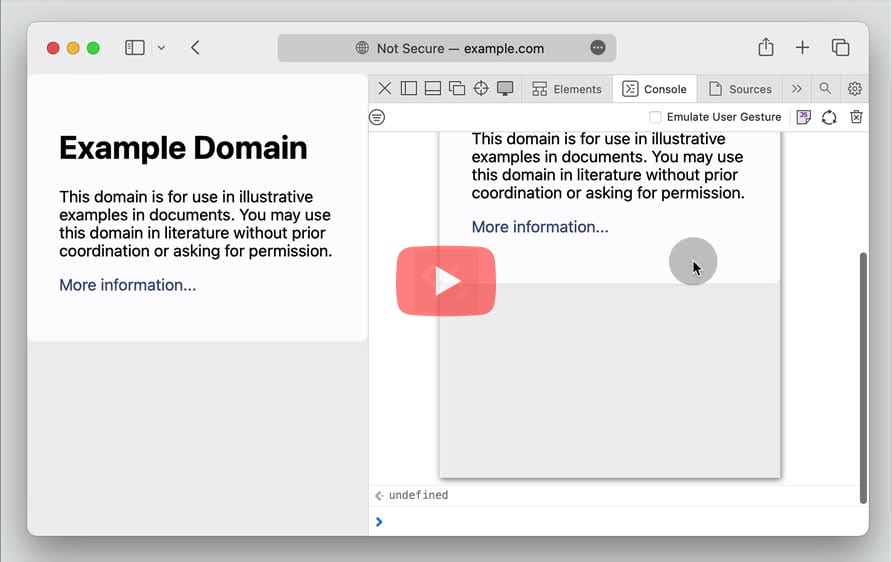
- In Safari, you can capture screenshot of the viewport from the Console using
console.screenshot(). - Alternatively, pass the target node to the function to capture screenshot of a specific node.

Can I take a screenshot of the viewport?
- Open Command menu (
Cmd+Shift+PorCtrl+Shift+P) > Run "Capture screenshot" > PressEnter. By default, the screenshot will be saved in theDownloadsdirectory.
- In Console, use the built-in helper function
:screenshotto capture screenshot of the current page.
Edge:
- Open Command menu (
Cmd+Shift+PorCtrl+Shift+P) > Run "Capture screenshot" > PressEnter. By default, the screenshot will be saved in theDownloadsdirectory.
- In Console, use
console.screenshot()to capture the screenshot of the viewport.
- Click the "Camera" icon above the pane you want to screenshot and select "Viewport". This will open the screenshot in the screenshot editor.
Can I change authored color format to other formats like hsl, hwb etc?
- In the Styles pane, hold the
Shiftkey and click on the color preview box to cycle through the various color formats likehex,rgb,hsl, andhwb. - Alternatively, you can change the color format in the color picker using the up-down arrow keys.
- In the Rules pane, hold the
Shiftkey and click on any color preview to change the color format. - It is also available as an optional default.
Edge:
- In the Styles pane, hold the
Shiftkey and click on the color preview box to cycle through the various color formats likergb,hsl, andhwb. - Alternatively, you can change the color format in the color picker using the up-down arrow keys.
- In the Styles pane, hold the
Shiftkey and click on the color preview box to cycle through the various color formats likehex,rgb, andcolors.
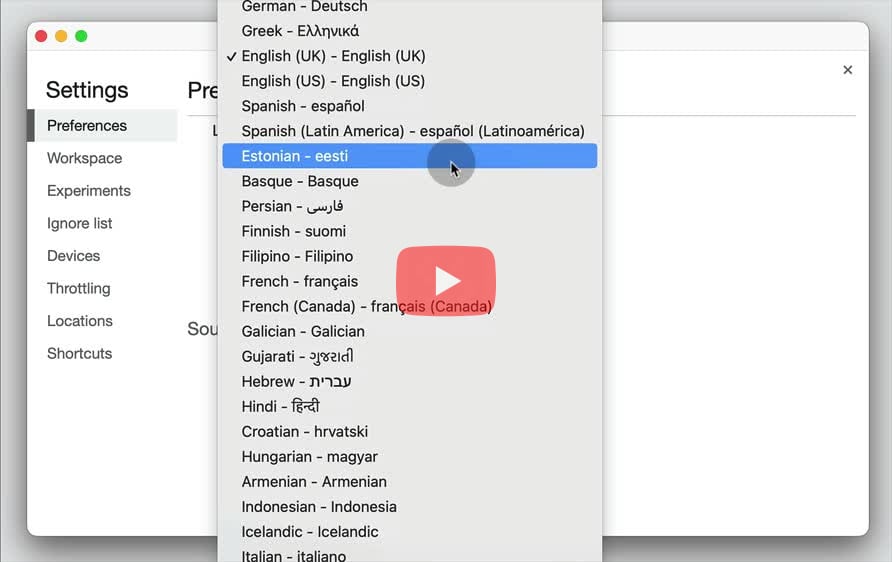
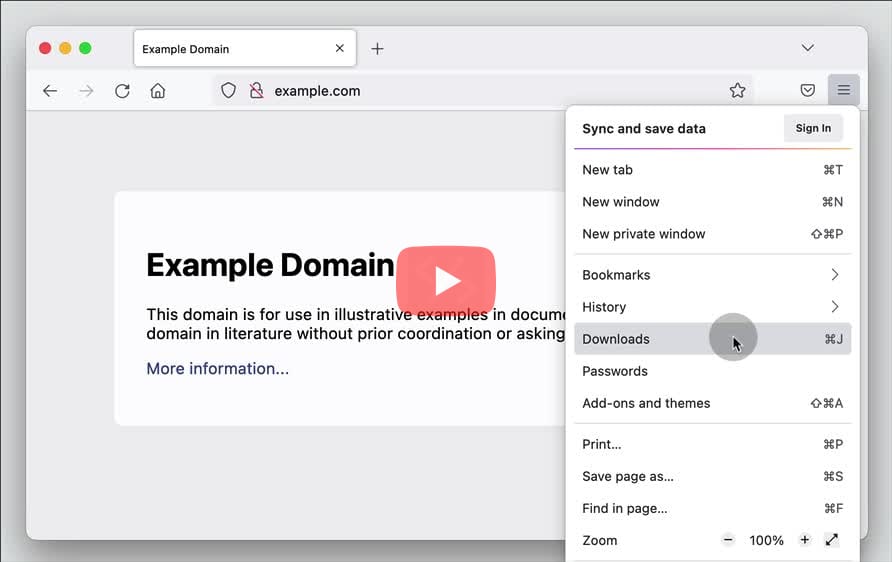
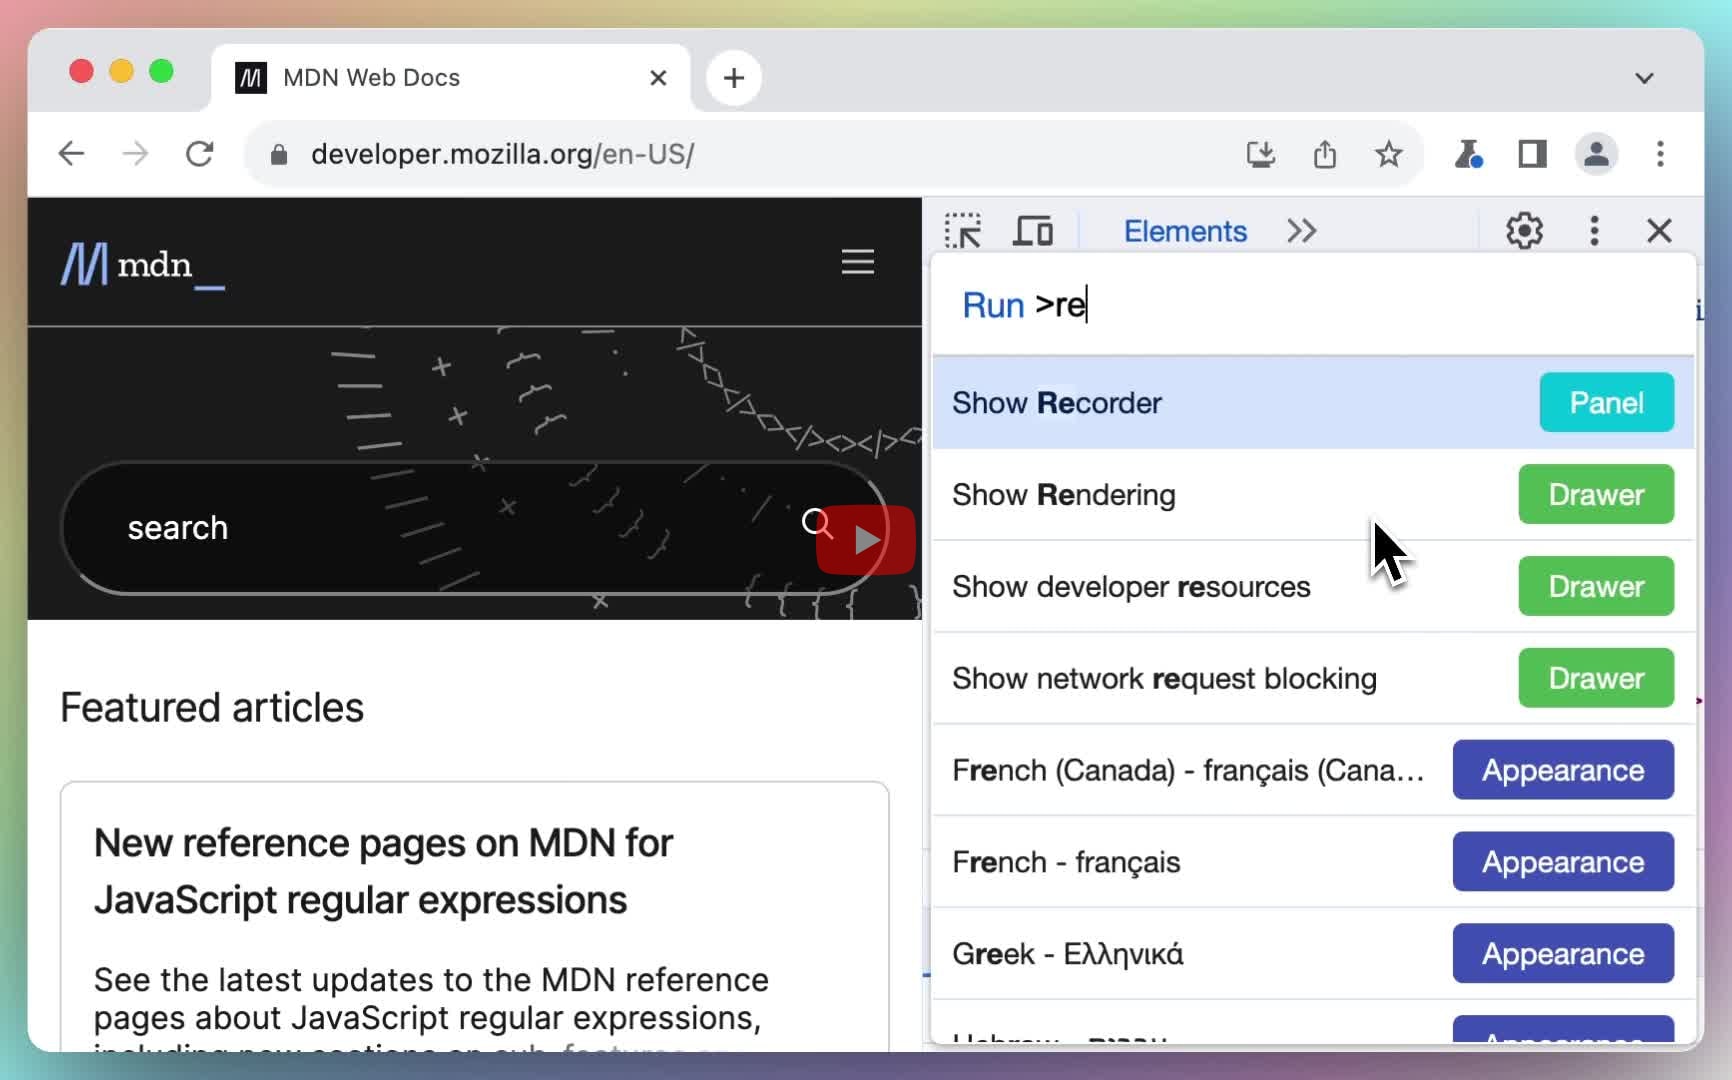
Can I change the language of developer tools?
- Open Settings (
F1orShift+?) > Preferences > Under Languages, select the language from the dropdown > Reload DevTools. - Alternatively, Run Command (
Cmd+Shift+PorCtrl+Shift+P) > Input the language > select the language labelled "Appearance" > Reload DevTools.
Edge:
- Open Settings (
F1orShift+?) > Preferences > Under Languages, select the language from the dropdown > Reload DevTools. - Alternatively, Run Command (
Cmd+Shift+PorCtrl+Shift+P) > Input the language > select the language labelled "Appearance" > Reload DevTools.
Can I clear the command history of the console?
Chrome: In the Console tab, right click anywhere > select "Clear console history" to remove all the commands from its history.
Edge: In the Console tab, right click anywhere > select "Clear console history" to remove all the commands from its history.
Can I clear the previous commands in the console?
- Click the Clear console icon (top-left) or use the keyboard shortcut,
Ctrl+LorCmd+K. - Alternatively, you can run
console.clear()in the console to clear the previous commands.
- Click the Clear the Web Console output icon in the toolbar or use
Ctrl+LorCmd+Kto clear the console. - Alternatively, you can run
console.clear()in the console to clear the previous commands.
Edge:
- Click the Clear console icon (top-left) or use the keyboard shortcut,
Ctrl+LorCmd+K. - Alternatively, you can run
console.clear()in the console to clear the previous commands.
- Click the Clear log button (trash icon) or use
Cmd+KorShift+Lto clear the console. - Alternatively, you can run
console.clear()in the console to clear the previous commands.
- Click the Clear console icon (top-left) or use the keyboard shortcut,
Ctrl+LorCmd+K. - Alternatively, you can run
console.clear()in the console to clear the previous commands.
Can I clear all the requests in the network log?
- In the Network panel, click the Clear network log button in the toolbar or press
Cmd+KorCtrl+Lto clear all the network requests.
- In the Network panel, click the Clear button (trash icon) to clear all the network requests.
Edge:
- In the Network panel, click the Clear network log button in the toolbar or press
Cmd+KorCtrl+Lto clear all the network requests.
- In the Network panel, click the Clear Network Items button or press
Cmd+Kto clear all the network requests.
Can I copy a network request as cURL?
Chrome: In the Network tab, right click on the request, Copy > Copy as cURL will copy the request with cURL command to the clipboard.
- In the Network tab, right click on the request, Copy > Copy as cURL will copy the request with cURL command to the clipboard.
Edge: In the Network tab, right click on the request, Copy > Copy as cURL will copy the request with cURL command to the clipboard.
Safari: In the Network tab, right click on the request, "Copy as cURL" will copy the request with cURL command to the clipboard.
Can I copy the request as window.fetch()?
- In the Network panel, right click on the network request > Copy > Copy as fetch.
Can I copy the request as a powershell script?
- In the Network panel, right click on the network request > Copy > Copy as PowerShell.
Can I copy a node's path as a CSS selector?
- In the Elements tab, right click on the element in the DOM tree > Copy > Copy selector.
- In the Inspector tab, right click on the element in the DOM tree > Copy > CSS Selector.
Edge:
- In the Elements tab, right click on the element in the DOM tree > Copy > Copy selector.
Safari: In the Elements tab, right click on the element in the DOM tree > Copy > Selector Path.
- In the Elements tab, right click on the element in the DOM tree > Copy > Copy selector.
Can I copy an image as a data URI?
- In the Network panel, click the image request to open a side panel containing the request details.
- Open the Preview tab to preview the image and right click on the image > Copy image as data URI
Edge:
- In the Network panel, click the image request to open a side panel containing the request details.
- Open the Preview tab to preview the image and right click on the image > Copy image as data URI
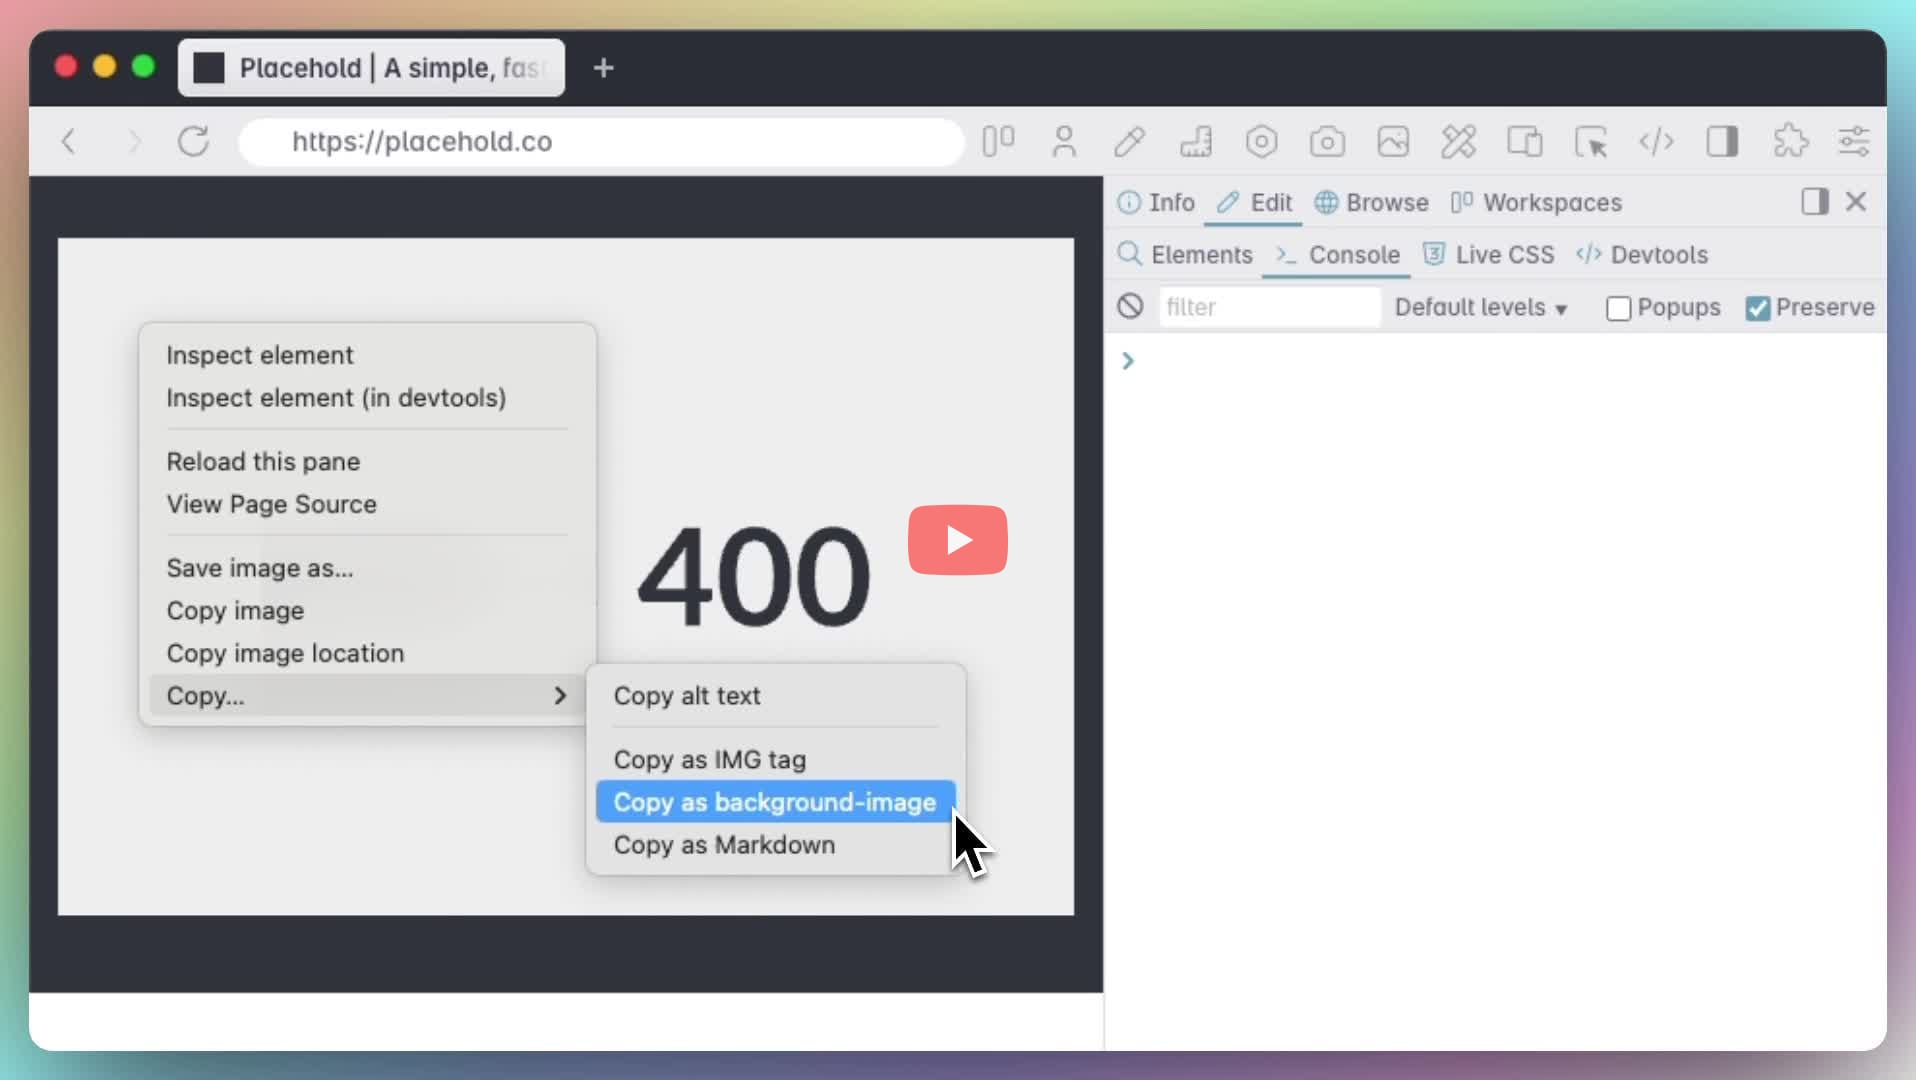
Can I copy the image url as a background-image property to directly use in CSS?
- Right-click on the image, select Copy > Copy as background-image.
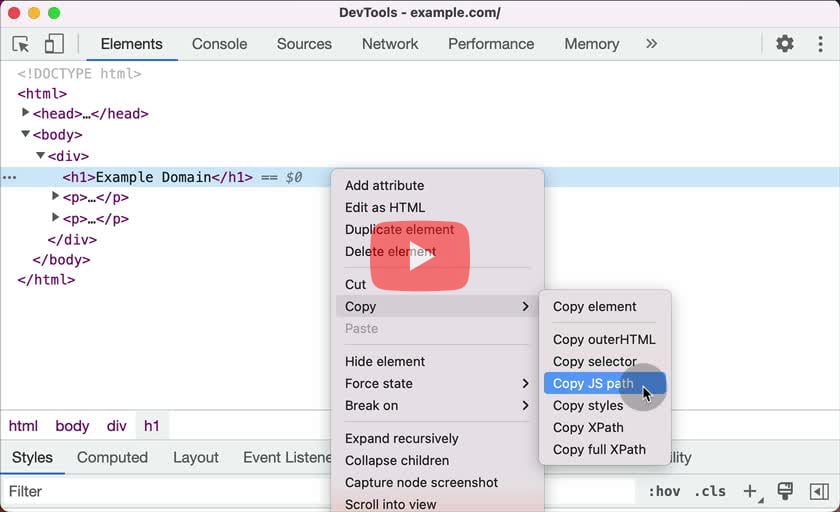
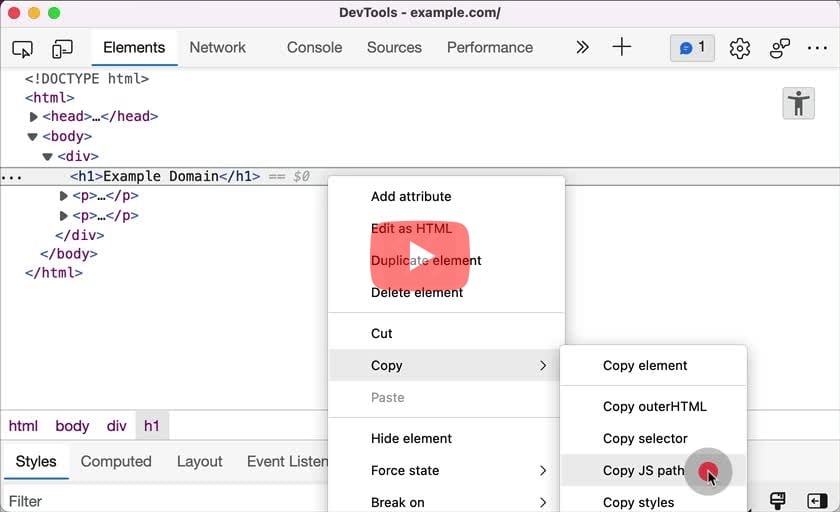
Can I copy a node's path to be used as a JavaScript expression?
- In the Elements tab, right click on the node in the DOM tree > Copy > Copy JS path. This will copy the query selector to the node that can be used in the JS code.
Edge:
- In the Elements tab, right click on the node in the DOM tree > Copy > Copy JS path. This will copy the query selector to the node that can be used in the JS code.
Can I copy a node as HTML?
- In the Elements panel, right click on the node > Copy > Copy outerHTML.
Can I copy the styles applied to an element?
- In the Elements panel, right click on the node > Copy > Copy styles.
- In the Elements panel, go to the "Computed" tab and click the "Copy styles" button.
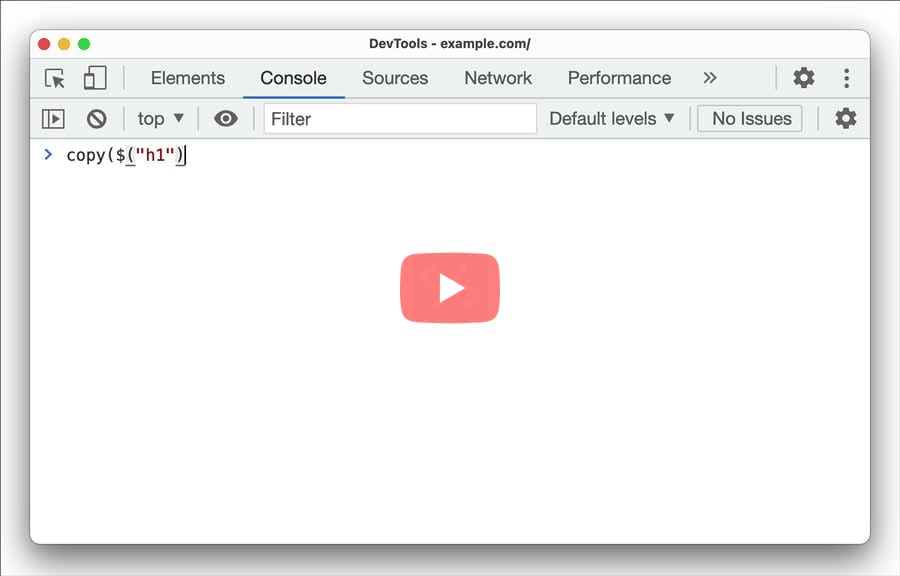
Can I copy an object from console?
copy(object)copies a string representation of the specified object to the clipboard.
copy(object)copies a string representation of the specified object to the clipboard.
Edge:
copy(object)copies a string representation of the specified object to the clipboard.
copy(object)copies a string representation of the specified object to the clipboard.
Can I copy the response object as text?
- In the Network panel, right click on the network request > Copy > Copy response.
Can I copy style declarations as JavaScript object?
- Inspect element > In the Styles pane, right click on the style declaration and select "Copy declaration as JS" or "Copy all declarations as JS" to copy one or all styles.
Edge:
- Inspect element > In the Styles pane, right click on the style declaration and select "Copy declaration as JS" or "Copy all declarations as JS" to copy one or all styles.
Can I temporarily deactivate breakpoints while debugging source code?
- In the Sources panel, open the Breakpoints pane, click the Deactivate breakpoints (
Cmd+F8orCtrl+F8) icon to prevent the execution from pausing at breakpoints.
Edge:
- In the Sources panel, open the Breakpoints pane, click the Deactivate breakpoints (
Cmd+F8orCtrl+F8) icon to prevent the execution from pausing at breakpoints.
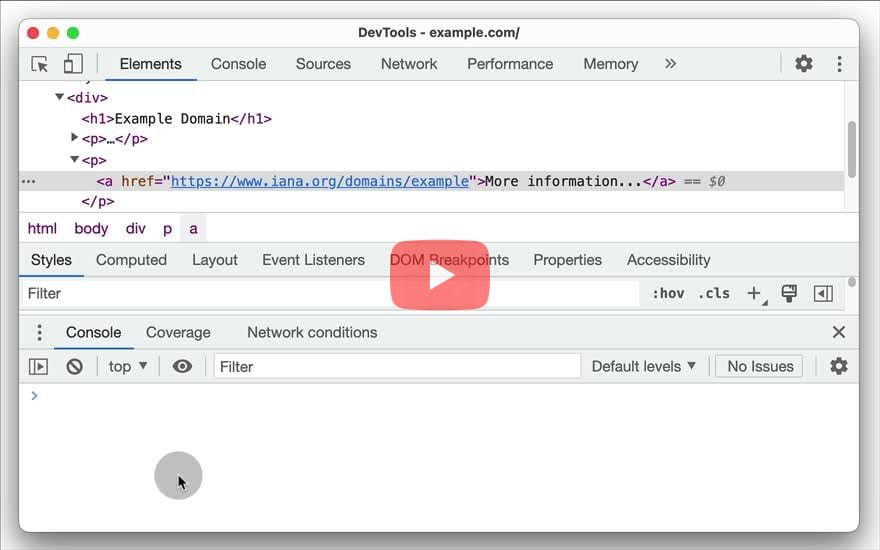
Can I set breakpoint and debug attr changes of a node?
- Inspect element > Right click on the node in the DOM tree.
- Select "Break on" > "attribute modifications". Reload the page.
- Inspect element > Right click on the node in the DOM tree.
- Select "Break on..." > "Attribute Modification". Reload the page.
Edge:
- Inspect element > Right click on the node in the DOM tree > Select "Break on" > Select "attribute modifications".
- Reload the page.
- Inspect element > Right click on the DOM node > Select "Break on" > Select "Attribute Modified".
- Reload the page.
Can I debug event listeners by setting a breakpoint on all or specific events?
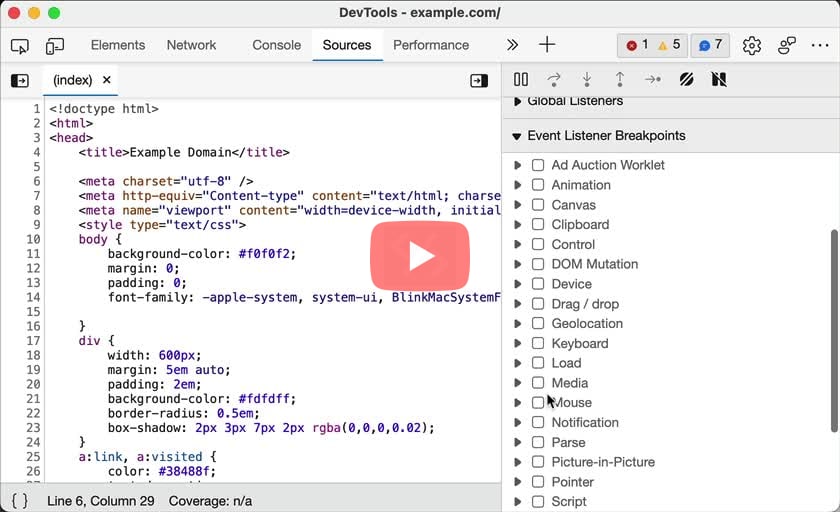
- In the Sources tab, expand the Event Listeners Breakpoints section to see the list of event categories.
- Expand a category and enable the checkbox for the event that needs to be debugged.
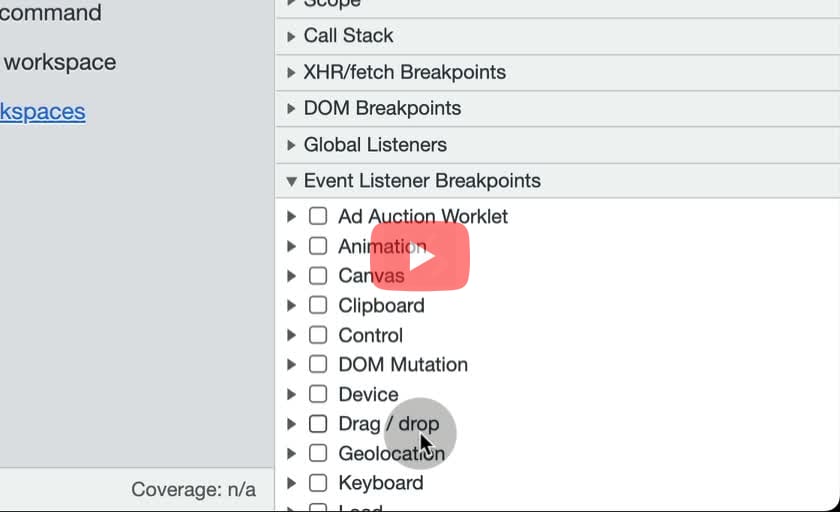
- Open devtools > Debugger > Find and expand the Event Listener Breakpoints section in the right hand column.
- To break when event listeners are hit, check the boxes next the events you are interested in. All of the standard events supported in your version of Firefox are listed, arranged by which API or API area they’re part of.
Edge:
- In the Sources tab, expand the Event Listeners Breakpoints section to see the list of event categories.
- Expand a category and enable the checkbox for the event that needs to be debugged.
- In the Sources tab, click the "+" button from the left sidebar in the Breakpoints section > Select "Events Breakpoint".
- Enter the name of the event in the popup form to apply a breakpoint for a specific event.
- Alternatively, you can set breakpoint on all the events by selecting "All Events" after clicking the "+" button.
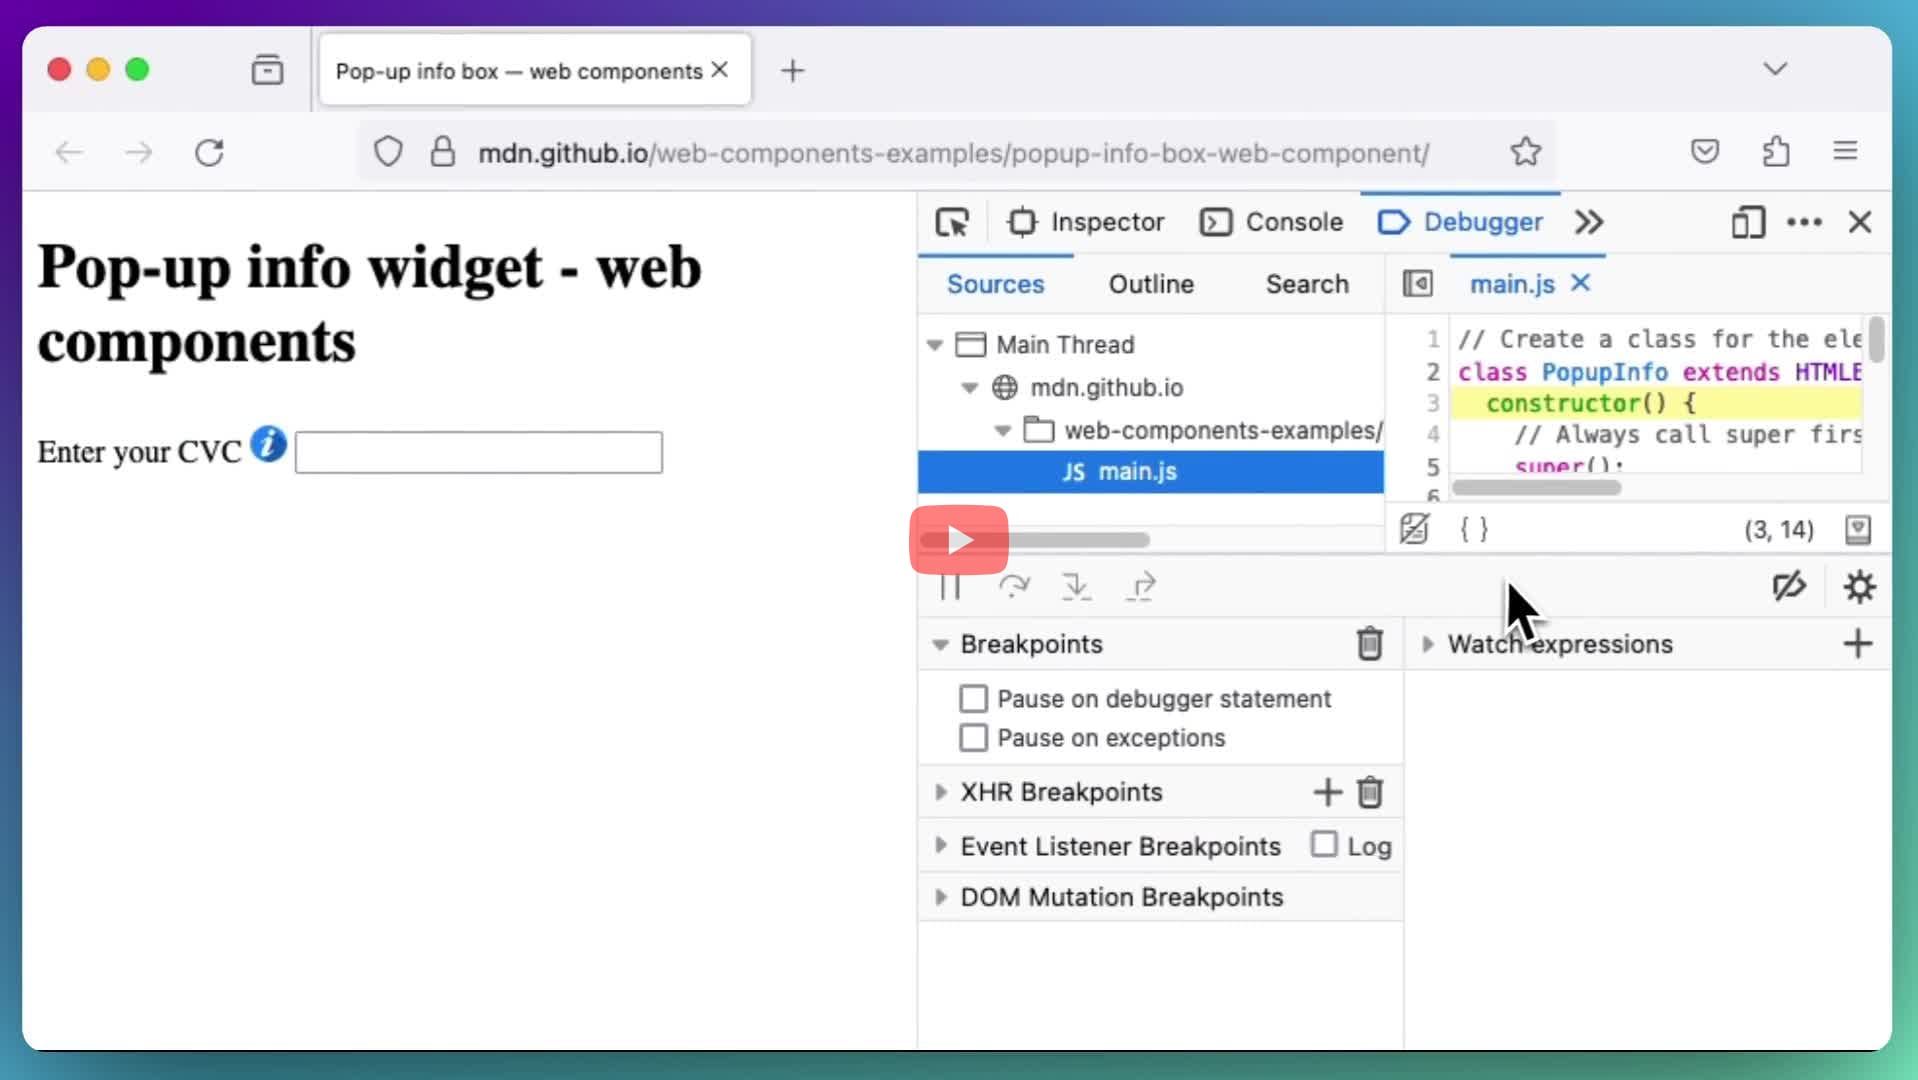
Can I debug JavaScript using devtools?
- In the Sources tab, open the
.jsfile from the Page panel in the left sidebar. Set a breakpoint by clicking on the line number. - Perform the action necessary to trigger that line of code, which will pause the execution at the breakpoint.
- Use the toolbar on the right sidebar to step-in/step-out, watch expressions, local vars while debugging through the code.
- Alternatively, you can also add the
debugger;statement in the code to pause execution of the code at that line.
- In the Debugger tab, open the
.jsfile from the Sources panel in the left sidebar. Set a breakpoint by clicking on the line number. - Perform the action necessary to trigger that line of code, which will pause the execution at the breakpoint.
- Use the toolbar on the right sidebar to step-in/step-out, watch expressions, local vars while debugging through the code.
- Alternatively, you can also add the
debugger;statement in the code to pause execution of the code at that line.
Edge:
- In the Sources tab, open the
.jsfile from the Page panel in the left sidebar. Set a breakpoint by clicking on the line number. - Perform the action necessary to trigger that line of code, which will pause the execution at the breakpoint.
- Use the toolbar on the right sidebar to step-in/step-out, watch expressions, local vars while debugging through the code.
- Alternatively, you can also add the
debugger;statement in the code to pause execution of the code at that line.
- In the Sources tab, open the
.jsfile from the the left sidebar. Set a breakpoint by clicking on the line number. - Perform the action necessary to trigger that line of code, which will pause the execution at the breakpoint.
- Once activated, use the toolbar on the left sidebar (top) to step-in/step-out, watch expressions, local vars while debugging through the code.
- Alternatively, you can also add the
debugger;statement in the code to pause execution of the code at that line.
Can I debug by setting a breakpoint when the node is removed from the DOM?
- Inspect element > Right click on the node in the DOM tree.
- Select "Break on" > "node removal". Reload the page.
Can I debug websites on remote devices?
- In the Menu bar, select Develop > Select the device > Select the page to open the Web Inspector for that URL.
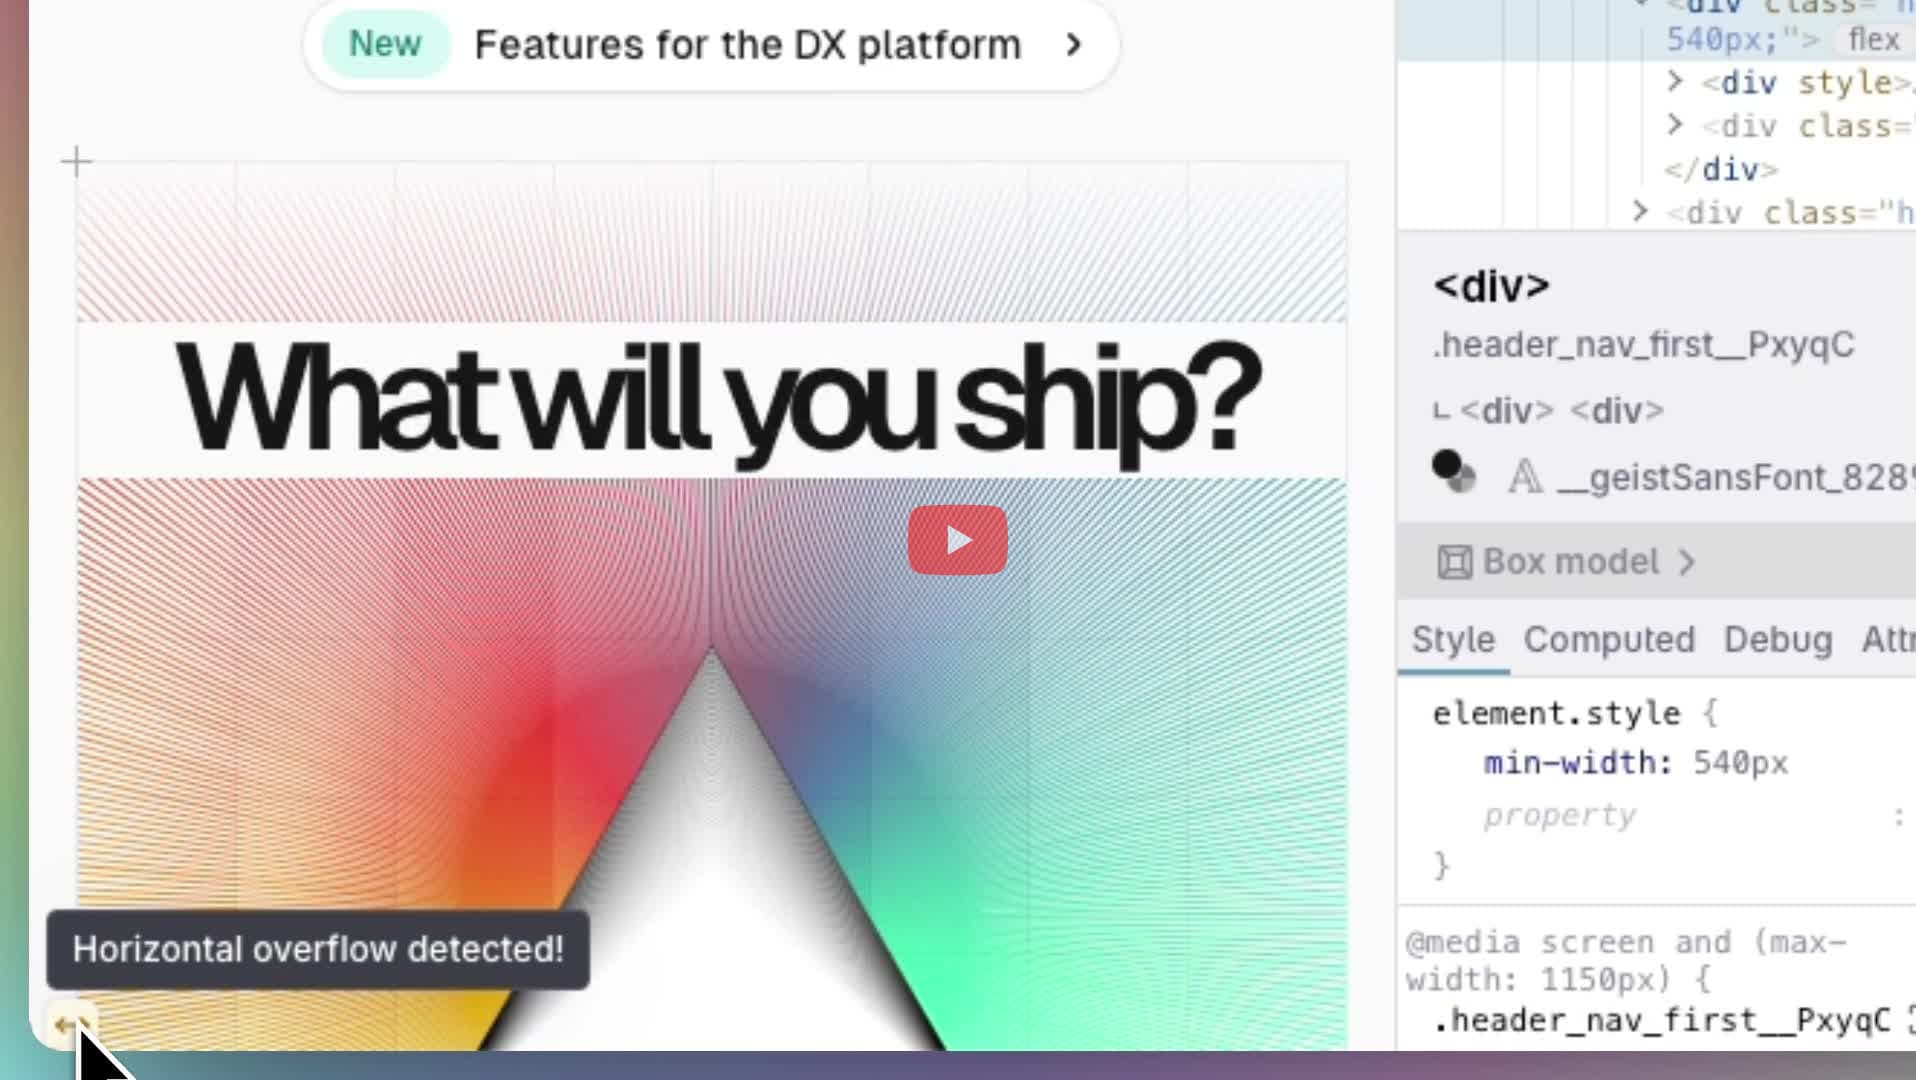
Can I debug container with scrollbars to identify the element causing it?
- In the Inspector panel, elements with scrollbars are decorated with the
scrollbadge. Click on the badge to jump to the element that caused the overflow.
- Use
Cmd+DorCtrl+Dto turn on layout debugging. Elements causing a scrollbar are highlighted in red. There is also a Horizontal overflow detector icon in the bottom left of the page to quickly spot the element causing the scroll overflow.
Can I debug speculation rules for prefetch/prerender next page navigations?
- In the Network panel, prefetched resources have the Type as
prefetchand the Request Headers will contain the headerSec-Purpose: prefetchwhich is used to identify such requests on the server-side. - In the Application panel, under the Preloading section, which has three panes: (1) Speculation Rules: list the rulesets on the page. (2) Preloads: list the prefetched & prerendered URLs from the rulesets. (3) This Page: lists the prerendered status of the current page.
Can I debug by setting a breakpoint when the subtree of the node changes?
- Inspect element > Right click on the node in the DOM tree.
- Select "Break on" > "subtree modifications". Reload the page.
Can I debug XHR or fetch calls by setting a breakpoint for a specific or all requests??
- Click the Sources tab.
- Expand the XHR Breakpoints pane.
- Click Add breakpoint.
- Enter the string which you want to break on. DevTools pauses when this string is present anywhere in an XHR's request URL.
- Press Enter to confirm.
- Open devtools > Debugger.
- In the right section, under "XHR Breakpoints", either use the checkbox to "Pause on any URL" or "Break when the URL contains" a specific keyword
Edge:
- Click the Sources tab.
- Expand the XHR Breakpoints pane.
- Click Add breakpoint.
- Enter the string which you want to break on. DevTools pauses when this string is present anywhere in an XHR's request URL.
- Press Enter to confirm.
- In the Sources tab, click the "+" button in the left sidebar within the Breakpoints section > Select "URL Breakpoint..."
- Use the popup form to apply breakpoint on specific keywords and matching conditions.
- Alternatively, you can set breakpoint on all the requests by selecting "All Requests" after clicking the "+" button.
Can I delete a node from the DOM tree?
- In the Elements panel, right click on the node and select "Delete element".
Can I detect if a website uses third-party cookies?
- In the Application panel, under the Storage section, expand Cookies. All the entries with third-party domains are the ones using cookies.
Edge:
- In the Application panel, under the Storage section, expand Cookies. All the entries with third-party domains are the ones using cookies.
Can I detect memory leaks in my web app using devtools?
- Open devtools using
Cmd+Opt+I(on Mac) orCtrl+Shift+I(on Windows/Linux) > Memory. - Check memory usage > Memory going only ⬆️ is a bad sign! > Capture snapshot to preview memory allocation > Find redundant objects > Navigate to where you allocated them.
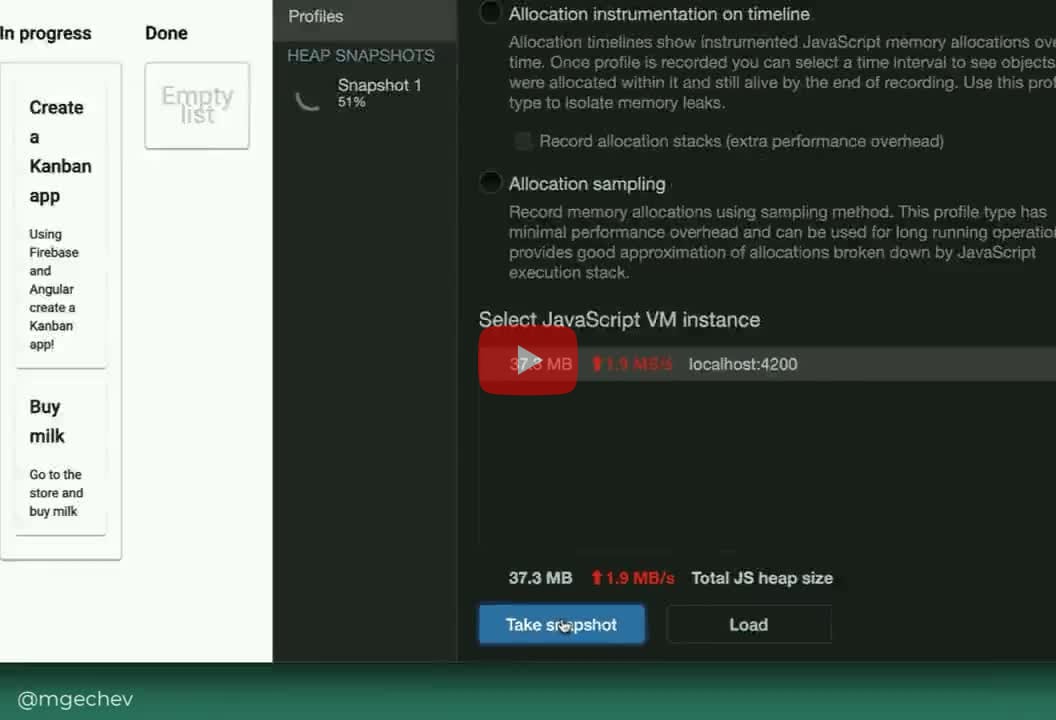
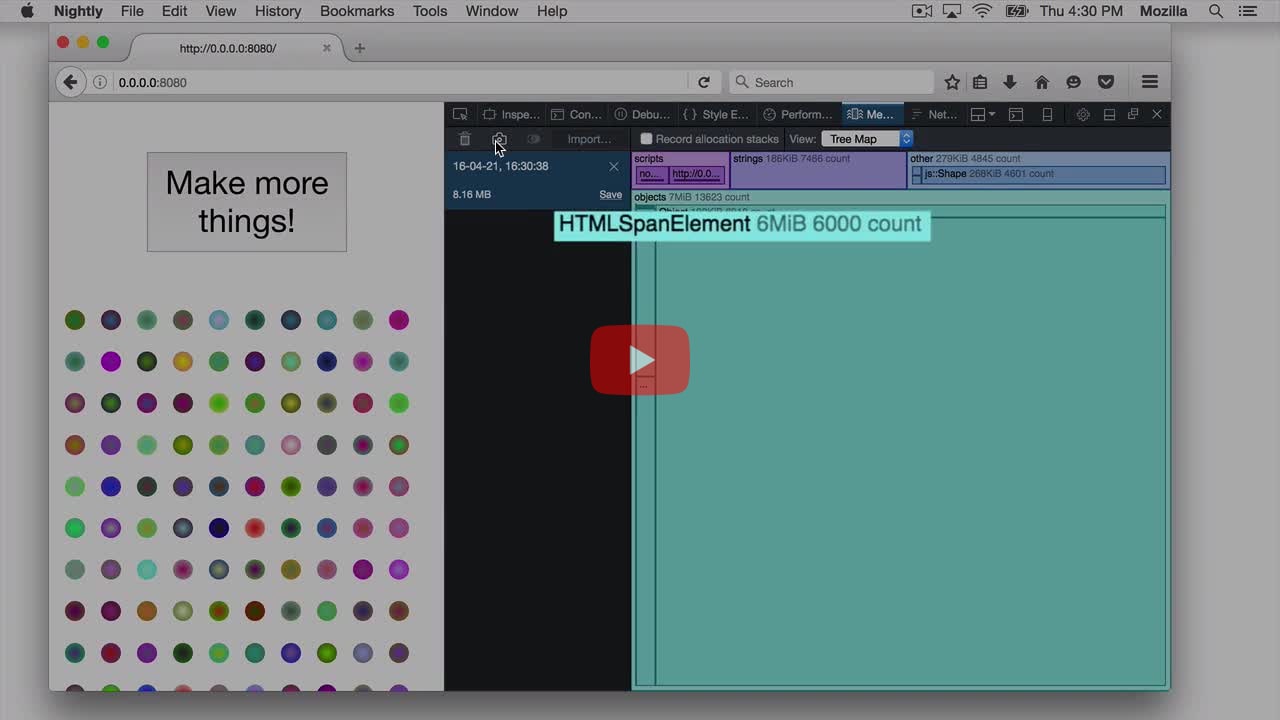
- In the Memory tab, use the camera icon (top-left) titled, "Take snapshot" to capture the heap stack and establish a baseline.
- Perform any operation on the app that is suspected to leak memory, and then take another snapshot.
- To compare two snapshots, click the button that looks like a Venn diagram next to the camera icon. The diff shows you where memory was allocated or freed between the two snapshots, indicating potential candidates leaking the memory.
Edge:
- Open devtools using
Cmd+Opt+I(on Mac) orCtrl+Shift+I(on Windows/Linux) > Memory. - Check memory usage > Memory going only ⬆️ is a bad sign! > Capture snapshot to preview memory allocation > Find redundant objects > Navigate to where you allocated them.
- Open the Timelines tab. In the Events view, enable "JavaScript Allocations" panel in the left sidebar, by clicking the Edit button.
- Reload the page to start recording the timeline. Perform actions that are expected to be memory neutral.
- Take snapshot using the Camera icon after each repetition. Use the Compare button to compare the snapshots for any visible memory spikes.
Can I detect the meta tags missing from the HTML?
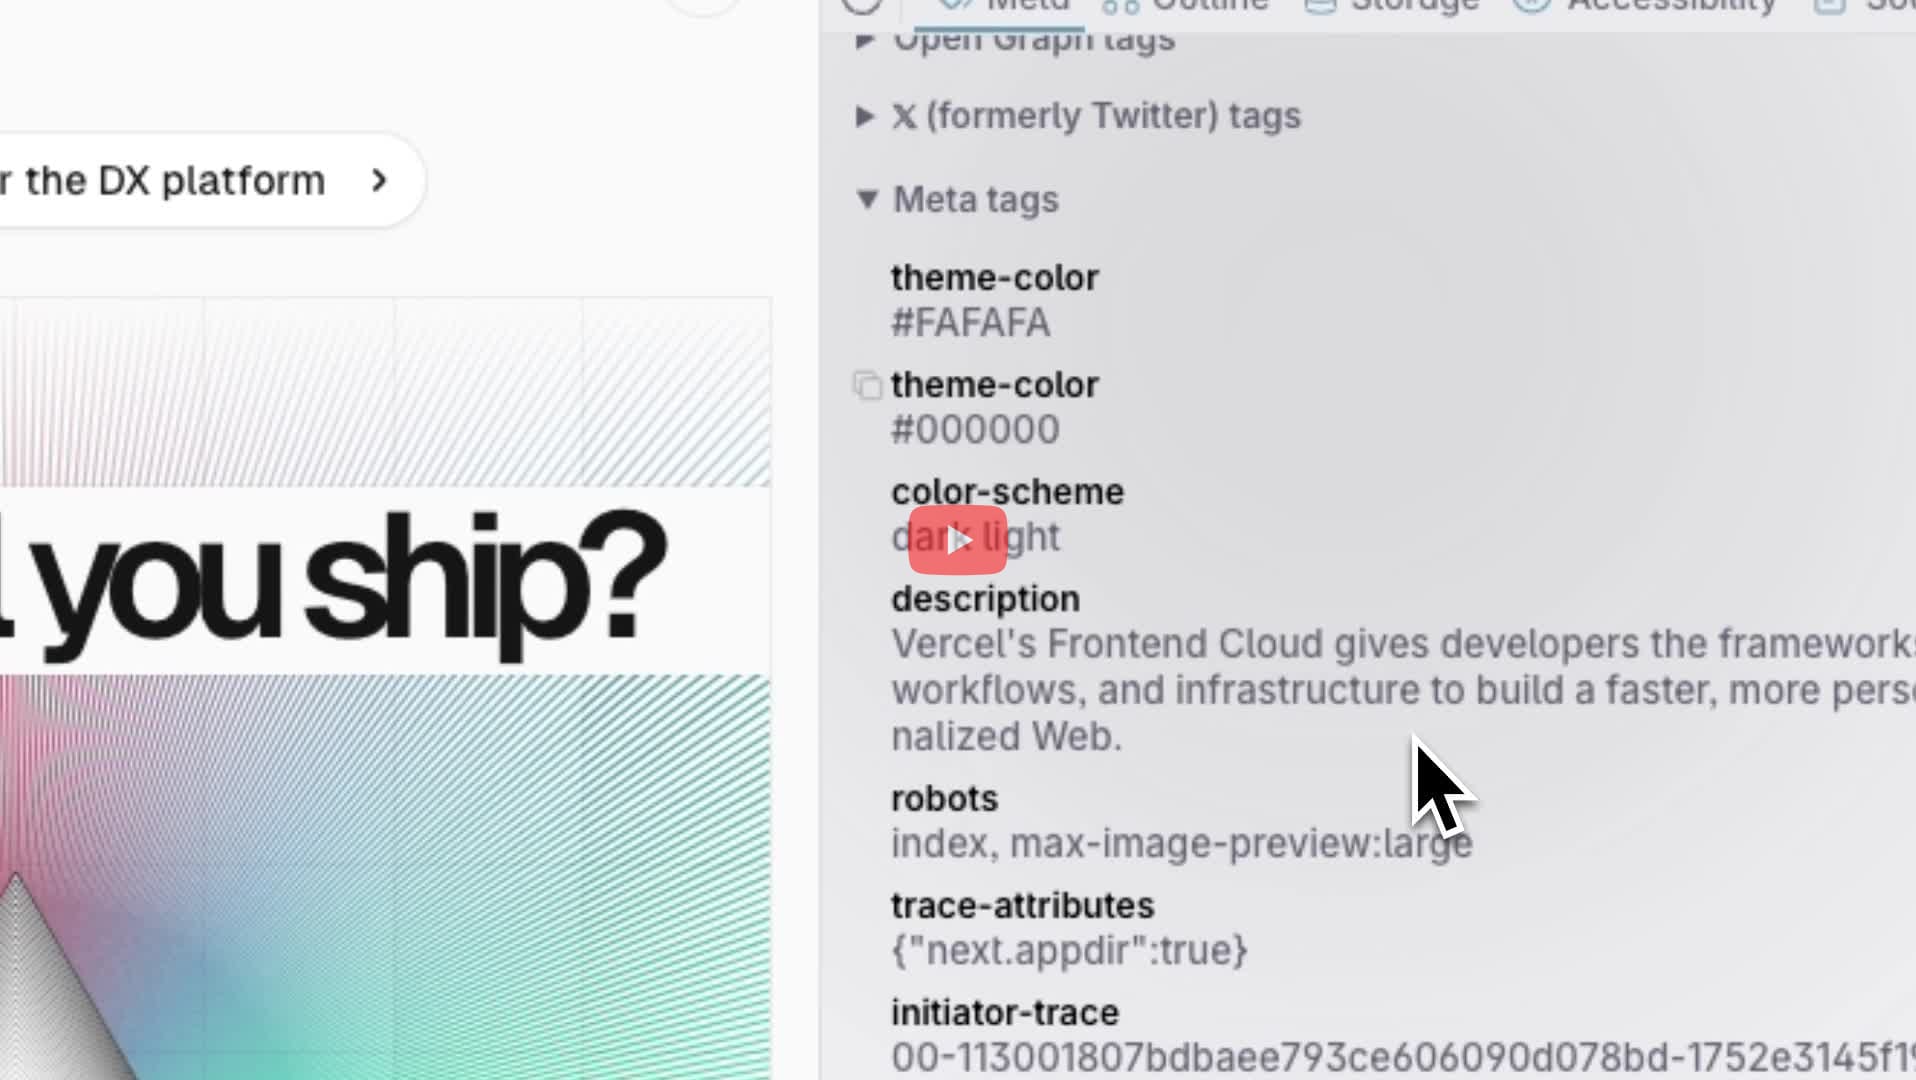
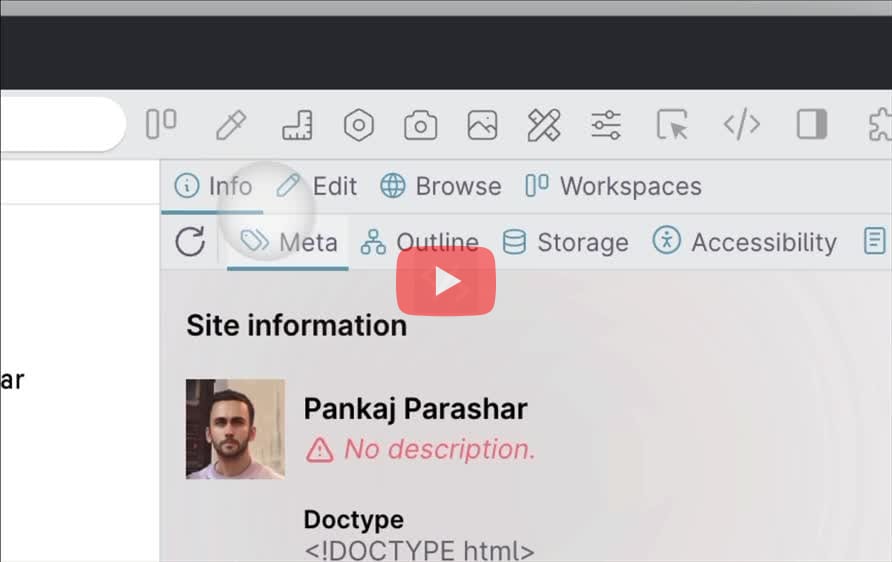
- Navigate to Info > Meta panel, under the Site information section, expand Meta tags to identify the required and optional missing meta tags on the page.
Can I disable cache for the network requests?
- Open Network panel > Look for "Disable cache" in the toolbar at the top.
- Open Network panel > Look for "Disable Cache" in the toolbar at the top.
Edge:
- Open Network panel > Look for "Disable Cache" in the toolbar at the top.
- Open Network panel > Look for the icon in the top right of the toolbar with tooltip "Ignore the resource cache when loading resources".
- In the Edit menu, select "Disable cache" and choose to disable it just for the current session, or persistently.
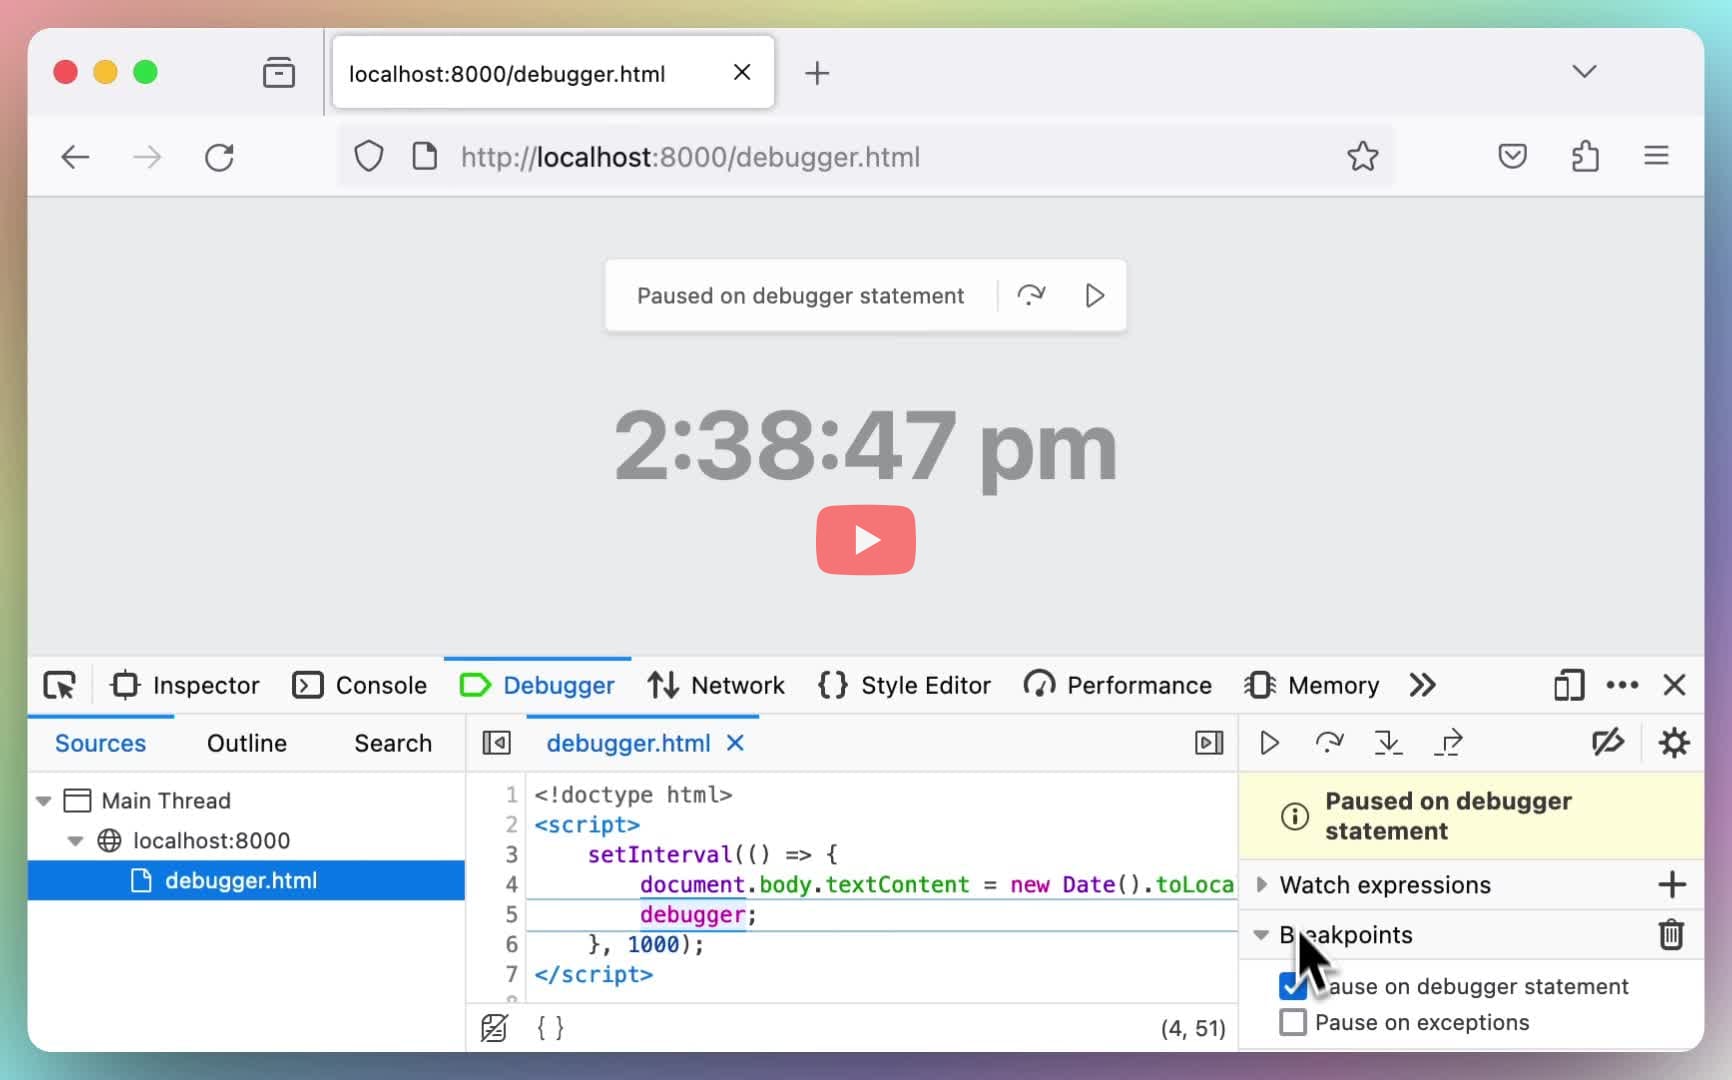
Can I prevent the debugger from pausing at the debugger statement?
- In the Debugger panel, expand the Breakpoints pane, and unselect the Pause on debugger statement option to prevent the debugger from pausing at the
debuggerstatement.
Can I disable JavaScript on a web page?
- Open devtools. Press
Shift+Cmd+Pon Mac orCtrl+Shit+Pon Windows/Linux/Chrome OS to open the Command Menu. - Search for "Disable JavaScript" and press
Enterto execute the command. - The yellow warning icon next to the Sources panel is the indicator that the JavaScript is disabled. It will continue to be disabled until the devtools is closed.
- Navigate to
about:configin the address bar. Click on "Accept the Risk and Continue" while proceeding with caution. - Search for "javascript.enabled" in the preference textbox.
- Toggle the boolean value to False, using the
⇋button.
Edge:
- Open devtools. Press
Shift+Cmd+Pon Mac orCtrl+Shit+Pon Windows/Linux/Chrome OS to open the Command Menu. - Search for "Disable JavaScript" and press
Enterto execute the command. - The yellow warning icon next to the Sources panel is the indicator that the JavaScript is disabled. It will continue to be disabled until the devtools is closed.
- In the menu bar, navigate to Safari > Preferences.
- Click on the Security tab. Under the Web Content section, uncheck the "Enable JavaScript" checkbox.
- Open the "debug tools" of an individual pane.
- under "Disable features", select "Disable JS".
Can I disable local fonts to validate @font-face rules?
- Open Command Menu (
Cmd+Shift+PorCtrl+Shift+P) > Run "Show Rendering" to open the Rendering drawer. - Scroll down to locate the Disable local fonts option and select the checkbox to disable local fonts. Reload the page to apply the setting.
Edge:
- Open Command Menu (
Cmd+Shift+PorCtrl+Shift+P) > Run "Show Rendering" to open the Rendering drawer. - Scroll down to locate the Disable local fonts option and select the checkbox to disable local fonts. Reload the page to apply the setting.
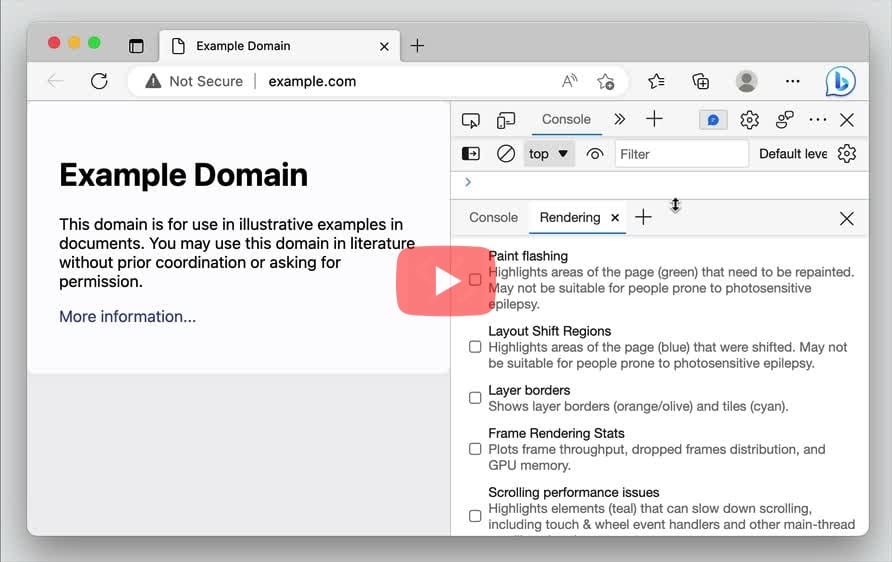
Can I display the current frames per second (FPS) of the page?
- Open Command Menu (
Cmd+Shift+PorCtrl+Shift+P) > Run "Show frames per second (FPS) meter".
Edge:
- Open Command Menu (
Cmd+Shift+PorCtrl+Shift+P) > Run "Show frames per second (FPS) meter".
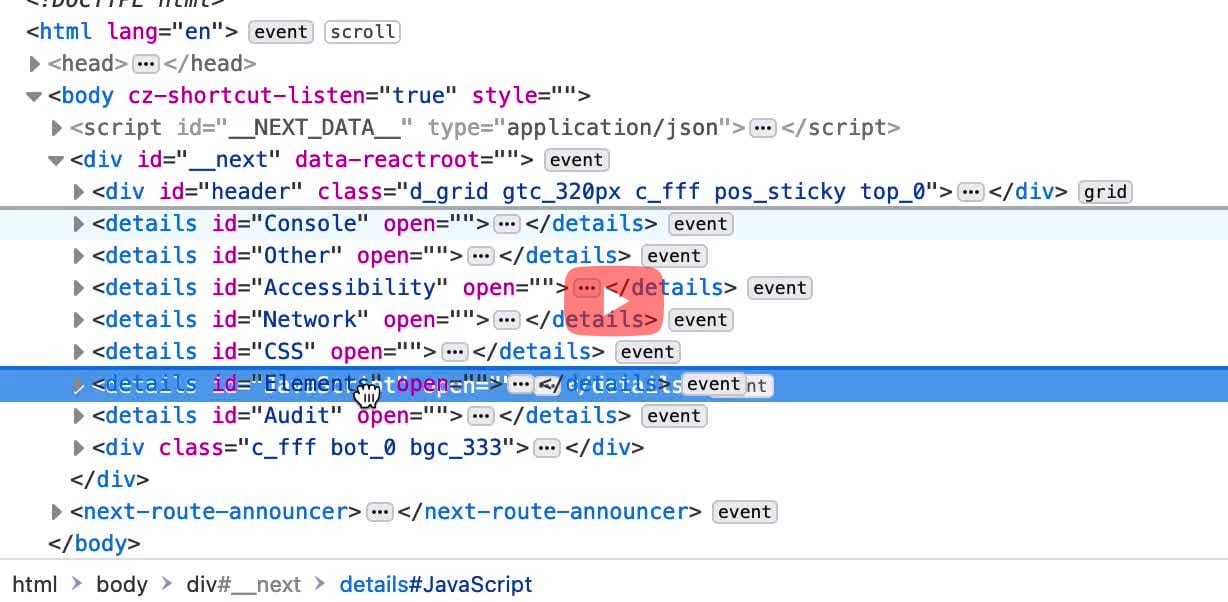
Can I drag & drop nodes anywhere inside the DOM tree?
- Inspect element or Press
Cmd+Opt+I(on Mac) orCtrl+Shift+I(on Windows/Linux). - Select the node and drag-n-drop to a different part of the DOM tree.
- Right click > Inspect element or Press
Cmd+Opt+I(on Mac) orCtrl+Shift+I(on Windows/Linux). - Select the node and drag-n-drop to a different part of the DOM tree.
Edge:
- Right click > Inspect element or Press
Cmd+Opt+I(on Mac) orCtrl+Shift+I(on Windows/Linux). - Select the node and drag-n-drop to a different part of the DOM tree.
- Select any DOM node from the DOM tree, drag and drop anywhere in the tree to place the element.
Can I duplicate a node in the DOM tree?
- In the Elements panel, right click on the node and select "Duplicate element".
Can I edit the node as HTML?
- In the Elements panel, right click on the node and select "Edit as HTML".
Can I edit and resend network requests?
- In the Network panel, right click on the request and select Edit and Resend.
- This will open a New Request panel, where you can edit the method, URL, query string, headers and the body of the request.
- Click Send to dispatch the request.
Edge:
- In the Network panel, right click on the request and select Edit and Resend.
- This will open the Network Console panel where you can edit the method, URL, query string, headers and the body of the request.
- Click Send to dispatch the request.
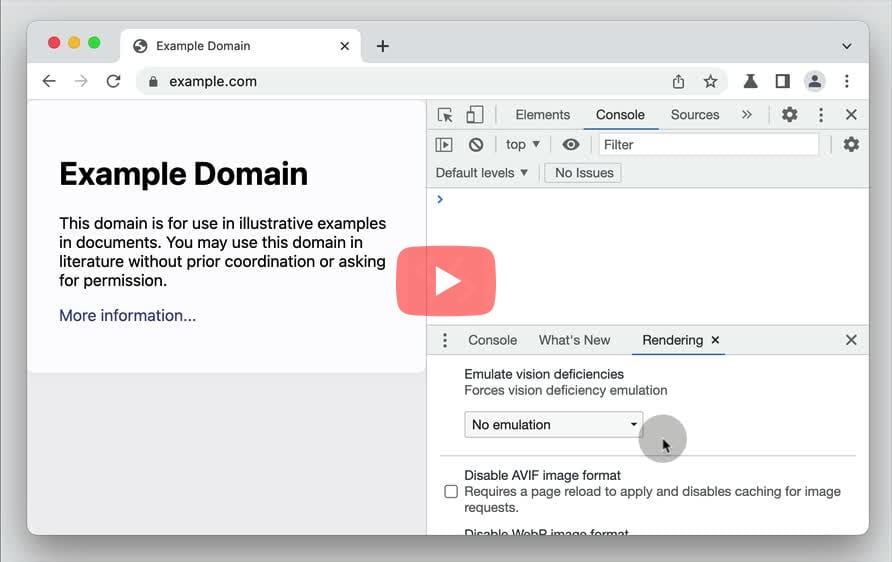
Can I emulate blurred vision on a page?
- Run Command (
Cmd+Shift+PorCtrl+Shift+P) > "Show Rendering" (Drawer). - Navigate to the Emulate vision deficiencies section and choose "Blurred vision".
Edge:
- Run Command (
Cmd+Shift+PorCtrl+Shift+P) > "Show Rendering" (Drawer). - Navigate to the Emulate vision deficiencies section and choose "Blurred vision".
- Open the "debug tools" of an individual pane.
- Go to the "Simulators" tab.
- Choose between "Far-sightedness" and "Astigmatism".
Can I emulate different color schemes for dark and light mode?
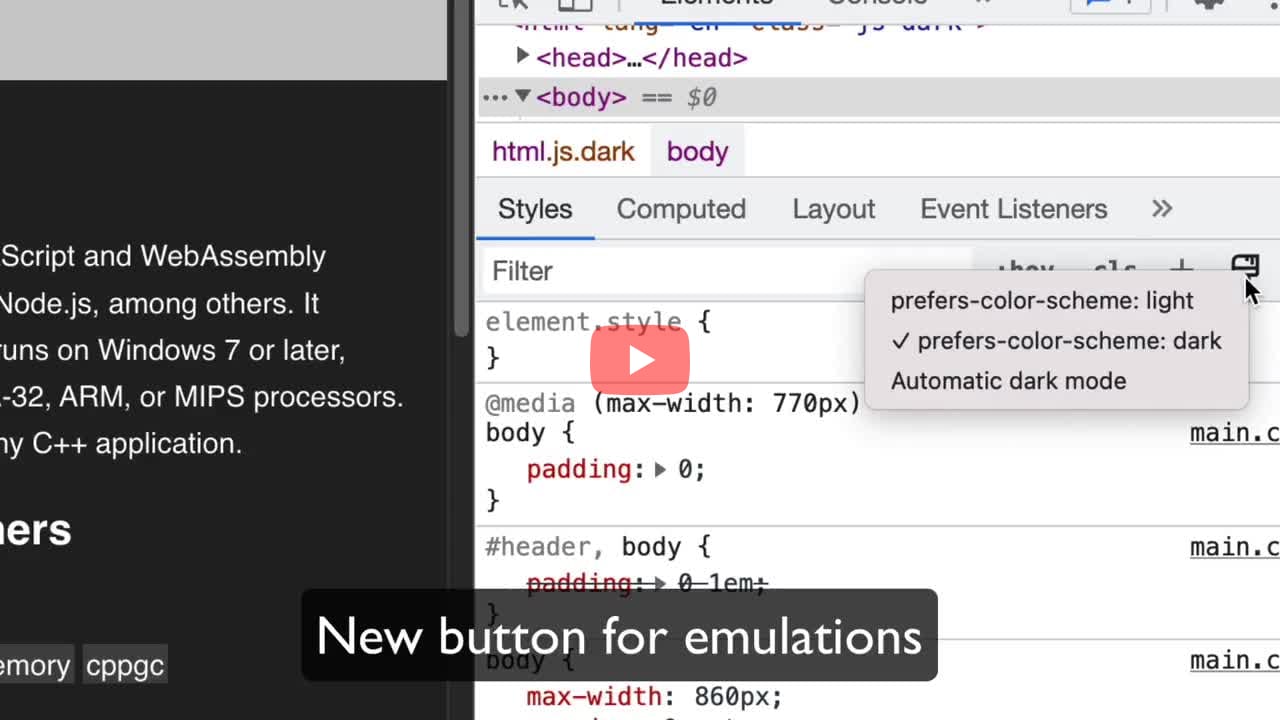
- Open devtools > Inside the "Styles" pane, right next to the "+" button, click the Icon "Toggle common rendering emulations".
- Choose the
prefers-color-schemeoption to emulate the corresponding color scheme.
- Open devtools > Inspector > Next to the "Filter Styles" section, are the icons to toggle between light, dark color schemes.
Edge:
- Open devtools > Inside the "Styles" pane, right next to the "+" button, click the Icon "Toggle common rendering emulations".
- Choose the
prefers-color-schemeoption to emulate the corresponding color scheme.
Safari:
Open Web Inspector using Cmd+Opt+I. Look for the icon in the top right of the Elements panel, to toggle between "Force Dark Appearance" and "Use Default Appearance".
- Open the "Media and Emulation" settings of a pane.
- Under "Media features", Toggle between light and dark values for
prefers-color-scheme.
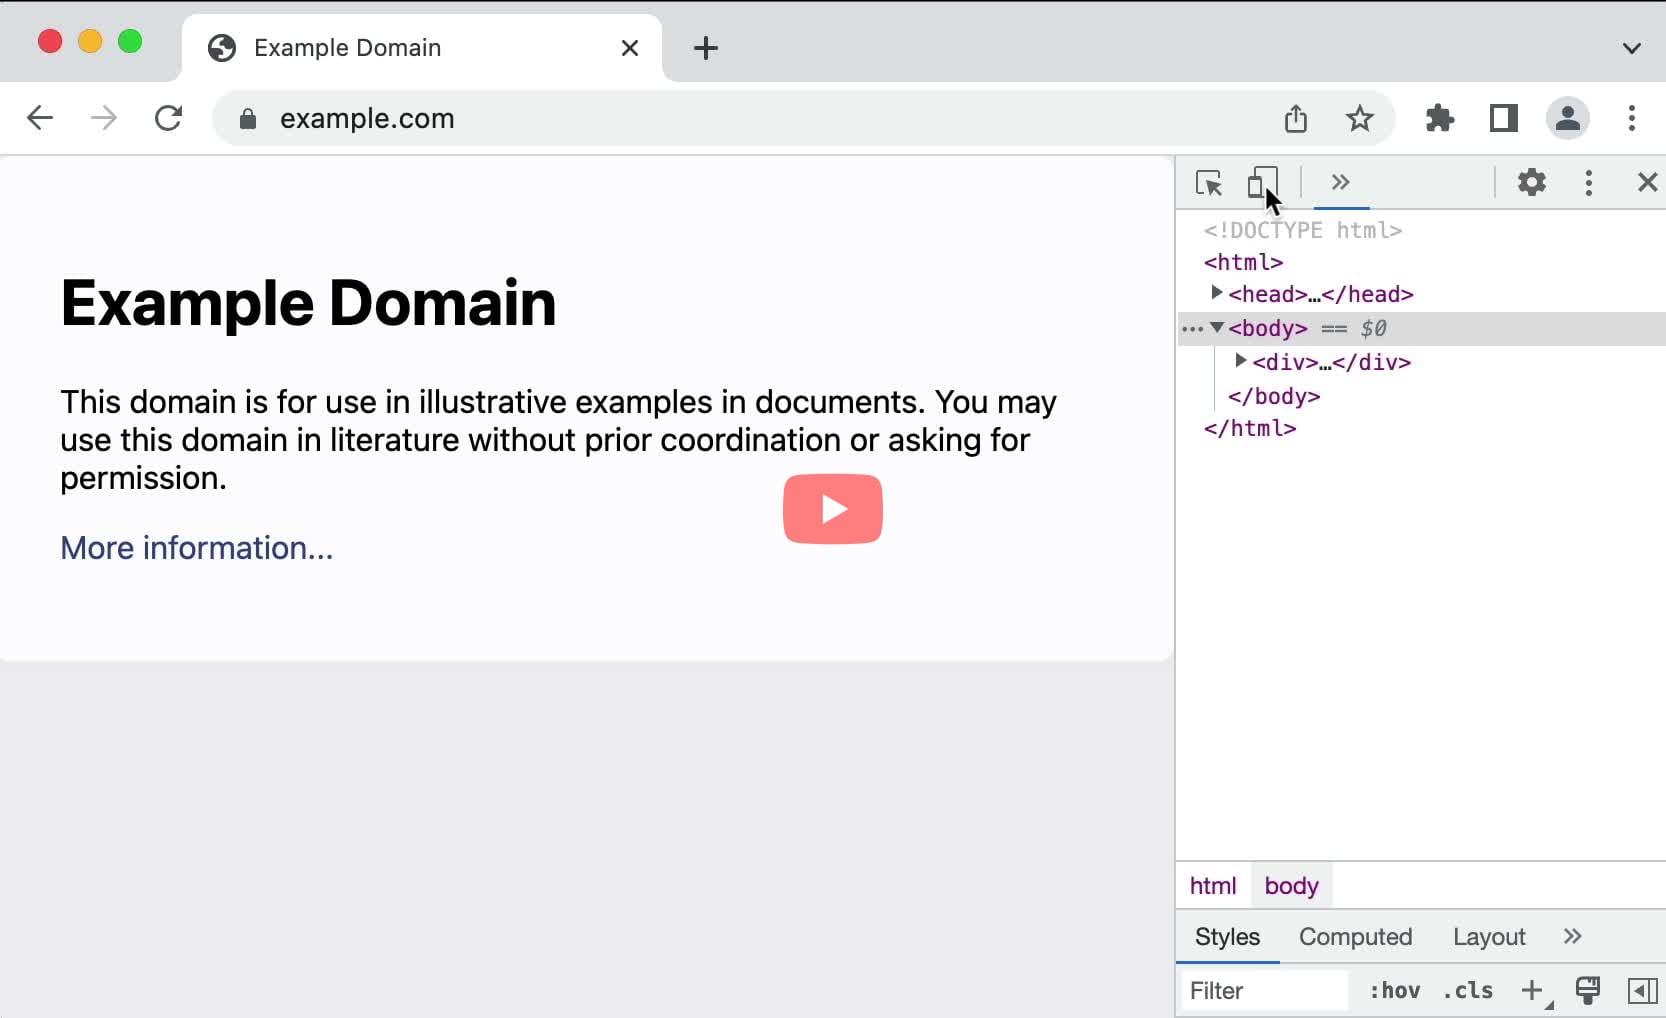
Can I emulate devices to test responsiveness of a page?
- Open devtools using
Cmd+Opt+I(on MacOS) orCtrl+Shift+I(on Windows/Linux). - Press
Cmd+Shift+M(on MacOS) orCtrl+Shift+M(on Windows/Linux) or click the devices icon in the top right to "Toggle device toolbar".
Firefox: There are three ways to toggle Responsive Design Mode:
- From the Firefox menu: Select Responsive Design Mode from the Web Developer submenu in the Firefox Menu (or Tools menu if you display the menu bar or are on macOS).
- From the Developer Tools toolbox: Press the Responsive Design Mode button in the Toolbox’s toolbar.
- From the keyboard: Press Ctrl+Shift+M (or Cmd+Opt+M on macOS).
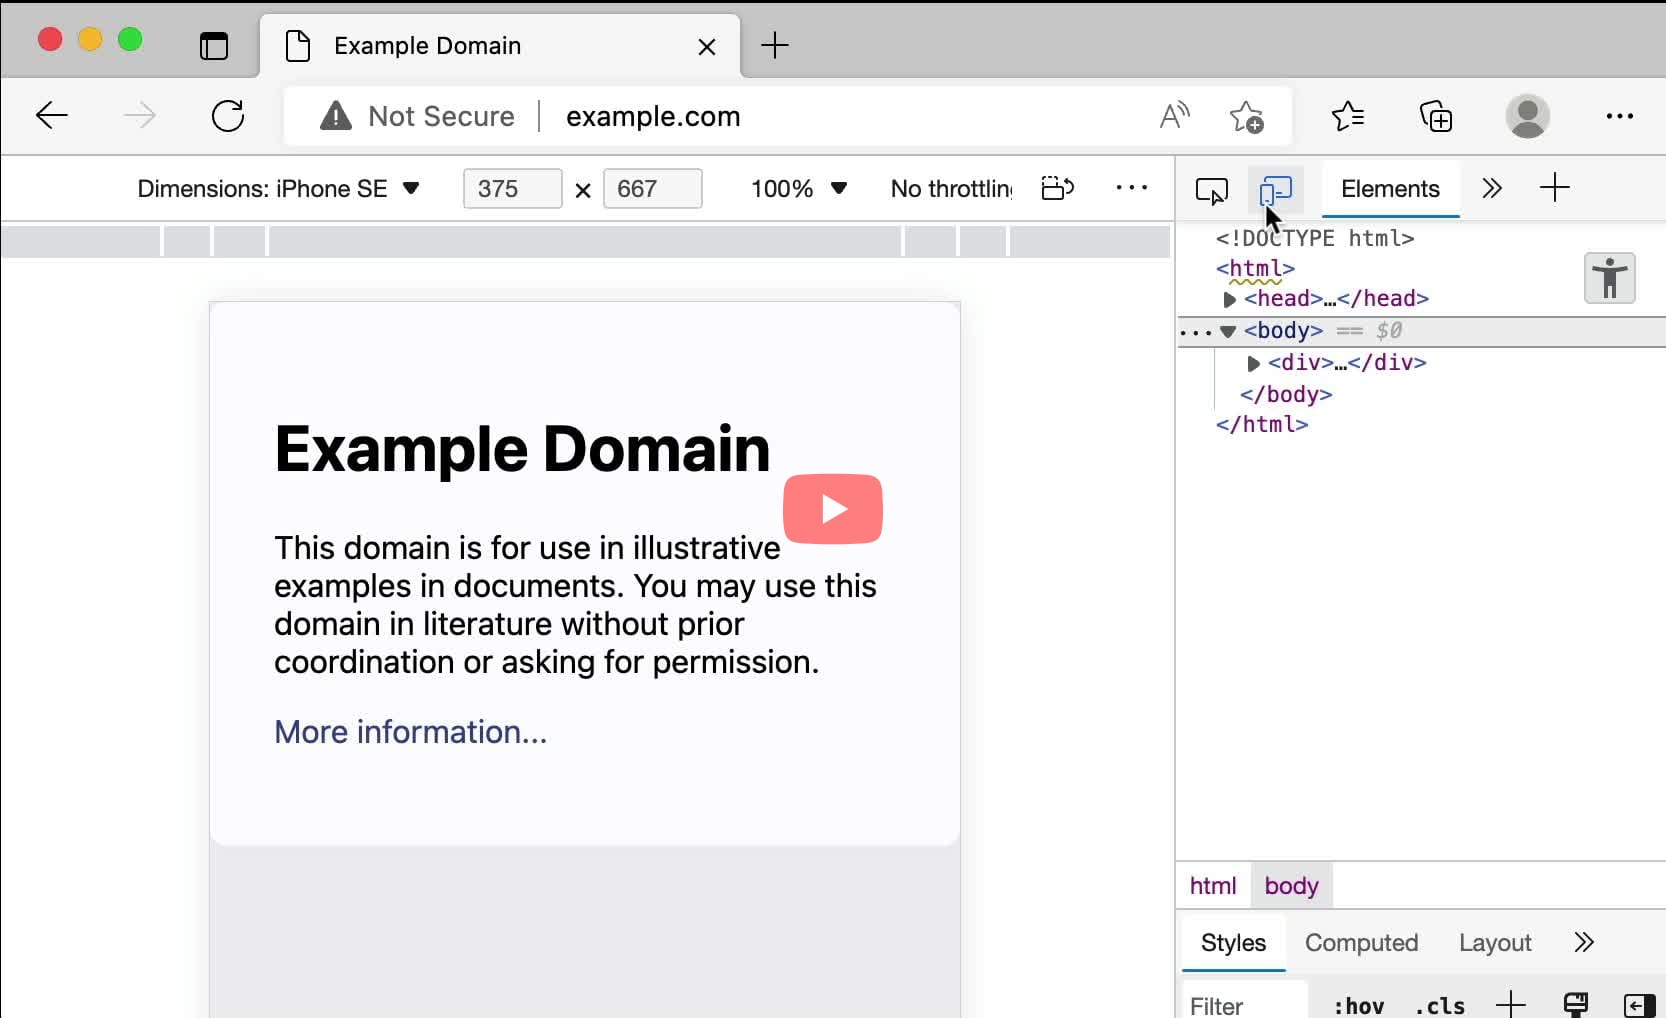
Edge:
- Open devtools using
Cmd+Opt+I(on MacOS) orCtrl+Shift+I(on Windows/Linux). - Press
Cmd+Shift+M(on MacOS) orCtrl+Shift+M(on Windows/Linux) or click the devices icon in the top right to "Toggle device toolbar".
- From the menu bar: Develop > Enter Responsive Design Mode (or press
Ctrl+Cmd+R).
- Click the title of a pane.
- Select one of the 30+ available device presets
- Optionally, switch between the viewport size and device size. Viewport size takes the device UI into account to give you the real available space.
Can I emulate detection of the user state as idle?
- Open Command Menu (
Cmd+Shift+PorCtrl+Shift+P) > Run "Sensors" > PressEnter. - Scroll down to the section "Emulate Idle Detector state" and select the appropriate option to force the selected idle state for emulation.
Can I emulate print media query?
- Launch devtools > Open "Command Menu" using
Cmd+Shift+P(Mac) orCtrl+Shift+P(Windows, Linux, Chrome OS). - Search for "Show Rendering" and press Enter (this will open the Rendering panel next to the Console).
- Scroll down to the section "Emulate CSS Media Type" and select "print".
- Inspect > In the "Filter Styles" section on the right, look for the icon with the title, "Toggle print media simulation for the page".
Edge:
- Launch devtools > Open "Command Menu" using
Cmd+Shift+P(Mac) orCtrl+Shift+P(Windows, Linux, Chrome OS). - Search for "Show Rendering" and press Enter (this will open the Rendering panel next to the Console).
- Scroll down to the section "Emulate CSS Media Type" and select "print".
- In the Elements panel, click the printer icon in the toolbar at the top to force the page to use the print media styles.
- Click Change Media and Emulations from the top toolbar > Media (tab) > Select print to emulate the print media styles.
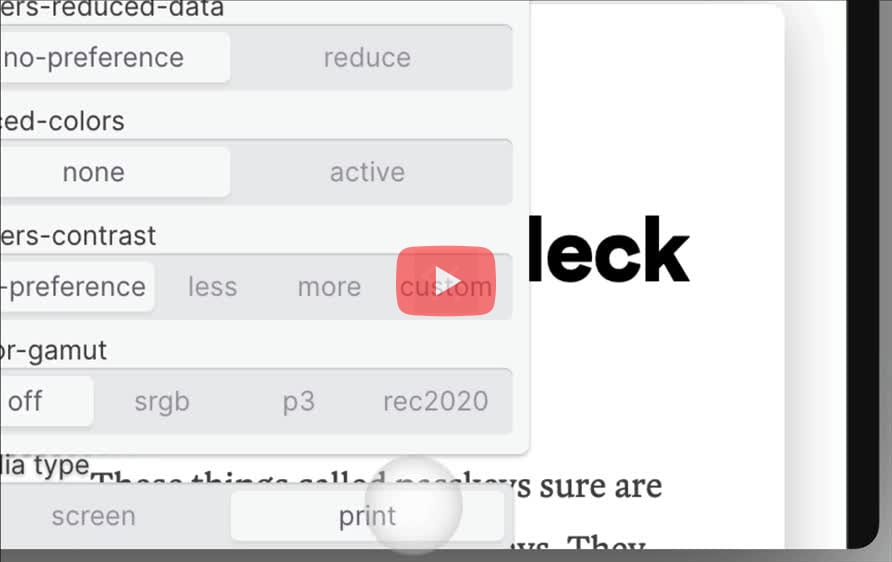
Can I emulate reduced transparency CSS media feature?
- Open Command Menu (
Cmd+Shift+PorCtrl+Shift+P) > Run "Show Rendering". Scroll down to the Emulate CSS media features section and selectprefers-reduced-transparency: reduceto apply the effect.
- In Developer Tools, click the Change Media and Emulations button in the toolbar to open the popup.
- In the Media tab, click the reduce toggle button to preview the page with reduced transparency effect. Revert the effect by clicking the no-preference button.
Can I expand DOM nodes recursively in the DOM tree?
- Right click on the node in the DOM tree, select "Expand recursively".
- (Or) Use
Opt+ClickorAlt+Clickon the arrow preceding the node with the keyboard.
- Right click on the node in the DOM tree, select "Expand All".
- (Or) Use
Opt+ClickorAlt+Clickon the arrow preceding the node with the keyboard.
Edge:
- Right click on the node in the DOM tree, select "Expand recursively".
- (Or) Use
Opt+ClickorAlt+Clickon the arrow preceding the node with the keyboard.
- Right click on the node in the DOM tree, select "Expand All".
- (Or) Use
Opt+ClickorAlt+Clickon the arrow preceding the node with the keyboard.
Can I extend DevTools to customise UI?
- Chrome DevTools can be extended to add new UI panels and sidebars, interact with the inspected page, get information about network requests, and more.
- Refer the official guide to extend Chrome DevTools.
- Firefox uses WebExtensions APIs to extend the browser's built-in developer tools. Follow the link to know how to develop extensions for the devtools.
Edge:
- Edge DevTools can be extended to add new UI panels and sidebars, interact with the inspected page, get information about network requests, and more.
- Refer the official guide to extend Edge DevTools.
- To create a Safari web extension, you create an Xcode project using the Safari Extension App template. The project includes the Safari web extension as a macOS or iOS app extension that users can download from the App Store and install in Safari.
Can I filter network requests with blocked response cookies?
- In the Network panel, enable the Has blocked cookies option to only show requests with blocked response cookies.
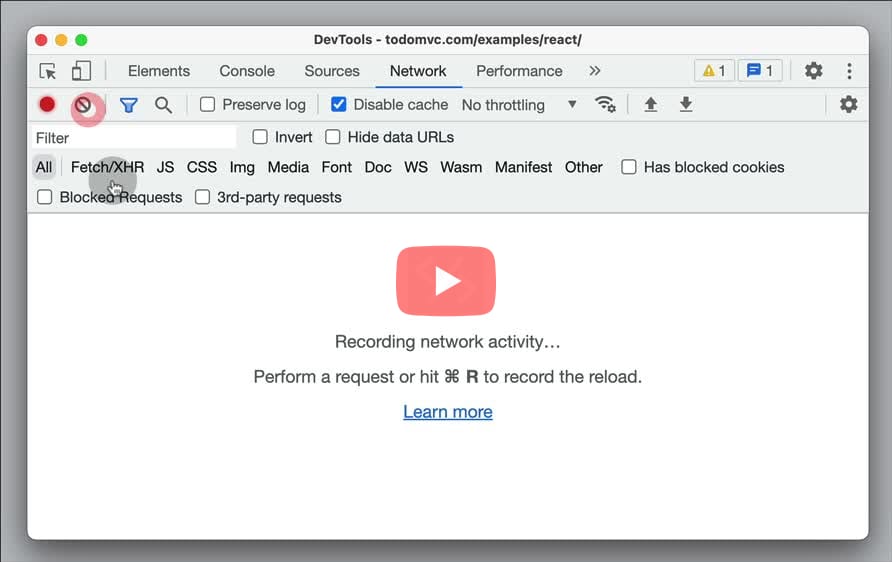
Can I filter blocked network requests?
- In the Network panel, enable the Blocked requests option to show only blocked requests.
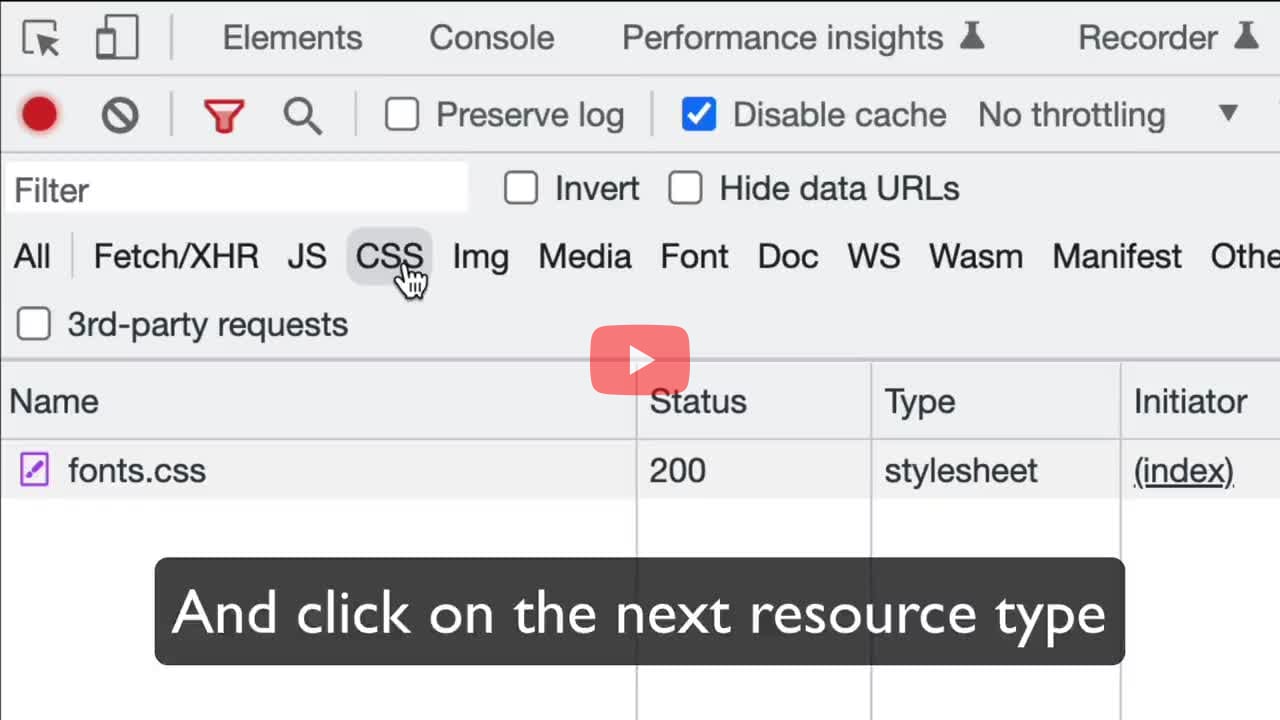
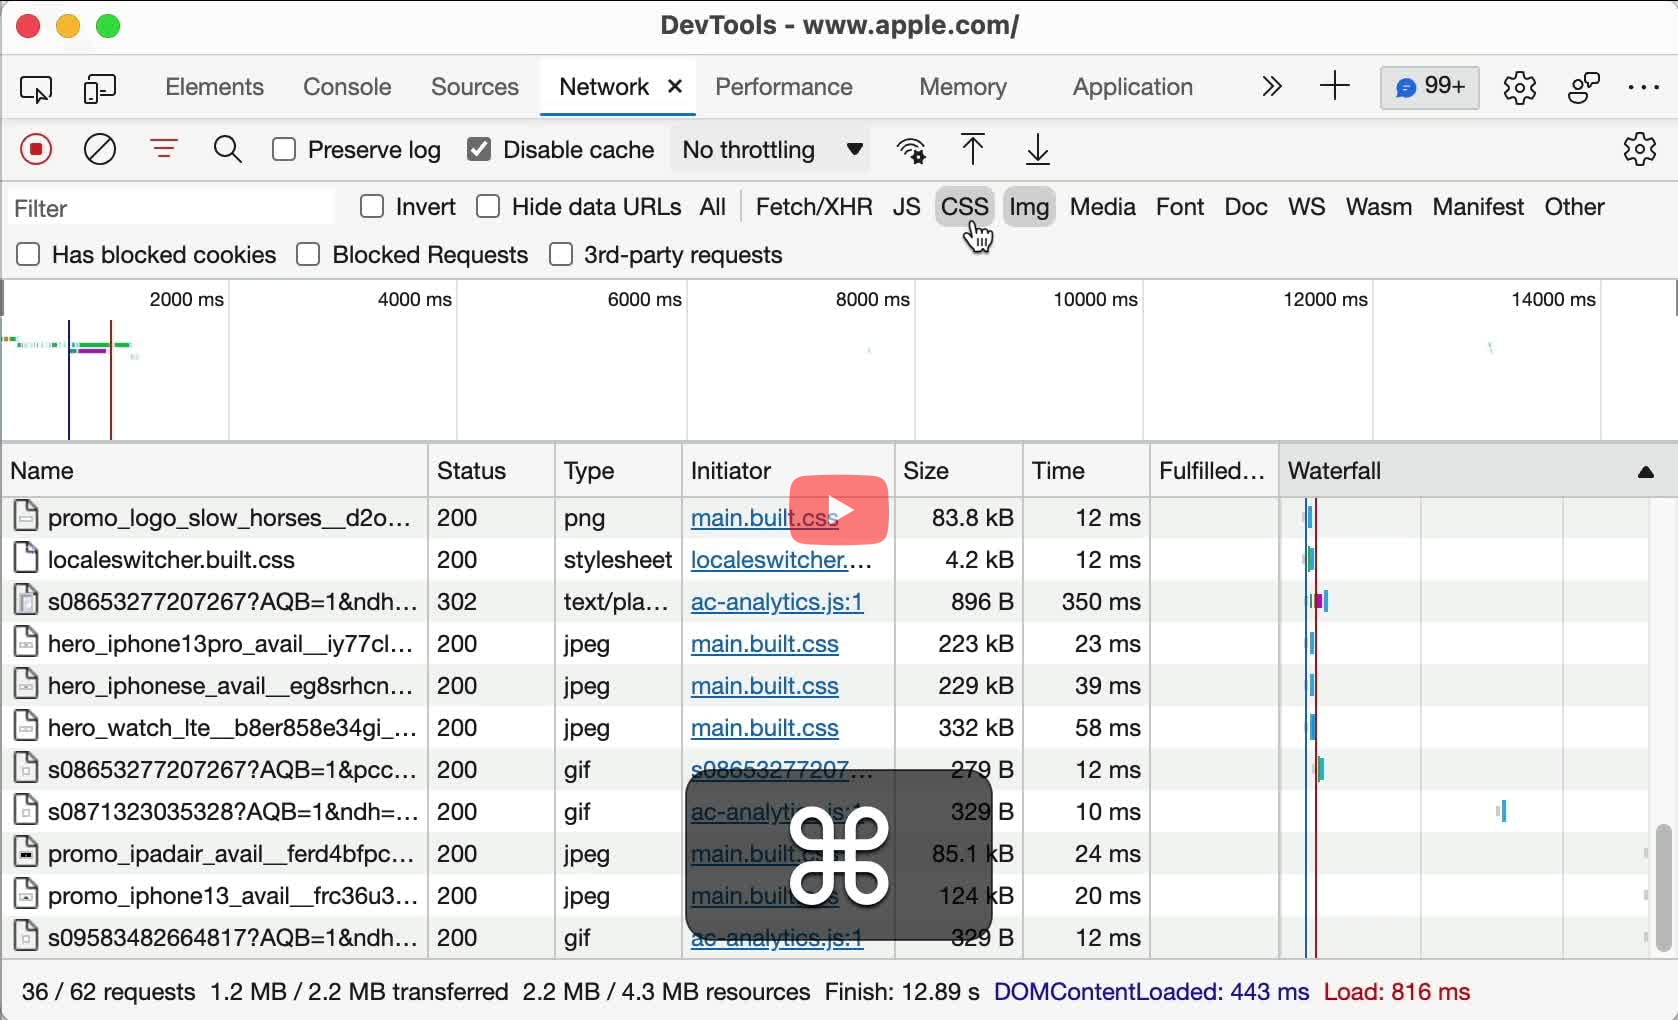
Can I filter multiple resource types in the Network tab?
- Open devtools > Open the "Network" tab. Hold
CmdorCtrlkey while clicking on the Resource type.
- In Network tab. Hold
CmdorCtrlkey while clicking on the Resource type.

Edge:
- Open devtools > Open the "Network" tab. Hold
CmdorCtrlkey while clicking on the Resource type.
- Open devtools > Open the "Network" tab. Hold
CmdorCtrlkey while clicking on the Resource type.

Can I filter network requests by domain name?
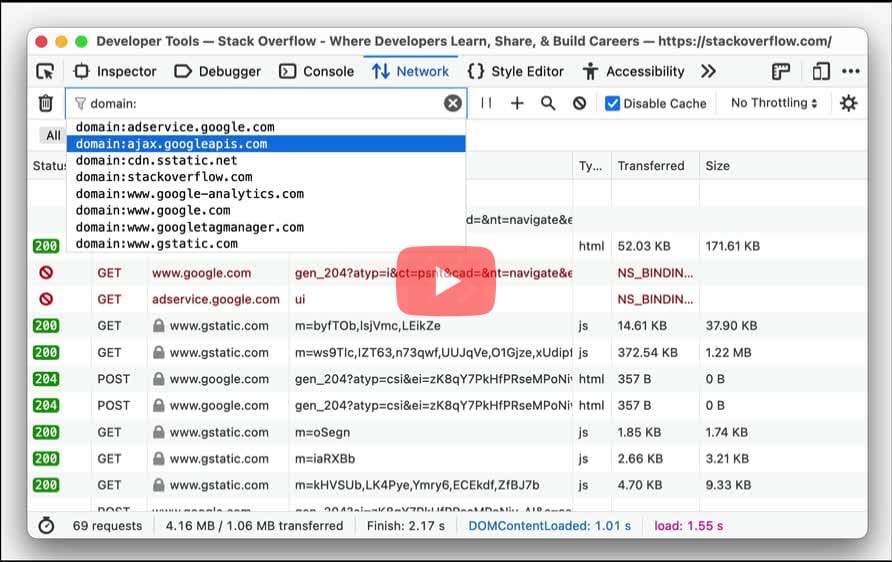
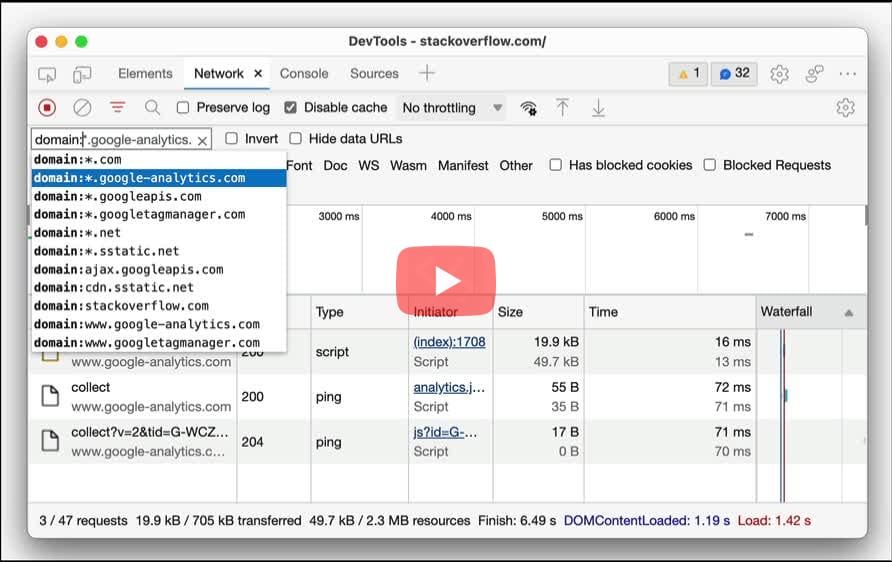
- In Network > Enter
domain:in the "Filter" field followed by the domain to filter the network requests on. - Filter field also suggests the list of domain names to choose from.
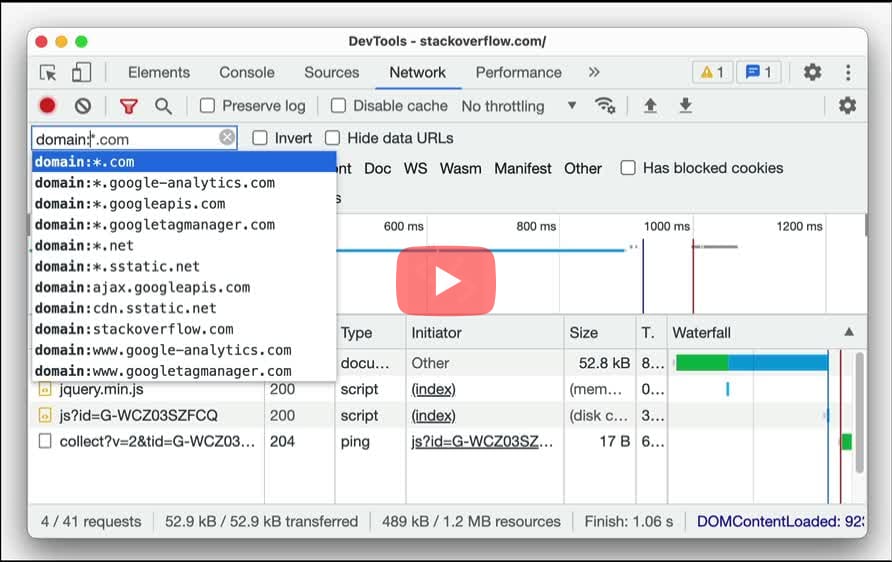
- In Network > Enter
domain:in the "Filter URLs" field followed by the domain to filter the network requests on. - Filter field also suggests the list of domain names to choose from.
Edge:
- In Network > Enter
domain:in the "Filter" field followed by the domain to filter the network requests on. - Filter field also suggests the list of domain names to choose from.
Can I filter requests in the Network tab with a keyword?
- Open the Network tab > Use the "Filter" input field to filter network requests based on a specific keyword.
- Use the "Invert" checkbox to filter on requests which does not match the keyword.
- In the Network tab, use the "Filter URLs" text field to filter the network requests for a specific keyword.
- Prepending a minus (
-) negates the filter. You can combine different filters together by separating them with a space.
Edge:
- Open the Network tab > Use the "Filter" input field to filter network requests based on a specific keyword.
- Use the "Invert" checkbox to filter on requests which does not match the keyword.
- In the Network tab, use the "Filter Full URL" input field to filter network requests for a specific keyword.
Can I filter requests in the Network tab using specific properties?
- Use the Filter text box to filter requests by properties, such as the domain or size of the request.
- You can use multiple properties simultaneously by separating each property with a space. For example,
mime-type:image/gif larger-than:1Kdisplays all GIFs that are larger than one kilobyte. These multi-property filters are equivalent to AND operations. OR operations are currently not supported.
- In the Network panel, use the "Filter URLs" field to filter network requests by properties such as domain, mime-type, size etc.,
Edge:
- Use the Filter text box to filter requests by properties, such as the domain or size of the request.
- You can use multiple properties simultaneously by separating each property with a space. For example,
mime-type:image/gif larger-than:1Kdisplays all GIFs that are larger than one kilobyte. These multi-property filters are equivalent to AND operations. OR operations are currently not supported.
Can I filter third party network requests?
- In the Network panel, enable the Third-party requests option to show only requests with origin different from page origin.
Can I find links on a page that return Error 404, 500?
- Open DevTools panel (
Cmd/Ctrl+Shift+P) > Info > Outline. Select "Links" from the dropdown menu at the top. - Scroll through the list of links to identify broken links reporting status code with 404, 500.
Can I find elements in the DOM tree using xpath?
- Open devtools using Cmd+Opt+I (on MacOS) or Ctrl+Shift+I (on Windows/Linux/ChromeOS) > Elements.
- Press Cmd+F or Ctrl+F to open the search bar at the bottom of the Elements panel.
- Enter XPath to find the element in the DOM node.
- Open devtools using Cmd+Opt+I (on MacOS) or Ctrl+Shift+I (on Windows/Linux/ChromeOS) > Inspector.
- Press Cmd+F or Ctrl+F to open the search bar at the top of the Inspector panel.
- Enter the xpath to find the element in the DOM node.
Edge:
- Open devtools using Cmd+Opt+I (on MacOS) or Ctrl+Shift+I (on Windows/Linux/ChromeOS) > Elements.
- Press Cmd+F or Ctrl+F to open the search bar at the bottom of the Elements panel.
- Enter XPath to find the element in the DOM node.
- In the Elements tab, use
Cmd+ForCtrl+Fto open the search bar at the top of the Elements panel. - Enter the xpath to find the element in the DOM node.
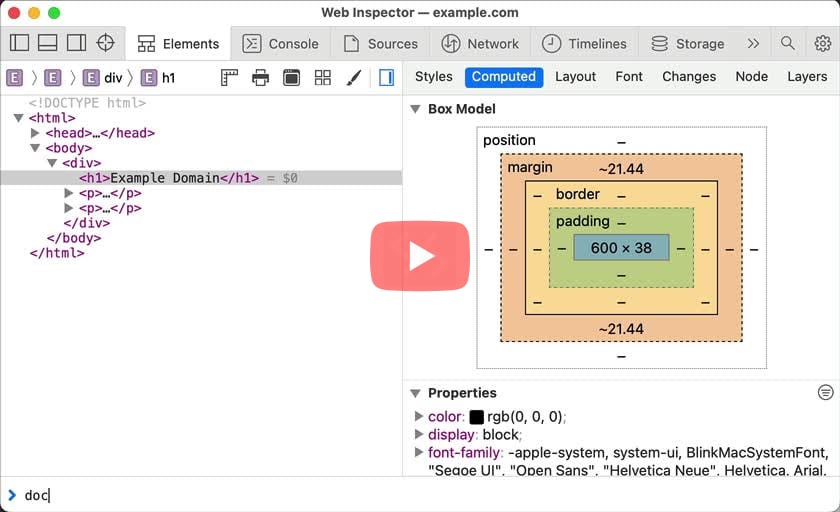
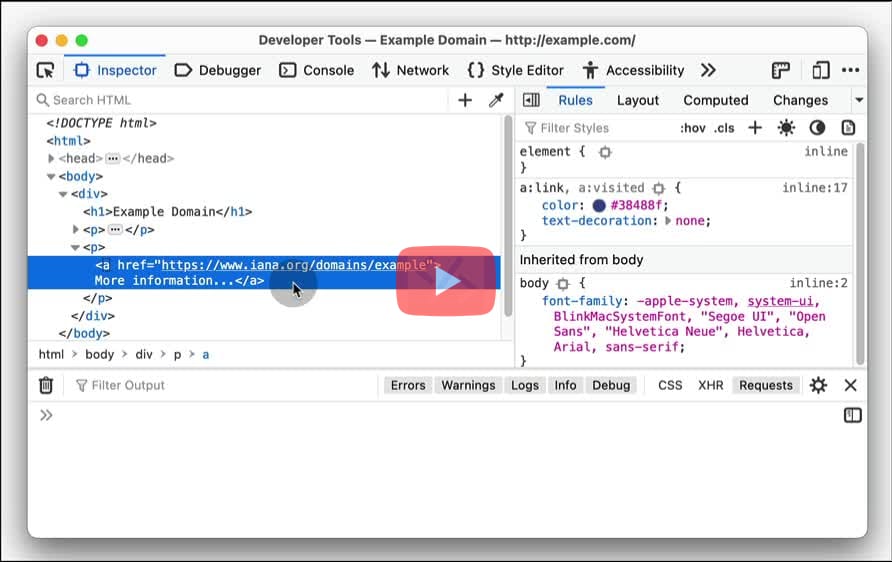
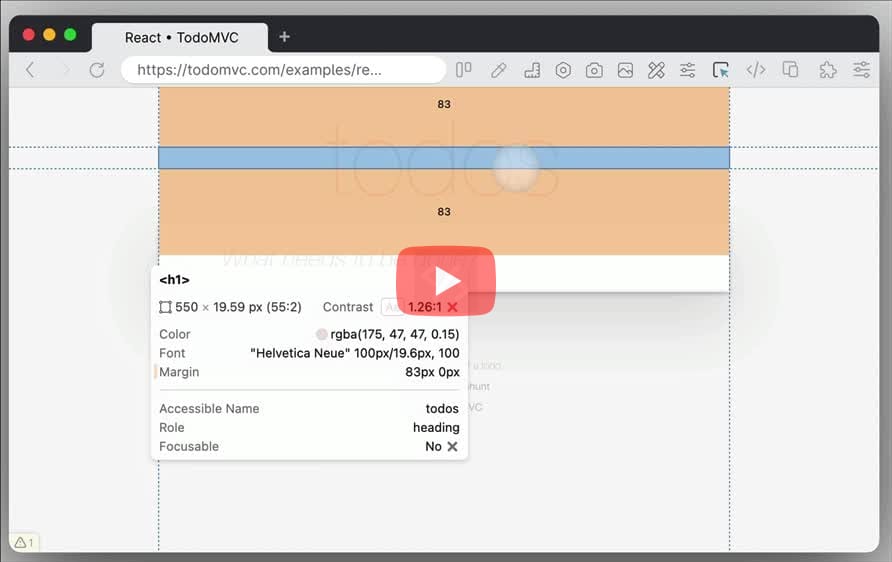
Can I find the contrast ratio of a color?
- Inspect element > In the Styles pane, click the color square next to the
colorproperty. This will open the color panel. - Expand the "Contrast Ratio" section to see more details whether the color value meets the W3C recommendation.
- Use the "reload" icon next to AA/AAA to use the suggested color to fix the low color contrast ratio.
- Inspect the text element (this will open the devtools panel).
- In the pane next to the DOM tree, look for the section where the
colorproperty is set for the element. - Click on the color circle next to the
colorproperty. This will open the color panel.
Edge:
- Inspect element > In the Styles pane, click the color square next to the
colorproperty. This will open the color panel. - Expand the "Contrast Ratio" section to see more details whether the color value meets the W3C recommendation.
- Use the "reload" icon next to AA/AAA to use the suggested color to fix the low color contrast ratio.
- Inspect element > In the Navigator you can see the contrast ratio score (AA, A or an X for failing contrast). Hover it for the precise ratio or go to the A11y tab for more information.
- To get a fix, go to the "Debug tools" of a pane, then under "Accessibility" click "Contrast checker". Suggestions will be shown in the page.
Can I find elements in the DOM tree using CSS selector?
- Open devtools > Click the "Elements" panel > Press
Cmd+F(on Mac) orCtrl+F(on Windows/Linux/Chrome OS) to open the search bar. - Enter the CSS selector to search an element in the DOM tree.
- Open devtools > Click the "Inspector" tab to open the DOM tree > Under the Inspector tab, locate the "Search HTML" field.
- Enter the CSS selector to search the element in the DOM tree.
Edge:
- Open devtools > Click the "Elements" panel > Press
Cmd+F(on Mac) orCtrl+F(on Windows/Linux/Chrome OS) to open the search bar. - Enter the CSS selector to search an element in the DOM tree.
- In the Elements tab, use
Cmd+ForCtrl+Fto open the search box. Type the CSS selector and then pressEnterto find elements matching the condition.
Can I find expensive CSS selectors?
Edge:
- In the Performance panel, Enable "advanced rendering instrumentation (slow)" in Settings.
- Click Record, and perform the operation on the page that affects rendering.
- In the recorded profile, identify a long style recalculation and select it in the waterfall view (“Main” section).
- In the bottom tab bar, click Selector Stats. Sort the selectors based on Elapsed Time, Match Attempts etc., to identify expensive selectors.
Can I find in files for a specific keyword?
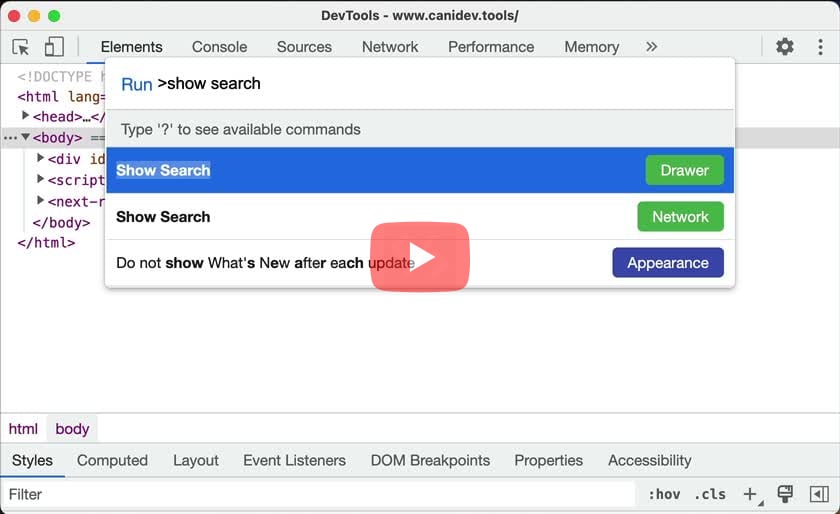
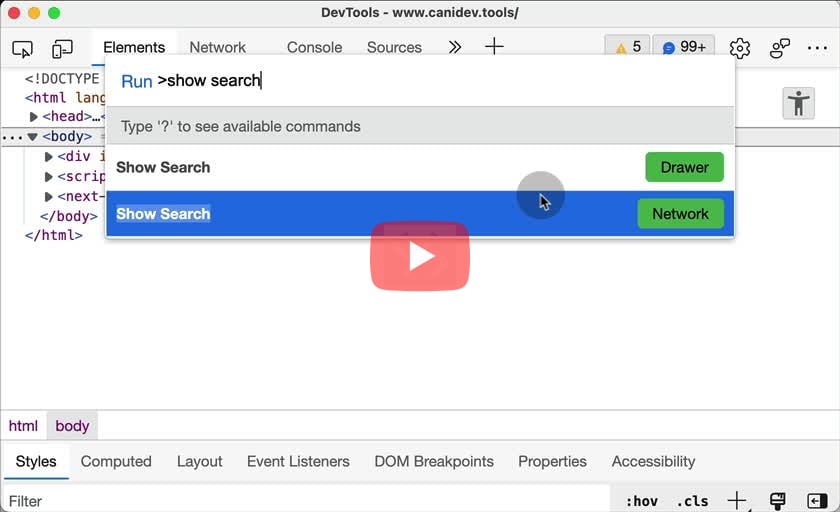
- Open Command Menu (
Cmd+Shift+PorCtrl+Shift+P) > Run > "Show Search" (Drawer). - Enter the search query in the text field and press
Enterto search across all download resources.
- In the Debugger tab, press
Cmd+Shift+ForCtrl+Shift+Fto find in files for a specific keyword.
Edge:
- Open Command Menu (
Cmd+Shift+PorCtrl+Shift+P) > Run > "Show Search" (Drawer). - Enter the search query in the text field and press
Enterto search across all download resources.
- Anywhere in the web inspector, press
Cmd+Shift+Fto find in files for a specific keyword.
Can I find inactive styles applied to an element?
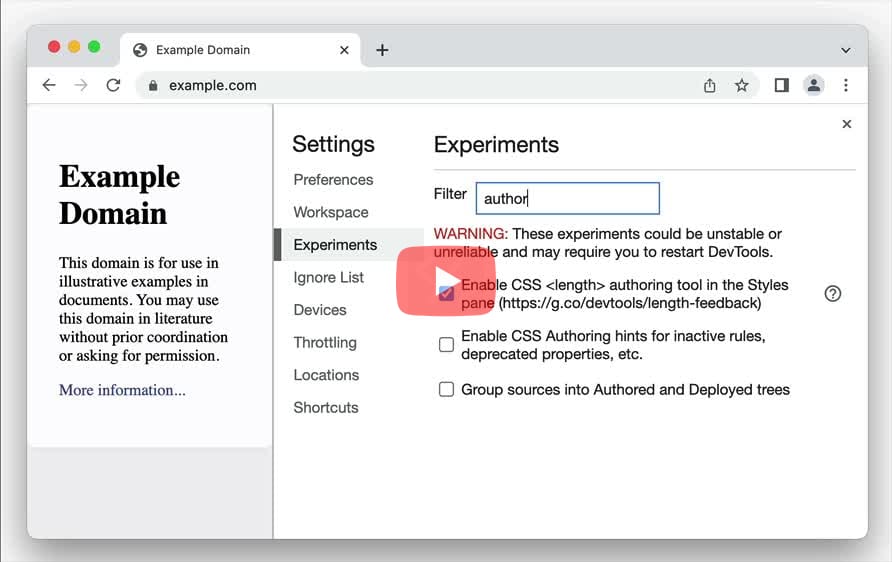
- Enable authoring hints, by opening Settings (
F1) > Experiments > Filter on "authoring hints" > Check "Enable CSS Authoring hints..." - In Elements > Locate the authored styles in the Styles pane > Inactive declarations have an "i" icon, which on hover reveals a tooltip displaying more information.
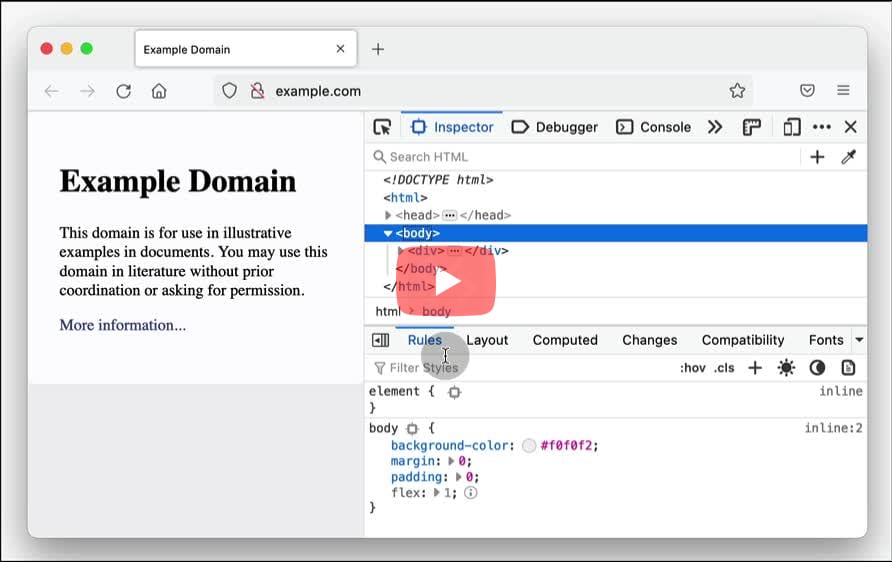
- In Inspector > Locate the styles in the Rules pane. Inactive styles will have an "i" icon next to it, which on hover will reveal more information about it.
Edge:
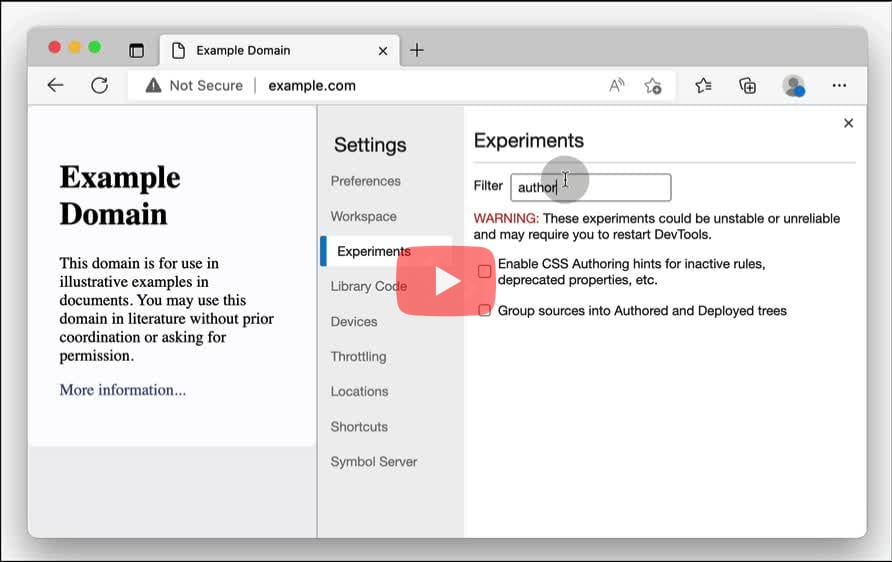
- Enable authoring hints, by opening Settings (
F1) > Experiments > Filter on "authoring hints" > Check "Enable CSS Authoring hints..." - In Elements > Locate the authored styles in the Styles pane > Inactive declarations have an "i" icon, which on hover reveals a tooltip displaying more information.
Can I find the offset parent of an element?
- Inspect the element in the Elements panel. Open the Debug tab, scroll down to the Context section to find the offset parent of the element.
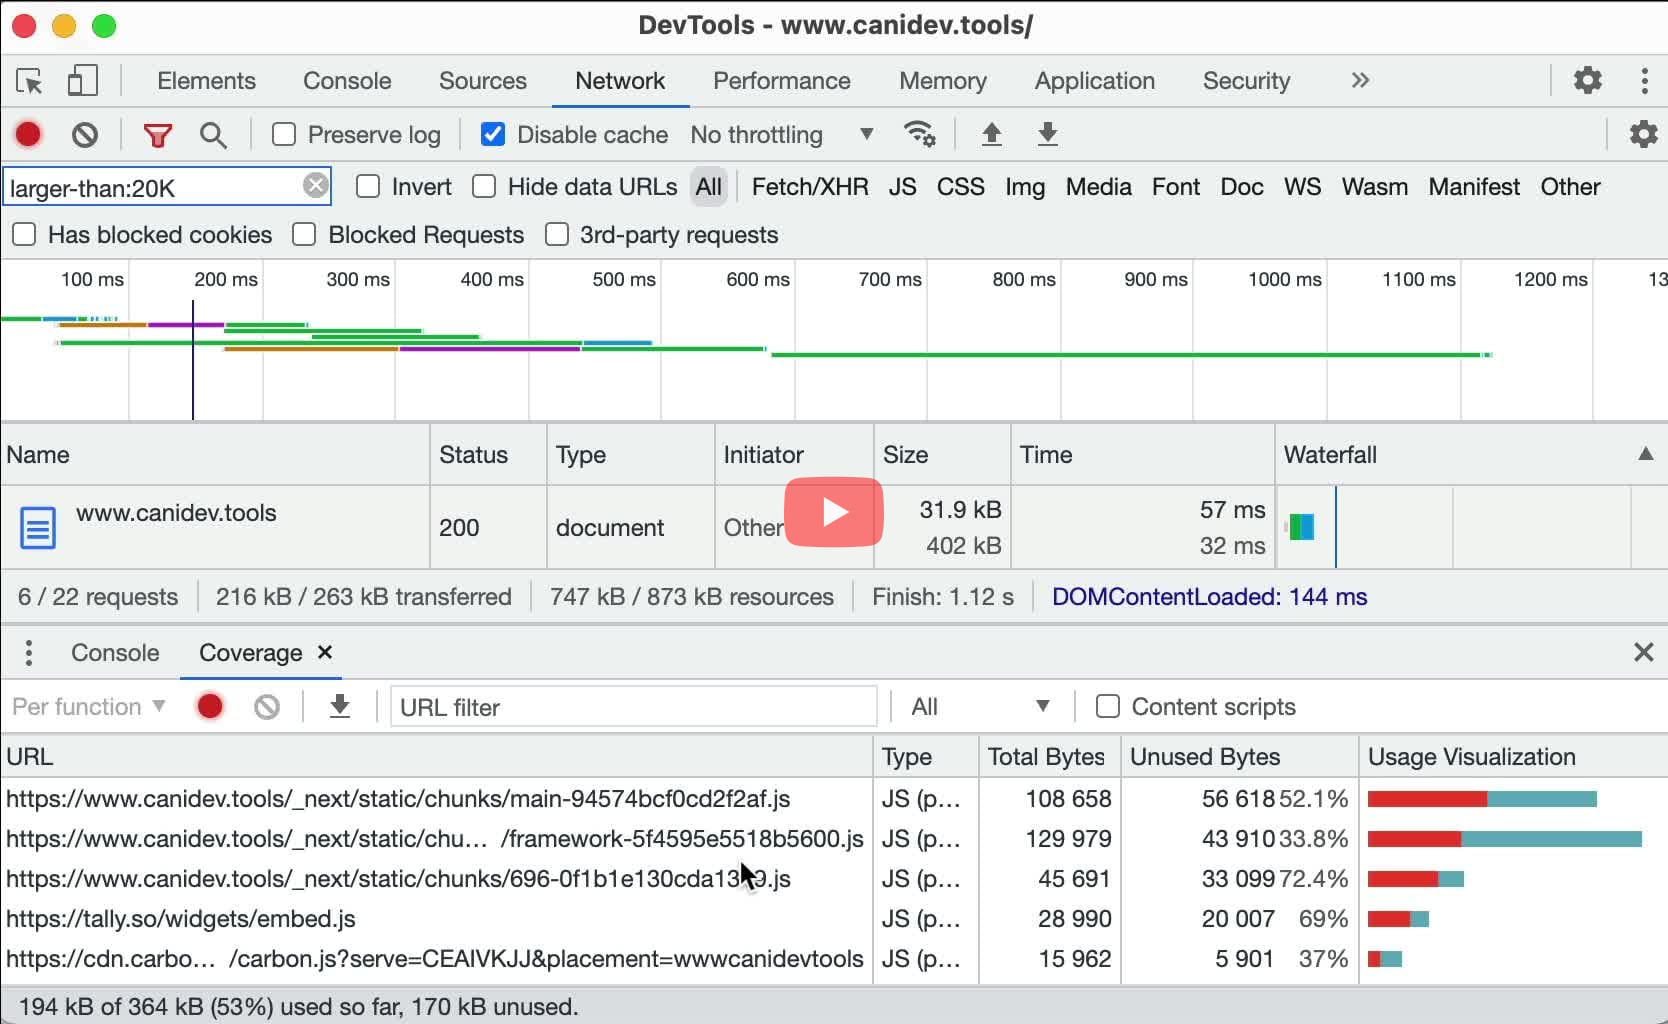
Can I find unused styles on a web page?
- Launch Devtools > Open Command Menu using "Cmd+Shift+P" (on Mac) or "Ctrl+Shift+P" (on Windows/Linus/Chrome OS).
- Search for "Show Coverage" (this will open the Coverage drawer next to the Console).
- Click the "Reload" button to see the unused styles per CSS file.
Edge:
- Launch Devtools > Open Command Menu using "Cmd+Shift+P" (on Mac) or "Ctrl+Shift+P" (on Windows/Linus/Chrome OS).
- Search for "Show Coverage" (this will open the Coverage drawer next to the Console).
- Click the "Reload" button to see the unused styles per CSS file.
Can I find unused JavaScript code on the page?
- Open Command Menu using
Cmd+Shift+PorCtrl+Shift+P. Search for "Show Coverage" and pressEnter. (this will open the Coverage drawer next to the Console). - Click the "Reload" button to see the unused JavaScript bytes per file. Clicking the row, will open the file in the Sources panel highlighting the unused lines with red colour.
Edge:
- Open Command Menu using
Cmd+Shift+PorCtrl+Shift+P. Search for "Show Coverage" and pressEnter. (this will open the Coverage drawer next to the Console). - Click the "Reload" button to see the unused JavaScript bytes per file. Clicking the row, will open the file in the Sources panel highlighting the unused lines with red colour.
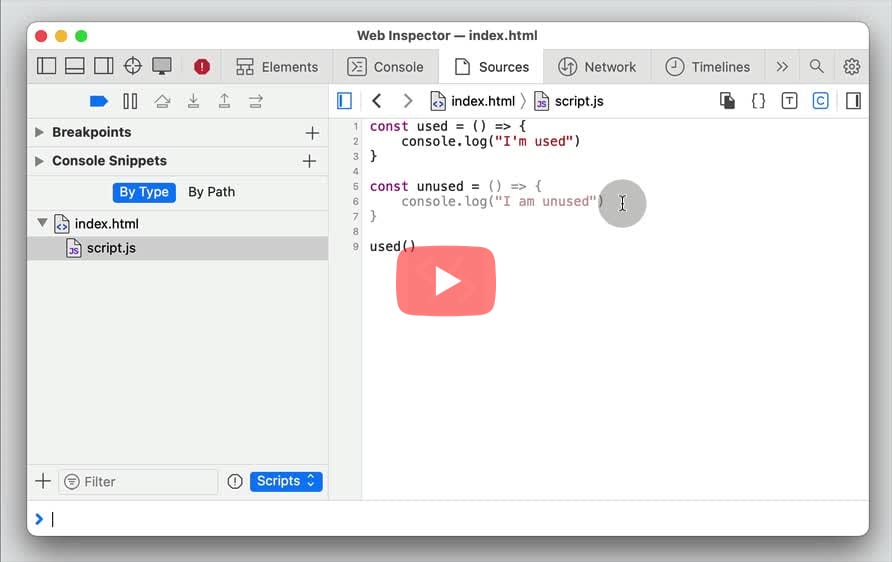
- In the Sources panel, open the JS file from the left sidebar. Click the "C" icon in the toolbar (top-right) to fade unexecuted code.
- Reload the page to fade unexecuted code.
Can I focus on form elements in the DOM?
- In the Elements panel, right click on the node and select "Focus".
Can I force the node to emulate a user action state like focus, hover etc?
- In the Elements panel, right click on the node > Force state > Select from
:hover,:active,:focus,:visitedetc.
Can I fuzzy autocomplete CSS properties?
- Safari allows you to autocomplete CSS properties with fuzzy matching like, entering
gtcwill suggestgrid-template-columnsin the suggestions box.
Can I get a list of all the detached elements to investigate memory leaks?
Edge:
- Open Command Menu and Run Show Detached Elements. Click the Get detached elements button to list all of the currently detached elements.
- Click the Analyze button to take a memory heap snapshot. Once done, you can then double-click any of the detached elements' Ids to find the link between these elements and your JavaScript code in the Memory panel.
- Don't forget to click the Collect garbage button every once in a while to force garbage collection. Then get the detached elements again. Indeed, some elements may remain in memory simply because the browser hasn't yet cleaned them up. Forcing GC makes sure the list only contains the elements that are detached and cannot be cleaned up.
Can I get all the event listeners on a web page?
$$("*")
  .map(node => ({
    node,
    listeners: getEventListeners(node)
  }))
  .filter(obj => Object.keys(obj.listeners).length);
Edge:
$$("*")
  .map(node => ({
    node,
    listeners: getEventListeners(node)
  }))
  .filter(obj => Object.keys(obj.listeners).length);
$$("*")
  .map(node => ({
    node,
    listeners: getEventListeners(node)
  }))
  .filter(obj => Object.keys(obj.listeners).length);
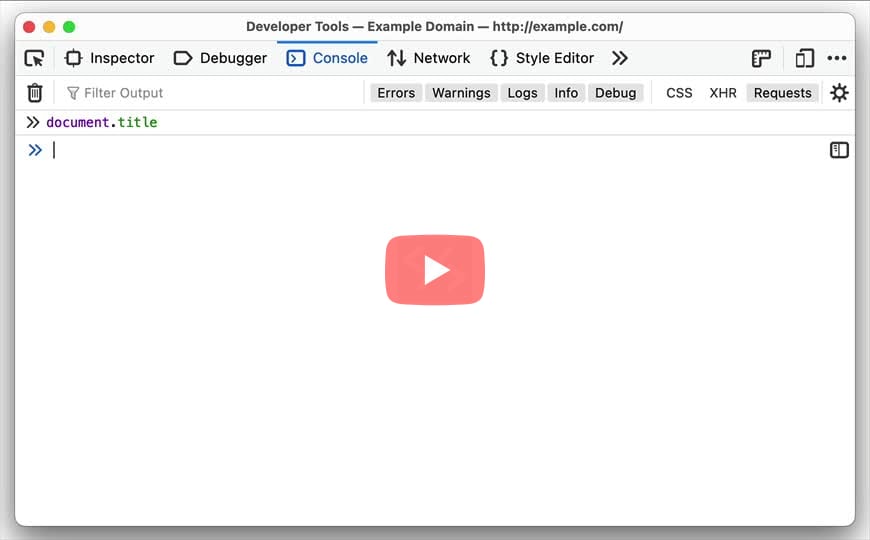
Can I get the last evaluated value in the console?
$_returns the value of the most recently evaluated expression.
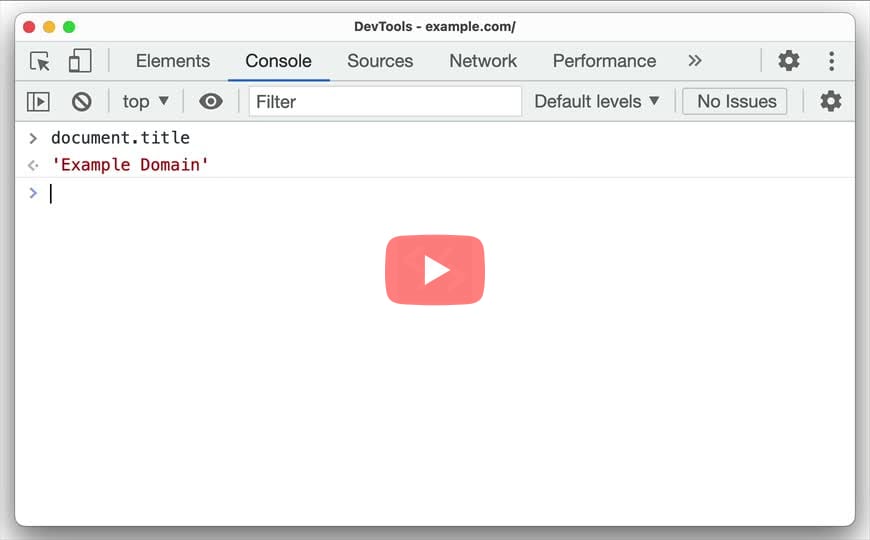
$_returns the value of the most recently evaluated expression.
Edge:
$_returns the value of the most recently evaluated expression.
$_returns the value of the most recently evaluated expression.- Additionally, Safari also lets you access past values in chronological order, using
$1, $2, $3, ...
$_returns the value of the most recently evaluated expression.
Can I get the xpath of a node in the DOM tree?
- Inspect the element > Right click on the node in the DOM tree > Copy > Copy full XPath
- Inspect element > Right click on the node in the DOM tree > Copy > XPath
Edge:
- Inspect element > Right click on the node in the DOM tree > Copy > Copy full XPath
- Inspect element > Right click on the node in the DOM tree > Copy > XPath.
Polypane: In the Elements panel, click the "Copy" icon in the navigator, then select "Copy Xpath"
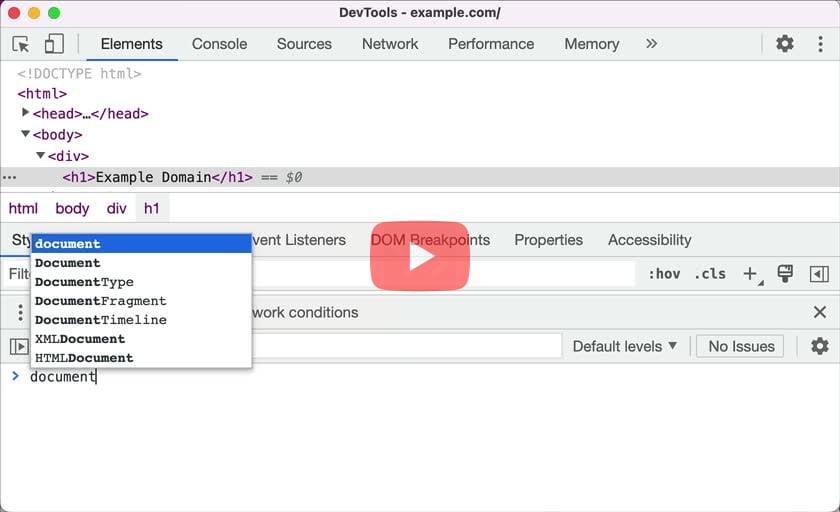
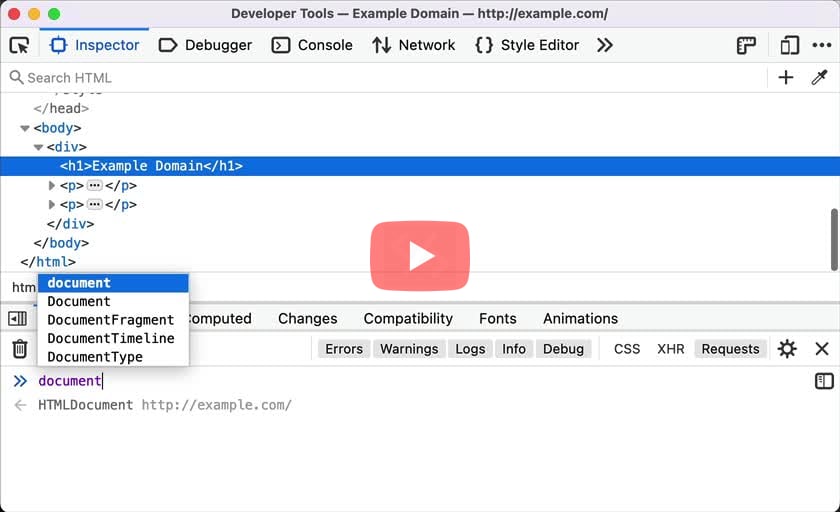
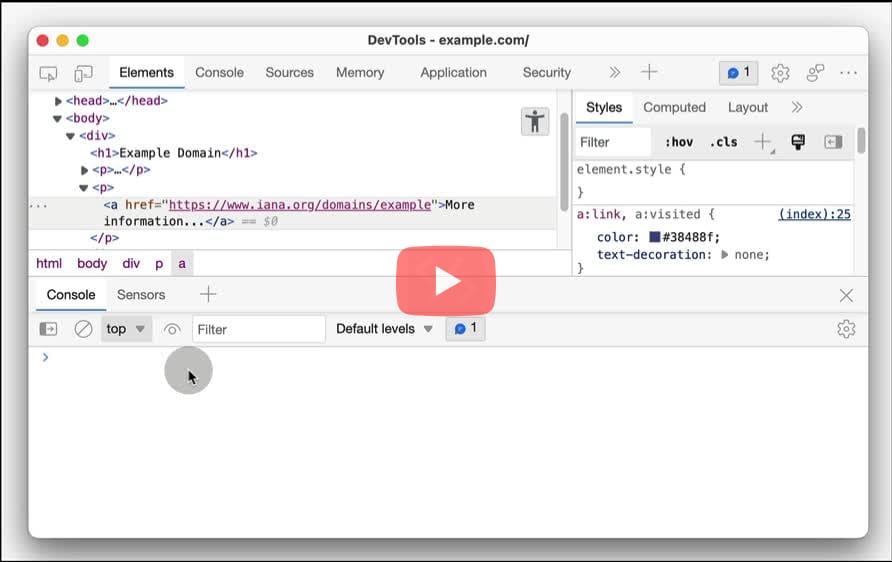
Can I refer the currently selected node in the DOM tree from the console?
- Use
$0to access the currently selected node. Additionally,$1,$2,$3, ... will give you the last selected nodes in the reverse chronological order.
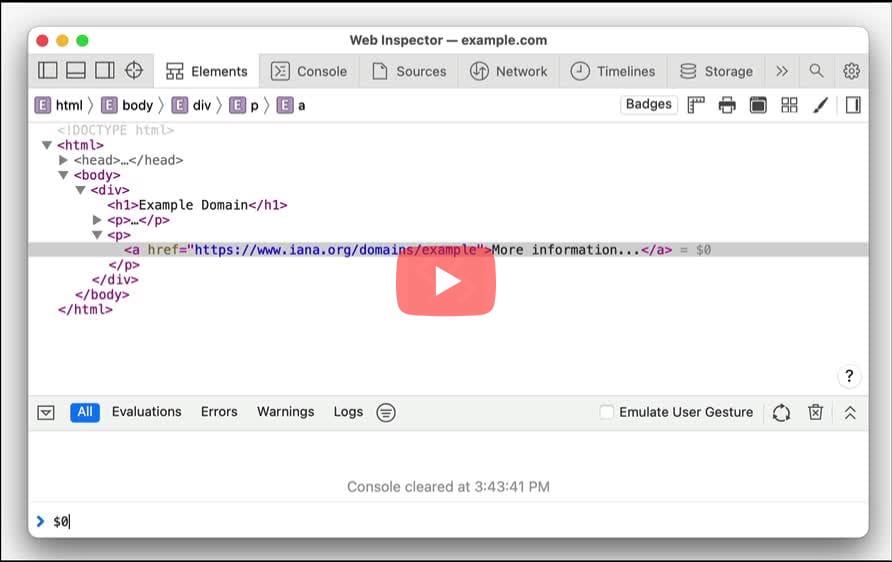
- Use
$0to access the currently selected node.
Edge:
- Use
$0to access the currently selected node. Additionally,$1,$2,$3, ... will give you the last selected nodes in the reverse chronological order.
- Use
$0to access the currently selected node.
- Use
$0to access the currently selected node. Additionally,$1,$2,$3and$4will give you the last selected nodes in the reverse chronological order.
Can I get the viewport size?
- Open DevTools panel docked to the page. Resize the Devtools panel to view the current viewport size in top-right.
- Open DevTools and go to the Settings panel (F1).
- Under Available Toolbox Buttons, select the Toggle rulers for the page setting. The Toggle rulers for the page icon appears in the DevTools toolbar.
- Click the ruler icon to display rulers in the webpage. In addition to the top and left rulers which now are visible in the webpage, the viewport size is displayed in an overlay, in the top-right corner of the webpage.
Edge:
- Open DevTools panel docked to the page. Resize the Devtools panel to view the current viewport size in top-right.
- In Web Inspector, click the Show Rulers button to enable the ruler and viewport size on the page.
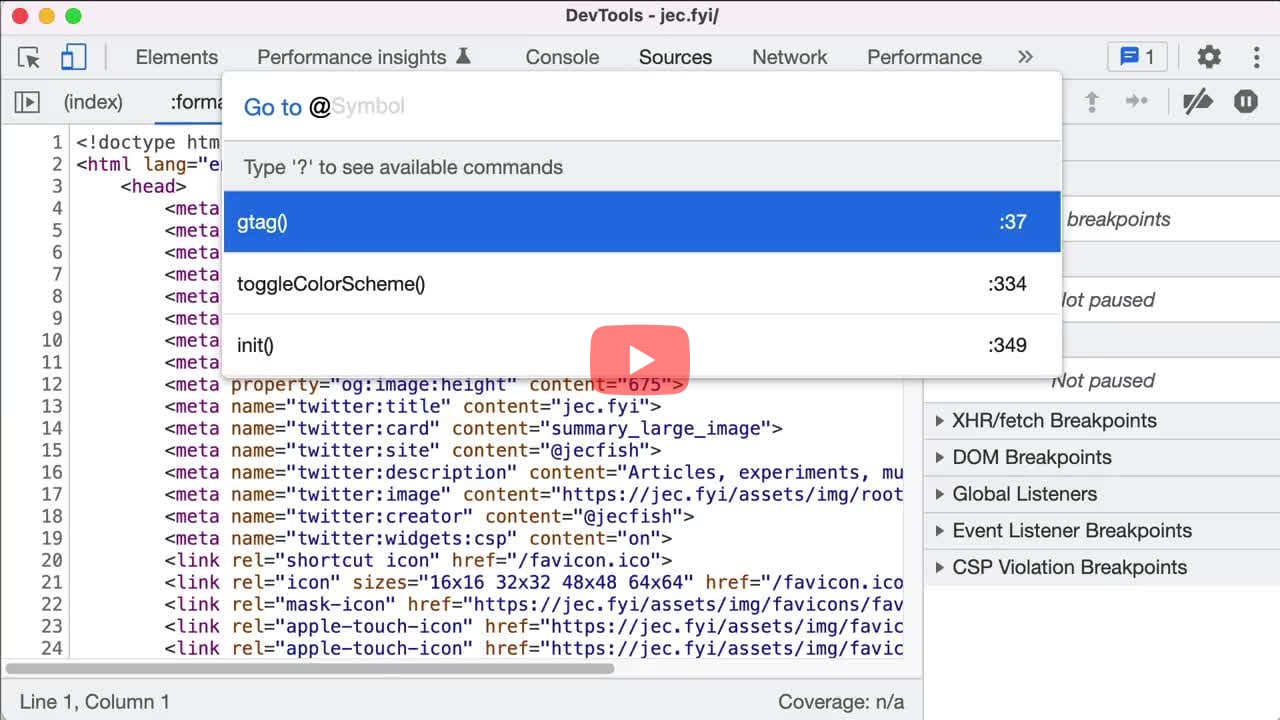
Can I jump to a file by searching with a filename?
- Run Command menu using
Cmd+Shift+P(on Mac) orCtrl+Shift+P(on Windows/Linux) > Type filename to filter on the matching files > PressEnter.
- In the Debugger tab, use
Cmd+PorCtrl+Pto open the search panel where you can type keyword to search for matching filenames. - Press
Enterto trigger the search.
Edge:
- Open devtools using
Cmd+Opt+I(on Mac) orCtrl+Shift+I(on Windows/Linux) > Sources. - Run Command menu using
Cmd+Shift+P(on Mac) orCtrl+Shift+P(on Windows/Linux) > Type filename to filter on the matching files > PressEnter.
- Anywhere in the web inspector, press
Cmd+Pto search for files matching the filename.
Can I hide network requests sent by extensions?
- In the Network panel, check the Hide extension URLs option in the toolbar.
Can I ignore extention scripts while debugging?
- Open Settings (
F1) > Ignore List > Disable "Content scripts injected by extensions".
Can I ignore scripts while debugging?
- In Sources > Open Page (left sidebar) > Right click on the script to be ignored and select "Add script to ignore list". Debugger will omit this script from the call stack and gray out in the file tree.
- Alternatively, you can also add a script to the ignore list from the Call Stack pane by using the same option from the right click menu.
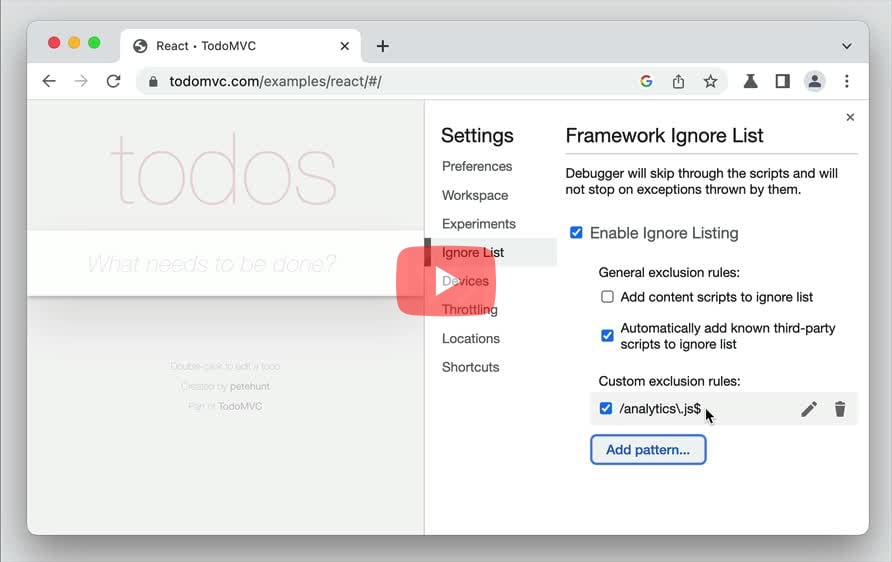
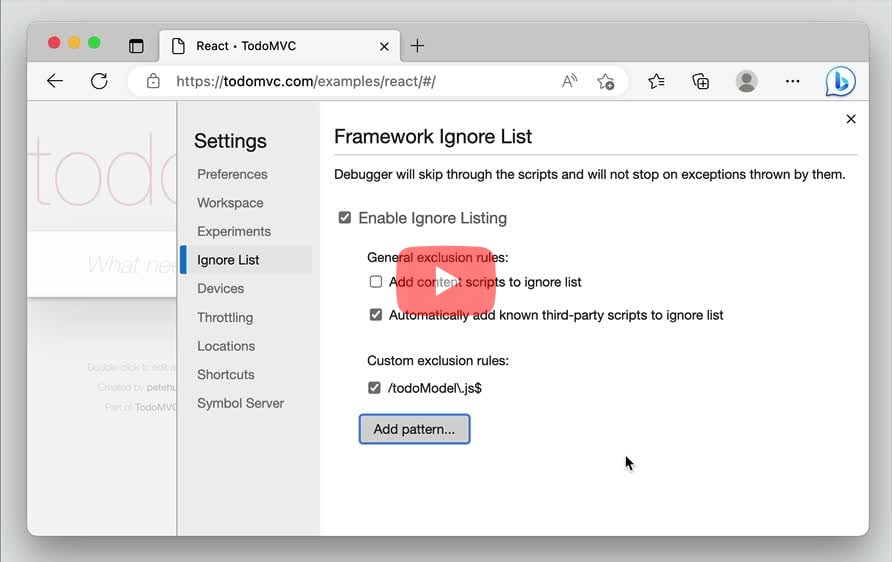
- To ignore multiple scripts using a pattern, open Settings (
F1) > Ignore List > Enable Ignore Listing. Click the "Add Pattern" button and enter the regex pattern matching the scripts to be ignored. - All the ignored scripts will be available under Custom exclusion rules section in Ignore List.
- In the Debugger panel, right click on the filename in the source list pane, and select "Ignore source" or ("Unignore source").
- If the source file is displayed in the source pane, click the "crossed out source" icon at the bottom to ignore the script.
Edge:
- In Sources > Open Page (left sidebar) > Right click on the script to be ignored and select "Add script to ignore list". Debugger will omit this script from the call stack and gray out in the file tree.
- Alternatively, you can also add a script to the ignore list from the Call Stack pane by using the same option from the right click menu.
- To ignore multiple scripts using a pattern, open Settings (
F1) > Ignore List > Enable Ignore Listing. Click the "Add Pattern" button and enter the regex pattern matching the scripts to be ignored. - All the ignored scripts will be available under Custom exclusion rules section in Ignore List.
- In the Sources panel, right click on any script and select Blackbox script or click the eye icon next to the script name in the source tree.
- To ignore multiple scripts with a pattern, go to Settings > Blackbox > Enter the regex pattern to ignore scripts in bulk.
Can I ignore third-party scripts while debugging?
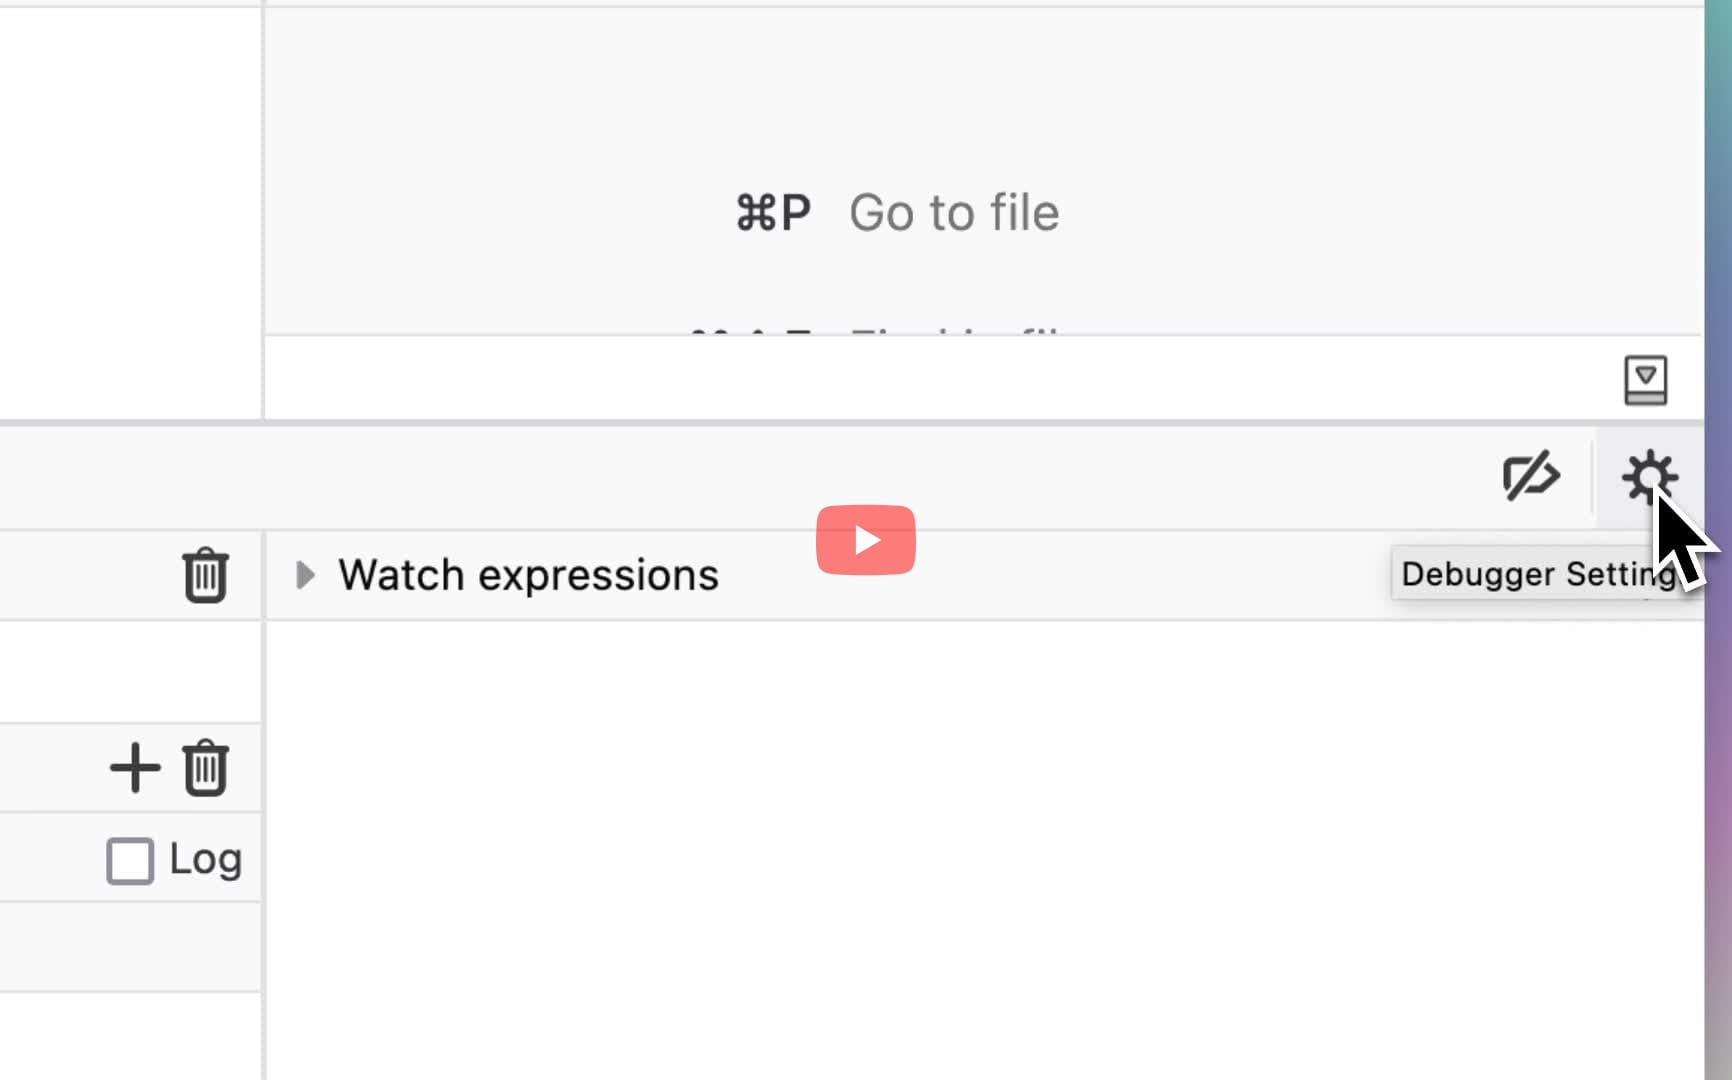
- In the Debugger panel, open Debugger Settings and select Ignore Known Third-partyScripts to ignore the third-party scripts defined in the ignoreList sourcemaps extension.
Can I import and export network activity to a HAR file?
- In the Network panel, use the Up (↑) and Down (↓) arrow buttons in the toolbar to Import and Export all the network activity into a HAR file.
- In the Network panel, click the Gear icon to open the Network Settings.
- Click "Save All As HAR" to export the HAR file and "Import HAR File" to import the HAR file.
Edge:
- In the Network panel, use the Up (↑) and Down (↓) arrow buttons in the toolbar to Import and Export all the network activity into a HAR file.
- In the Network panel, use the Import & Export buttons to import and export HAR file respectively.
Can I import source maps manually to debug production code?
- In the Sources panel, open the script, right click in the Editor, and select Add source map... from the menu.
- Enter the source map URL, click Add. On successful addition, the source map will appear in the Developer Resources drawer and the editor status bar.
Edge:
- In the Sources panel, open the script, right click in the Editor, and select Add source map... from the menu.
- Enter the source map URL, click Add. On successful addition, the source map will appear in the Developer Resources drawer and the editor status bar.
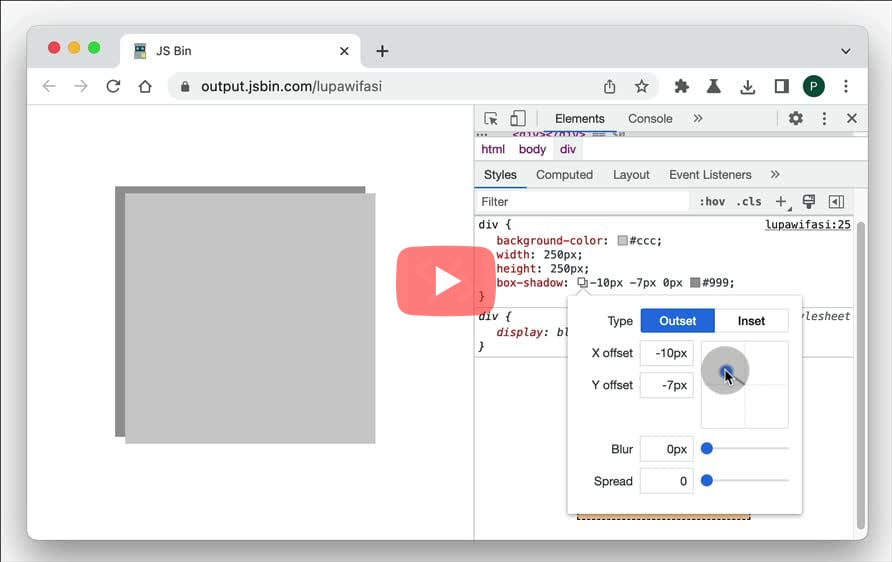
Can I inspect CSS box shadow using an editor?
- Inspect the element with box shadow > In the Styles pane, click the icon next to the
box-shadowproperty to open the box shadow editor. - Change the shadow properties:
- Type (only for
box-shadow). Pick Outset or Inset. - X and Y offsets. Drag the blue dot or specify values.
- Blur. Drag the slider or specify a value.
- Spread (only for
box-shadow). Drag the slider or specify a value.
- Type (only for
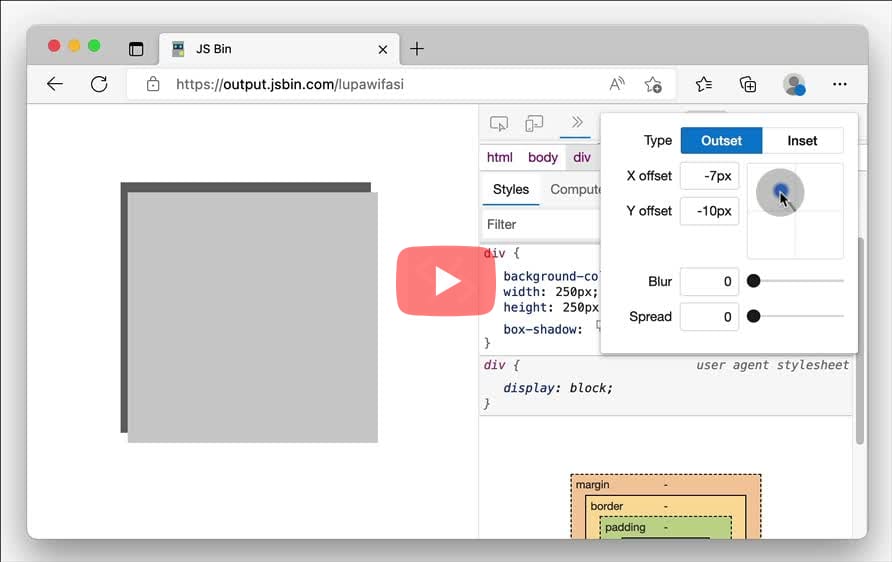
Edge:
- Inspect the element with box shadow > In the Styles pane, click the icon next to the
box-shadowproperty to open the box shadow editor. - Change the shadow properties:
- Type (only for
box-shadow). Pick Outset or Inset. - X and Y offsets. Drag the blue dot or specify values.
- Blur. Drag the slider or specify a value.
- Spread (only for
box-shadow). Drag the slider or specify a value.
- Type (only for
- Inspect Element with
box-shadowproperty applied. Click the square icon before the box shadow value to open the box shadow editor. - In the editor, you can change the Offset X/Y, Inset, Blur, Spread and Color properties of the box shadow
Can I inspect and debug container queries in the devtools?
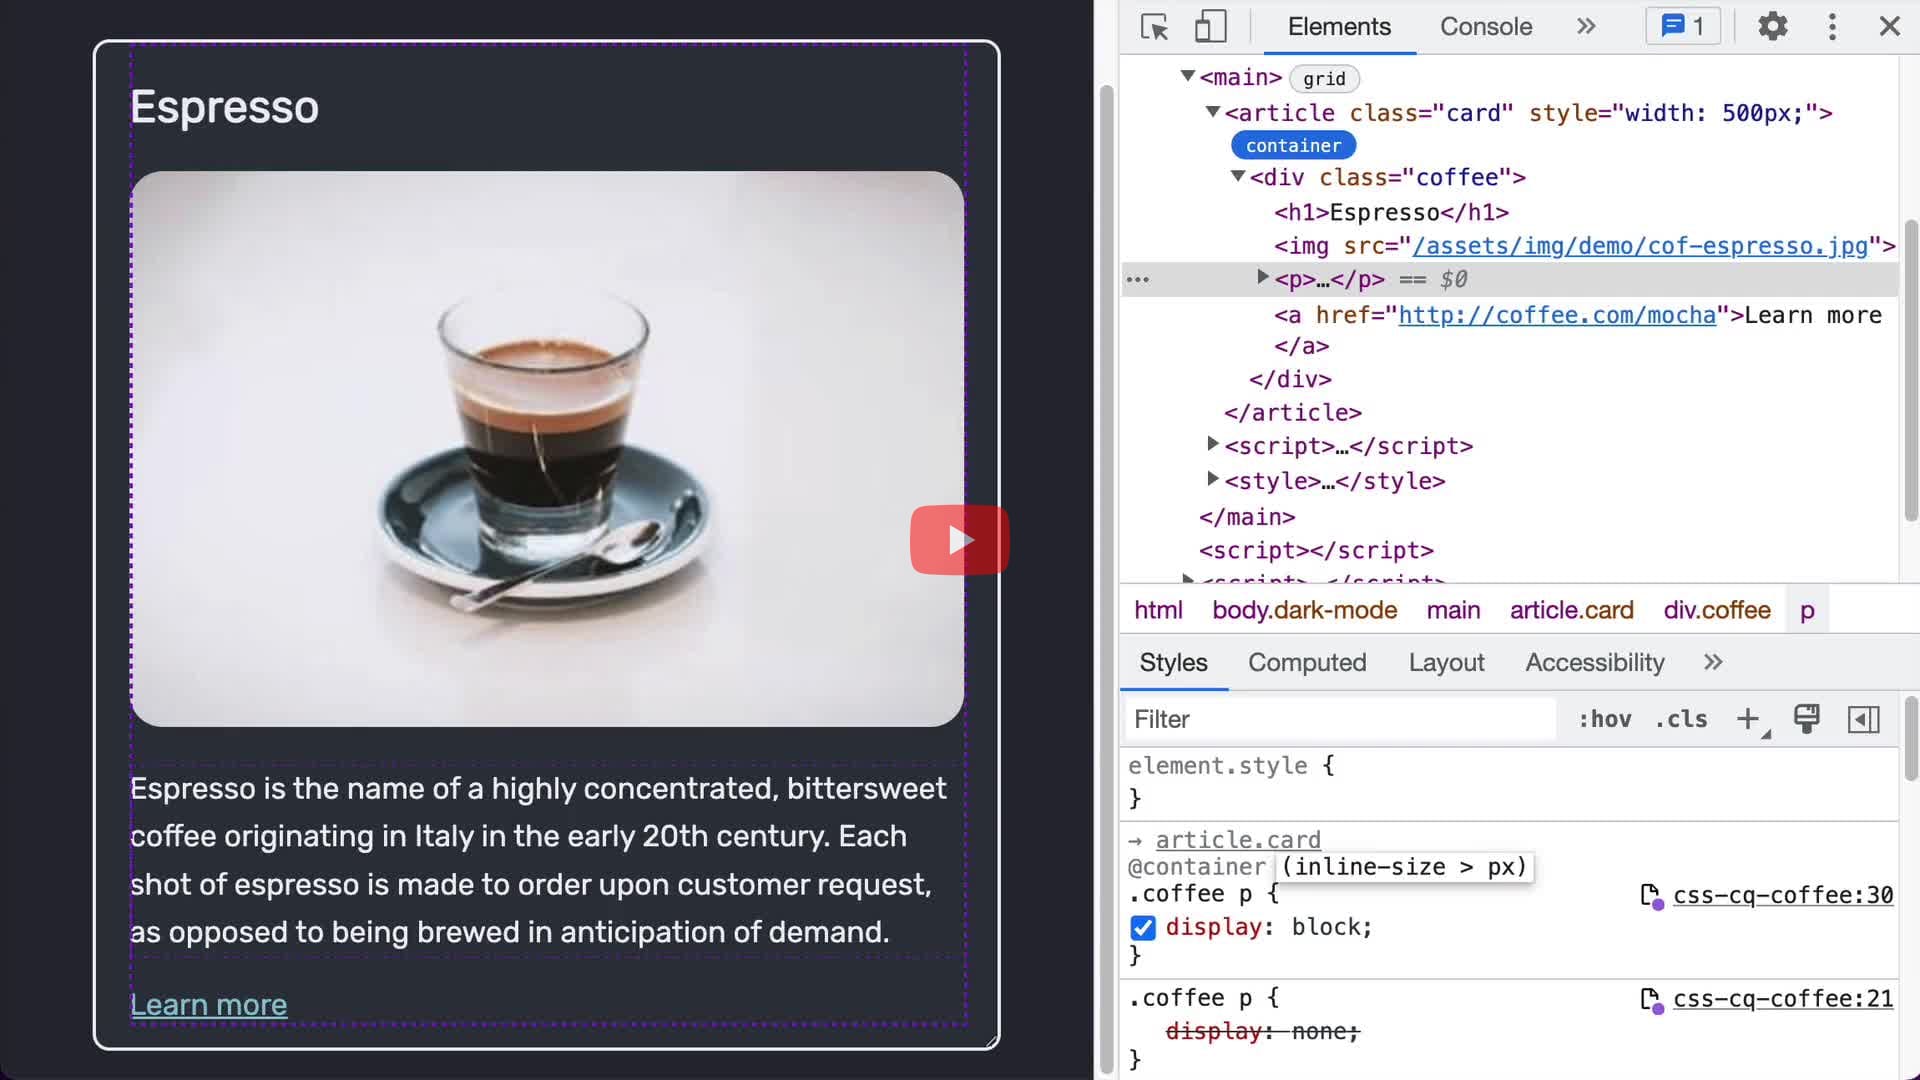
- Every element defined as a query container has a
containerbadge next to it in the Elements panel. The badge toggles a dotted-line overlay of the container and its descendants. - To find and select a container element that caused the query to take effect, hover over and click the element name above the
@containerdeclaration. - When hovered over, the name turns into a link to the element in the Elements panel and the Styles pane displays the queried property and its current value.
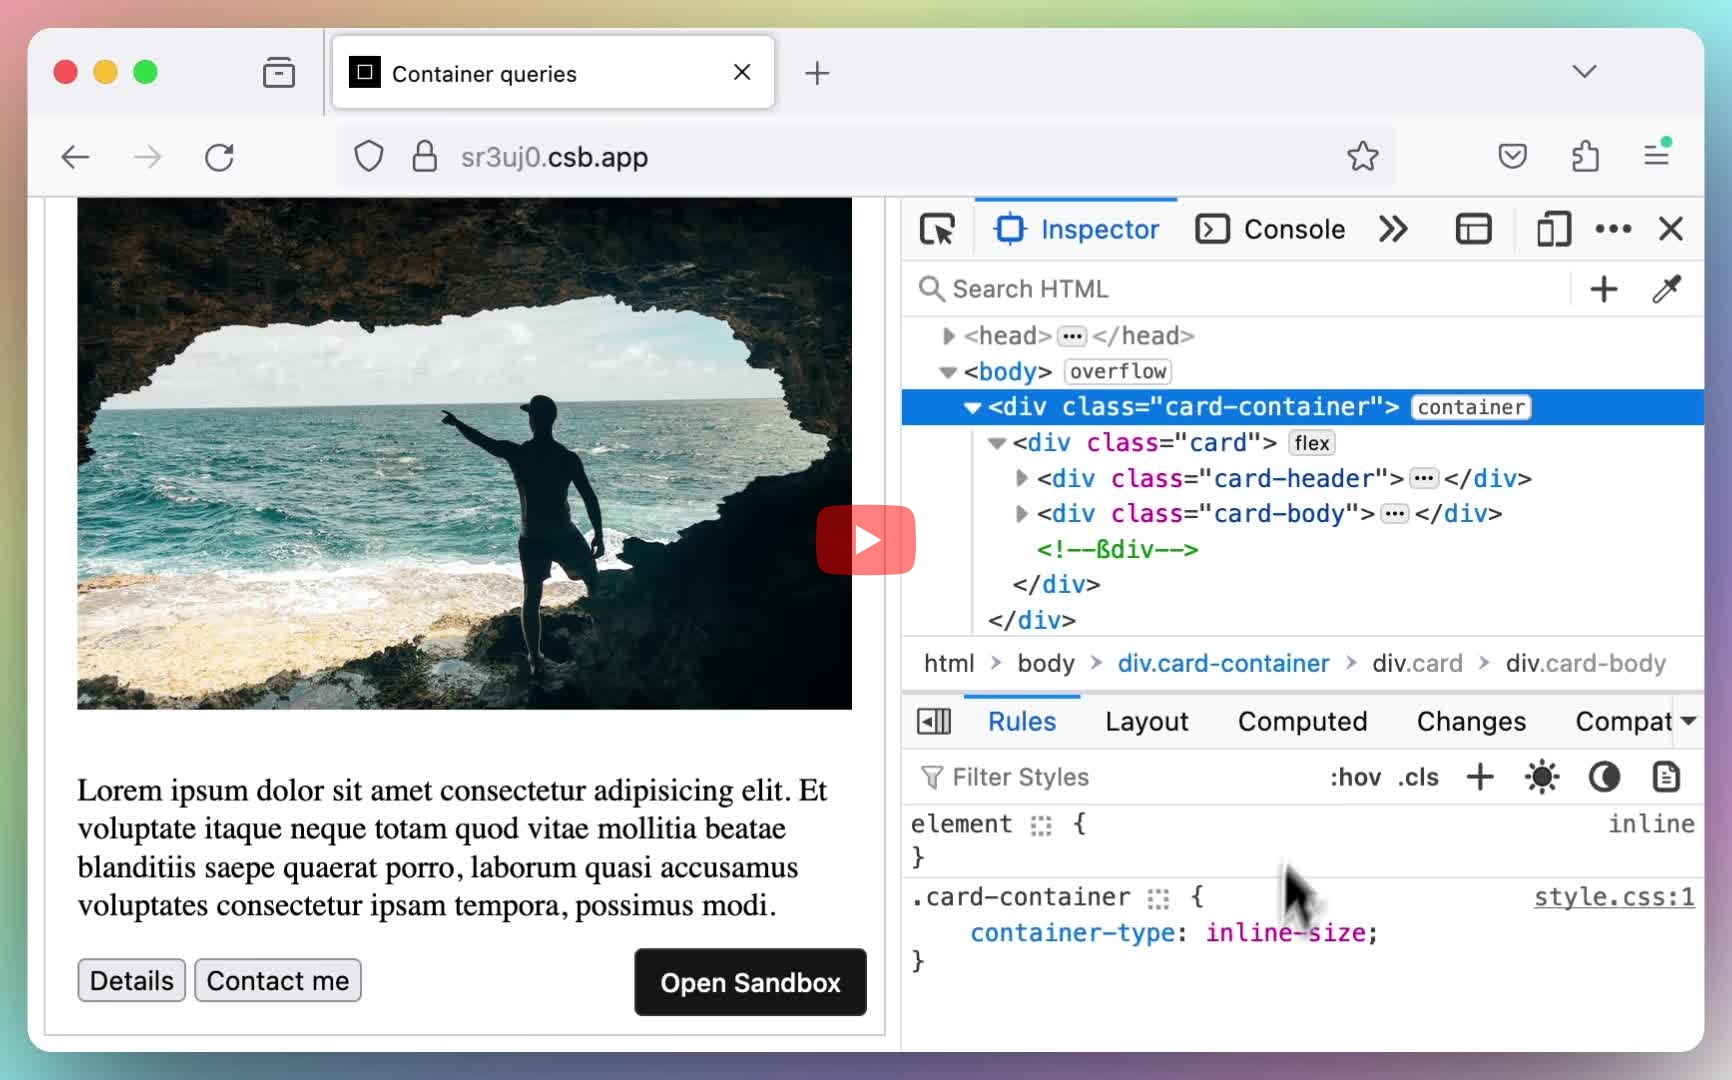
- Elements with
container-typeasinline-sizeorsizeare decorated with the container badge in the Inspector panel. - In the Rules view,
@containerdeclaration is underlined, on hover displays the container element. Click the crosshair icon to jump to the element in the Element tree.
- Inspect the element with
container-typeproperty. All the child elements using the Container query will have the@containerdecorator on top of the selector, which can be edited to affect the size of the container.
- Inspect the element with
container-typeproperty. All the child elements using the Container query will have the@containerdecorator on top of the selector.
Can I inspect & tweak the CSS angle unit values applied to a property?
- Inspect the element using CSS angle unit values > Styles > Click the icon next to the angle unit to open a visual editor to apply the angle value.
Edge:
- Inspect the element using CSS angle unit values > Styles > Click the icon next to the angle unit to open a visual editor to apply the angle value.
Can I inspect CSS animations & keyframes using the devtools?
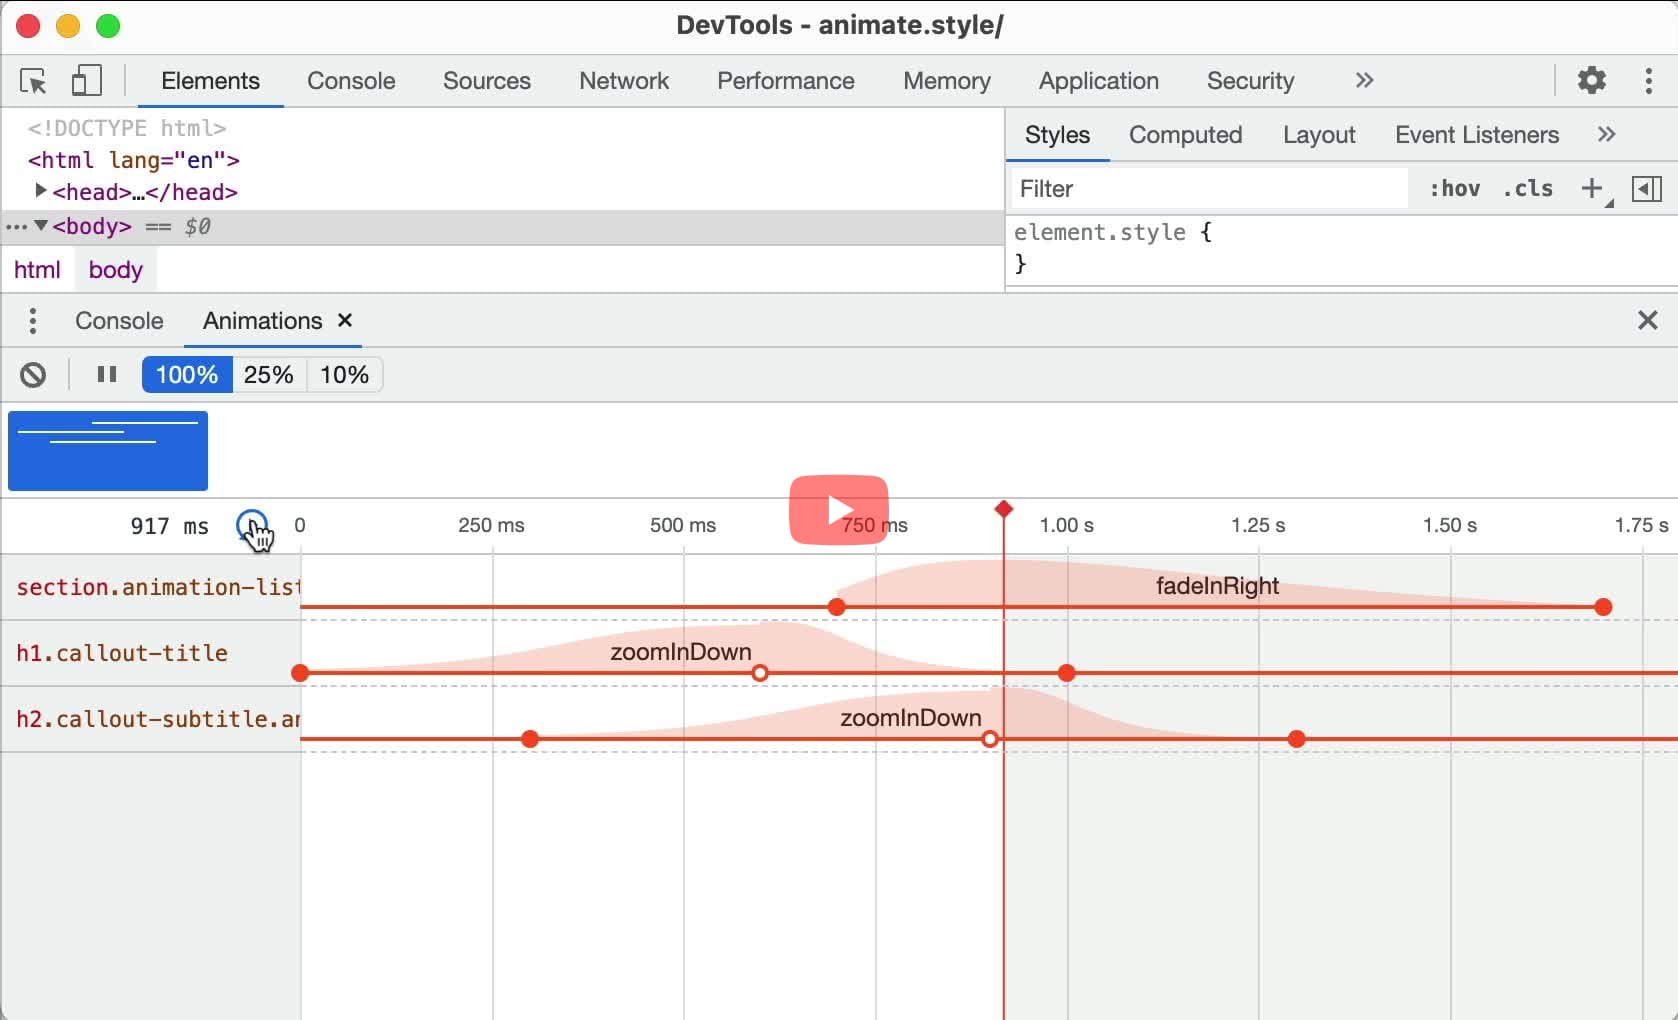
- Open Command Menu (
Cmd+Shift+PorCtrl+Shift+P) > Run "Show Animations" and pressEnter. - Trigger the animation to record it on the timeline. Now you can use the buttons in the Controls section to adjust the replay speed of the animation.
- Use the Timeline section to scrub the animation or jump to a specific point in animation. Use the Details section modify the timing & the delay of the animation.
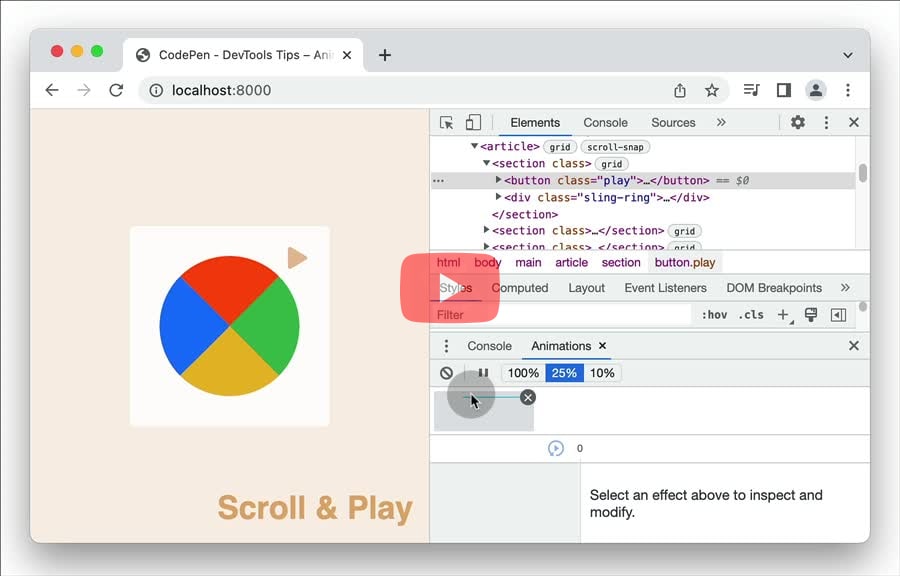
- Inspect the element which uses CSS animation. Click on the Animations pane next to the DOM tree in the side panel.
Edge:
- Open Command Menu (
Cmd+Shift+PorCtrl+Shift+P) > Run "Show Animations" and pressEnter. - Trigger the animation to record it on the timeline. Now you can use the buttons in the Controls section to adjust the replay speed of the animation.
- Use the Timeline section to scrub the animation or jump to a specific point in animation. Use the Details section modify the timing & the delay of the animation.
- Open devtools > Open the "Timelines" tab > Ensure that "Media and Animations" is enabled in the left panel.
- Now reload the page or trigger the animation to see the timeline in the bottom panel.
Can I inspect the @property CSS at-rules applied to an element?
- To inspect your registered custom properties, in Elements > Styles, hover over the property name and see its descriptors in a tooltip. In the tooltip, click the link to view the registered property in the collapsible @property section.
Can I inspect CSS filters using an editor in devtools?
- In Rules > identify the filter property and click the swatch icon next to the filter value.
- Use the editor to add, modify or remove filter functions, reorder and create presets to reuse later.
Can I inspect CSS flexbox?
- When an HTML element on your page has
display: flexordisplay: inline-flexapplied to it, you can see aflexbadge next to it in the Elements panel. - In the Styles pane, you can see the flexbox editor button next to the
display: flexdeclaration. - Click on it to open the flexbox editor. The editor displays a list of flexbox properties. Each property's value options are displayed as icon buttons.
- When an HTML element on your page has display: flex applied to it, a number of features are made available in the DevTools to provide easy access to Flexbox layout features.
- In the CSS pane’s Rules view, any instance of a display: flex declaration gets a small Flexbox icon next to the word
flex. Clicking the icon toggles the display of an overlay on the page, which appears over the selected flex container that displays an outline around each flex item: - The flex items within the flex container are displayed as a numbered list in the Flex Items section. Each entry displays the item’s selector. Hover over an element to highlight it on the page. If you click on the item, the display shifts to show details about that element.
Edge:
- When an HTML element on your page has
display: flexordisplay: inline-flexapplied to it, you can see aflexbadge next to it in the Elements panel. - In the Styles pane, you can see the flexbox editor button next to the
display: flexdeclaration. - Click on it to open the flexbox editor. The editor displays a list of flexbox properties. Each property's value options are displayed as icon buttons.
- In the Elements tab, select the node with label "flex" from the DOM tree.
- From the right sidebar, select "Layout", and scroll down to the Flexbox section, that has few page overlay options to help visualize and debug flexbox containers.
Can I inspect CSS grid?
- When an HTML element on your page has
display: gridordisplay: inline-gridapplied to it, you can see agridbadge next to it in the Elements panel. - Clicking the badge to toggle the display of a grid overlay on the page. The overlay appears over the element, laid out like a grid to show the position of its grid lines and tracks.
- Open the Layout pane. When grids are included on a page, the Layout pane includes a Grid section containing a number of options for viewing those grids[1]
- When an HTML element on your page has
display: gridordisplay: inline-gridapplied to it, you can see agridbadge next to it in the Elements panel. - Clicking the badge to toggle the display of a grid overlay on the page. The overlay appears over the element, laid out like a grid to show the position of its grid lines and tracks.
- Open the Layout pane. When grids are included on a page, the Layout pane includes a Grid section containing a number of options for viewing those grids.
Edge:
- When an HTML element on your page has
display: gridordisplay: inline-gridapplied to it, you can see agridbadge next to it in the Elements panel. - Clicking the badge to toggle the display of a grid overlay on the page. The overlay appears over the element, laid out like a grid to show the position of its grid lines and tracks.
- Open the Layout pane. When grids are included on a page, the Layout pane includes a Grid section containing a number of options for viewing those grids.
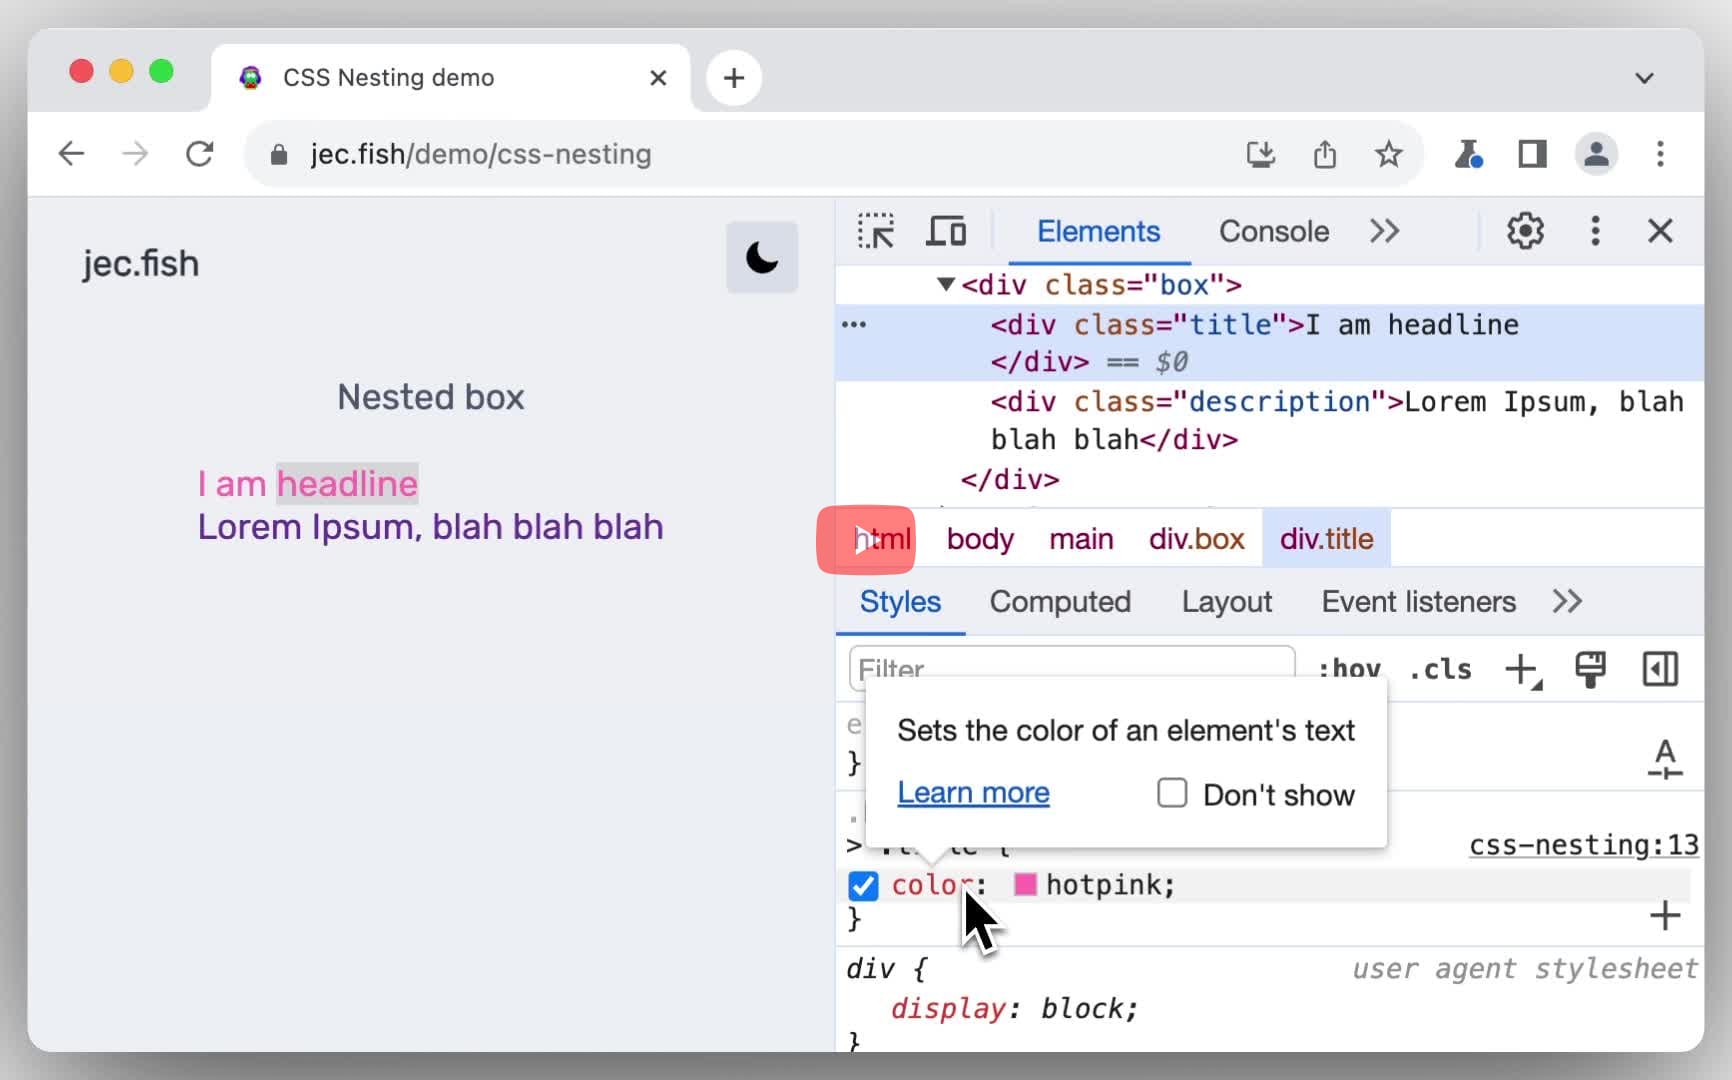
Can I inspect CSS nesting rules applied to an element?
- Inspect the element that has CSS nesting rules applied. Nesting rules are available in the Styles pane to view and edit.
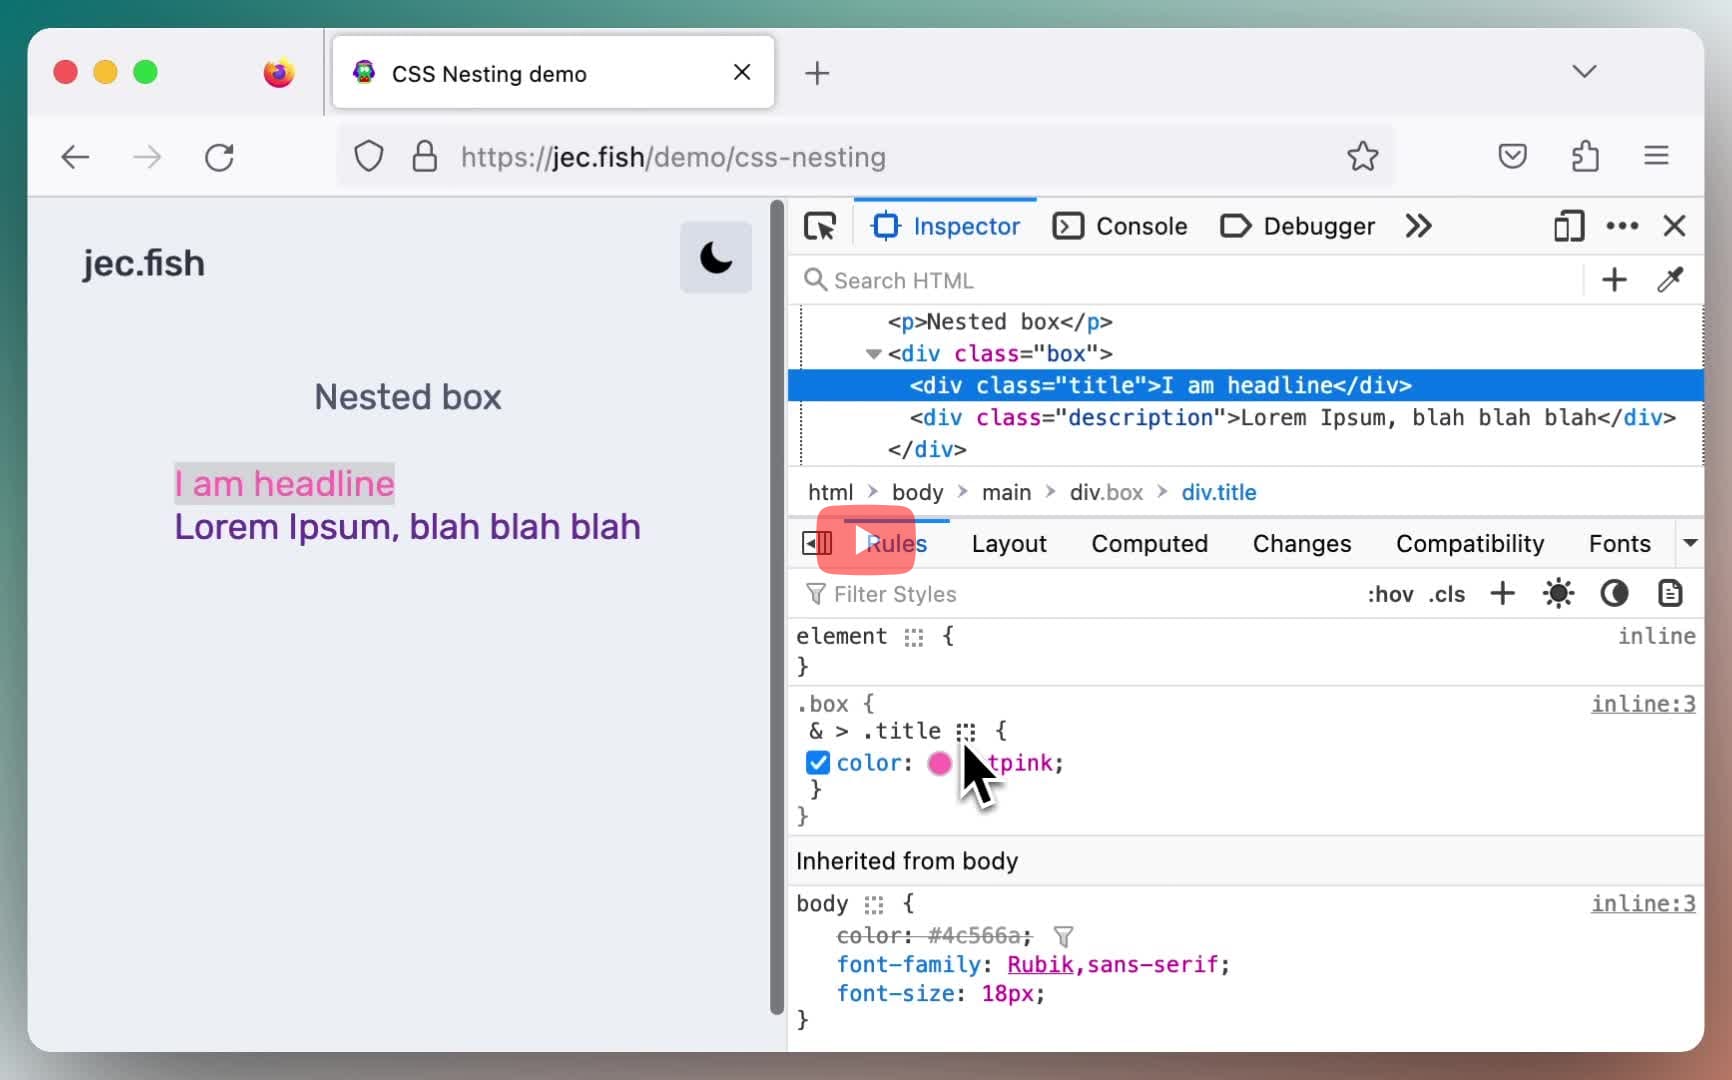
- Inspect the element that has CSS nesting rules applied. Nesting rules are available in the Rules pane to view and edit.
Edge:
- Inspect the element that has CSS nesting rules applied. Nesting rules are available in the Styles pane to view and edit.
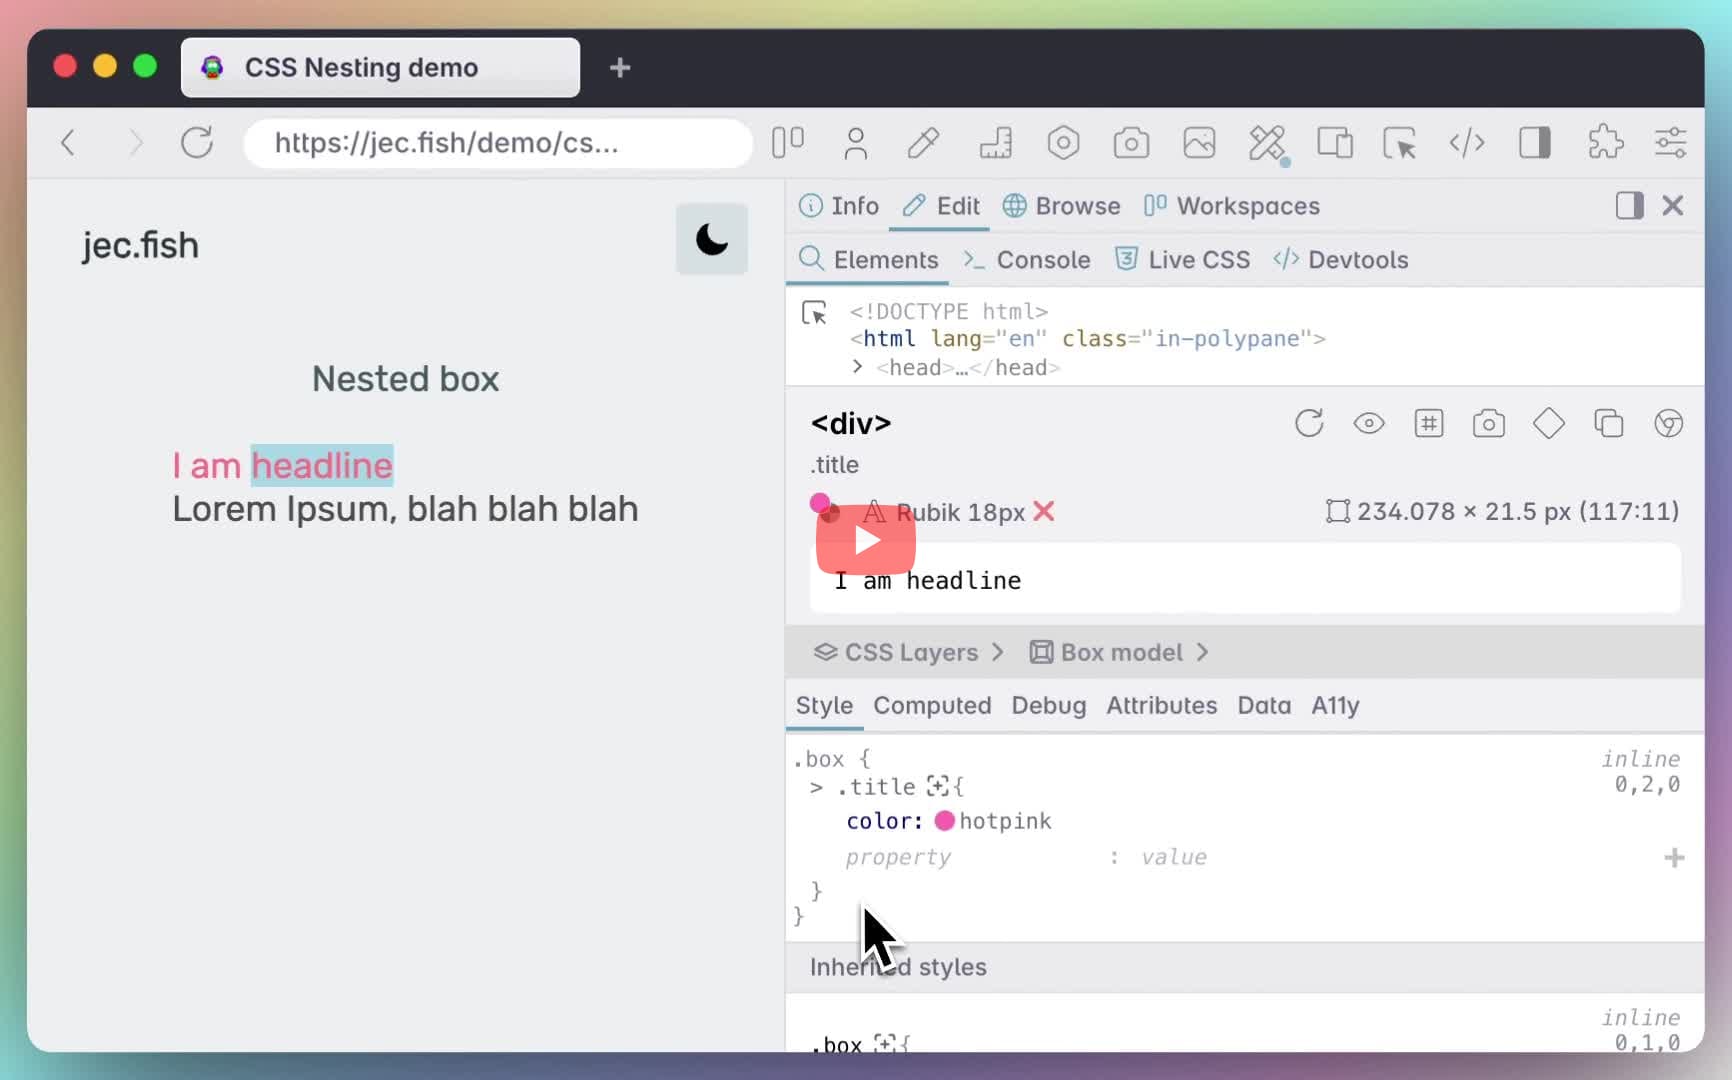
- Inspect the element that has CSS nesting rules applied. Nesting rules are available in the Style pane to view and edit.
Can I inspect & edit the absolutely positioned elements visually?
- Inspect element with
position:relativeorposition:absoluteapplied to it in the Inspector panel. - Open the Layout sidebar panel, and scroll down to the Box Model section.
- Find the "Edit Position" icon and click it.
- Use the handles in the page to move the element around, within its positioned ancestor.
Can I inspect CSS shapes properties like clip-path, shape-outside, etc?
- Inspect the element with CSS shape properties like
clip-path&shape-outside> Rules > Click the "shape" icon next to the value to open the Shape Path Editor tool. - Click & Drag the control points highlighted on the shape to modify the shape.
Can I inspect specificity of a CSS selector?
- In Elements > Styles pane, hover over the selector name to see the specificity in a tooltip.
- Inspect element > In the Styles pane, hover over the selector to reveal a tooltip displaying the specificity of that selector.
- Inspect element (
Cmd+Shift+CorCtrl+Shift+C) > In the Style pane, the specificity is shown adjacent to the selector under the file name. - Click the specificity to open the CSS Specificity calculator in the Browse panel.
Can I inspect CSS subgrids?
- In Elements, nodes with
grid-template-columnsorgrid-template-rowsset assubgridshows a subgrid badge next to it. - Click the badge to inspect the nested grid and toggle an overlay that shows columns, rows, and track numbers on top of the element in the viewport.
Can I inspect CSS variables?
- In Styles pane, hover over the variable name to see the value in the tooltip. Click the link to jump to the section where the variable is defined.
Edge:
- In Styles pane, hover over the variable name to see the value in the tooltip. Click the link to jump to the section where the variable is defined.
Can I inspect the source code of a custom element?
- Open the Inspector panel. Custom elements are decorated with the
custombadge to make them easier to identify them in the Element tree. - Click the badge to directly jump to the JavaScript source code in the Debugger panel.
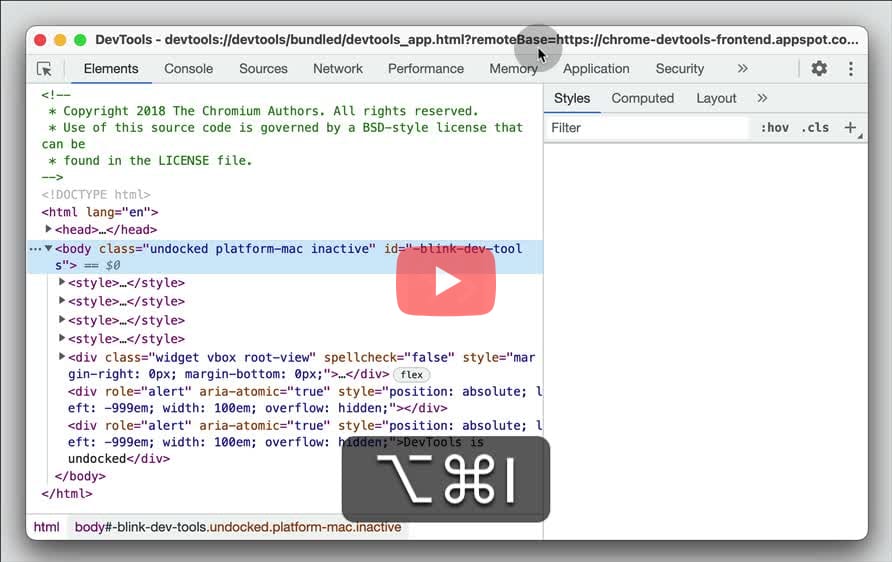
Can I inspect the browser's developer tool?
- Inside devtools, press
Cmd+Shift+IorCtrl+Shift+Ito inspect the devtools panel itself using new instance of devtools. - Important to note, you can keep using this shortcut to inspecting new instance of devtools recursively.
- Open Devtools Settings (
F1) > Under Advanced Settings, enable "Enable browser ... toolboxes" and "Enable remote debugging". - Open Firefox Menu (via hamburger icon) > More tools > Browser Toolbox. You’ll be able to inspect the browser’s chrome windows and see, and be able to debug, all the JavaScript files loaded by the browser itself and by any add-ons that are running.
Edge:
- Inside devtools, press
Cmd+Shift+IorCtrl+Shift+Ito inspect the devtools panel itself using new instance of devtools. - Important to note, you can keep using this shortcut to inspecting new instance of devtools recursively.
Can I inspect the network requests that were resolved with DoH (DNS over HTTPS)?
- In the Network panel, open the request to see the details in the side pane. In the Headers tab, verify that the DNS Resolution property has the value DNS over HTTPS.
Can I inspect the fetchpriority applied to the resources?
- In the Network panel, enable Big request rows from the network Settings. Right click on the any of the column headers, and select Priority from the menu.
- This will add a new column in the Network table indicating the
fetchpriorityfor each resource with values likeLow|High|Lowest|Highest.
- In the Network panel, right click on the any of the column headers, and select Priority from the menu. This will add a new column in the Network table indicating the
fetchpriorityfor each resource.
Edge:
- In the Network panel, enable Big request rows from the network Settings. Right click on the any of the column headers, and select Priority from the menu.
- This will add a new column in the Network table indicating the
fetchpriorityfor each resource with values likeLow|High|Lowest|Highest.
- In the Network panel, right click on the any of the column headers, and select Priority from the menu. This will add a new column in the Network table indicating the
fetchpriorityfor each resource.
Can I inspect and edit various CSS font properties like, font-size, line-height etc?
- Open Settings (
F1orShift+?) > Experiments > Check the "Enable the new Font Editor tool within the Styles pane" box > Reload. - In the Styles pane, click the "AA" icon in the bottom right of the selector box to open the Font Editor tool which allows you to tweak various font properties.
- Inspect the element using font properties > Navigate to the Fonts pane in the sidebar > Use the editor tool to tweak the various font properties.
Edge:
- Open Settings (
F1orShift+?) > Experiments > Check the "Enable the new Font Editor tool within the Styles pane" box > Reload. - In the Styles pane, click the "AA" icon in the bottom right of the selector box to open the Font Editor tool which allows you to tweak various font properties.
- Inspect element > Navigate to the Font panel to see information about the active font for the selected DOM node in the DOM Tree, providing computed values for both basic properties (e.g. size, style, weight, etc.) and advanced properties (e.g. ligatures, alternate glyphs, variations, etc.)
Can I inspect the localstorage of a website?
Can I inspect the popup overlay elements like the Dropdown lists, menus, etc.,
- Open the Command Menu (
Cmd+Shift+PorCtrl+Shift+P) > Run "Show Rendering" to open the Rendering drawer. - Scroll down and select Emulate a focused page option to inspect the popup element in DevTools.
Edge:
- Open the Command Menu (
Cmd+Shift+PorCtrl+Shift+P) > Run "Show Rendering" to open the Rendering drawer. - Scroll down and select Emulate a focused page option to inspect the popup element in DevTools.
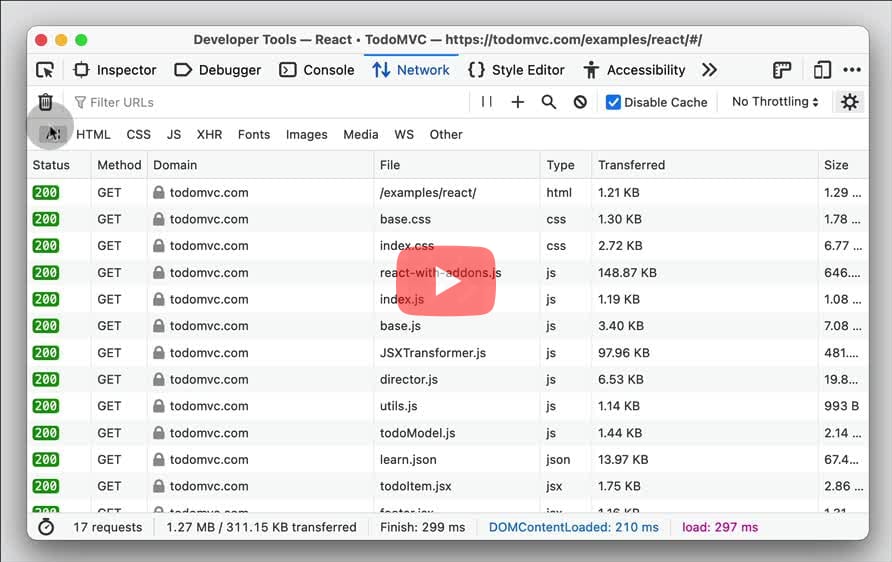
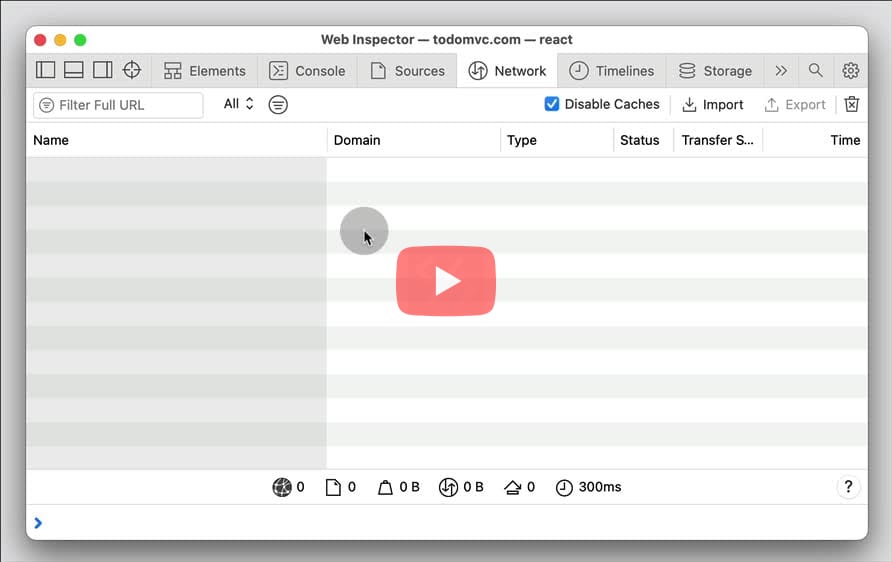
Can I inspect Network requests?
- Open devtools > Click on the Network panel (This will show a section containing table of network requests).
- Open devtools > Click on the Network panel (This will show a section containing table of network requests).
Edge:
- Open devtools > Click on the Network panel (This will show a section containing table of network requests).
- Open devtools > Click on the Network panel (This will show a section containing table of network requests).
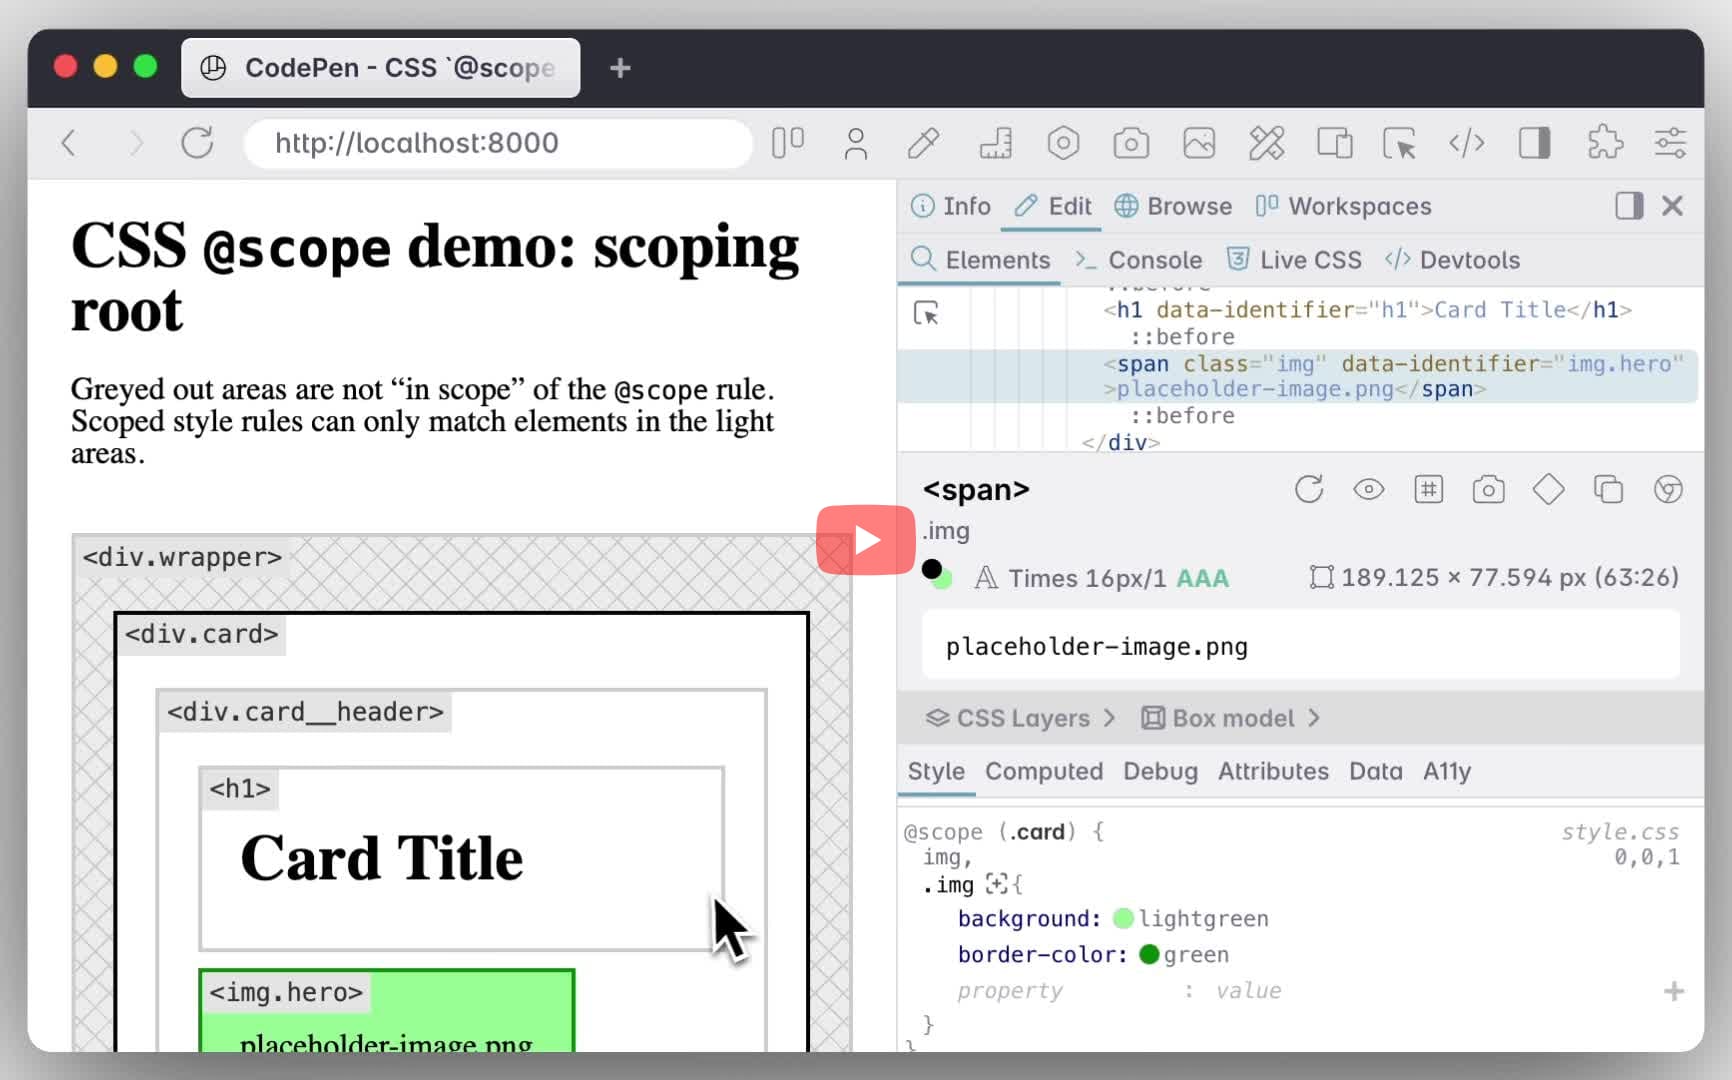
Can I inspect the CSS @scope at-rules and the scoping root element?
- Inspect the element that has
@scoperules applied. The ruleset will be visible in the Styles pane under the@scopeblock declaration.
Edge:
- Inspect the element that has
@scoperules applied. The ruleset will be visible in the Styles pane under the@scopeblock declaration.
- Inspect the element that has
@scoperules applied. The ruleset will be visible in the Style pane under the@scopeblock declaration. - Hover over the scoping root element to highlight the element on the page. Click the element to directly jump to the node in the Element tree.
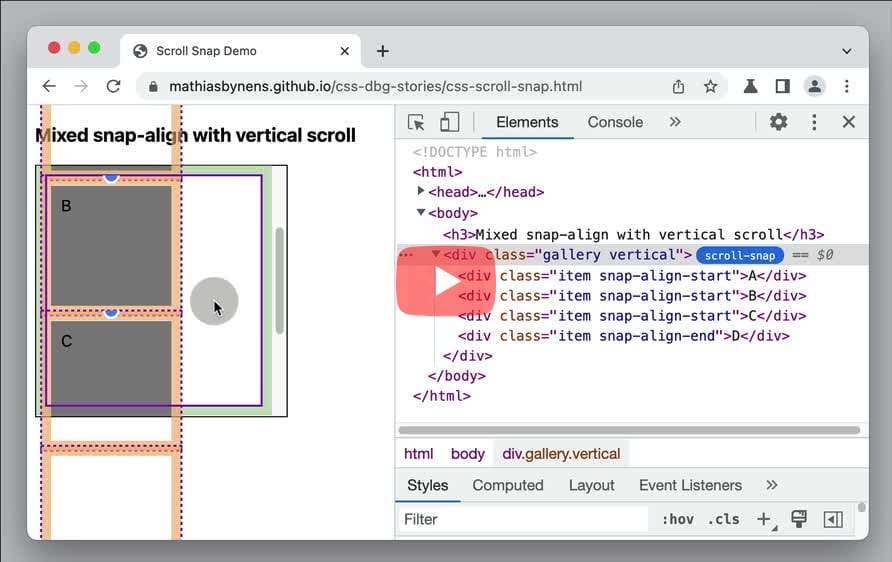
Can I inspect & visualize CSS scroll snap layout?
- When an HTML element on your page (e.g. this demo page) has
scroll-snap-typeapplied to it, you can see ascroll-snapbadge next to it in the Elements panel. Click the badge to toggle the display of a scroll-snap overlay on the page. - In the example above, you can see dot marks on snap edges. The scroll port has solid outlined while the snap items have dash outlines. The scroll padding is filled in green color while the scroll margin is filled in orange.
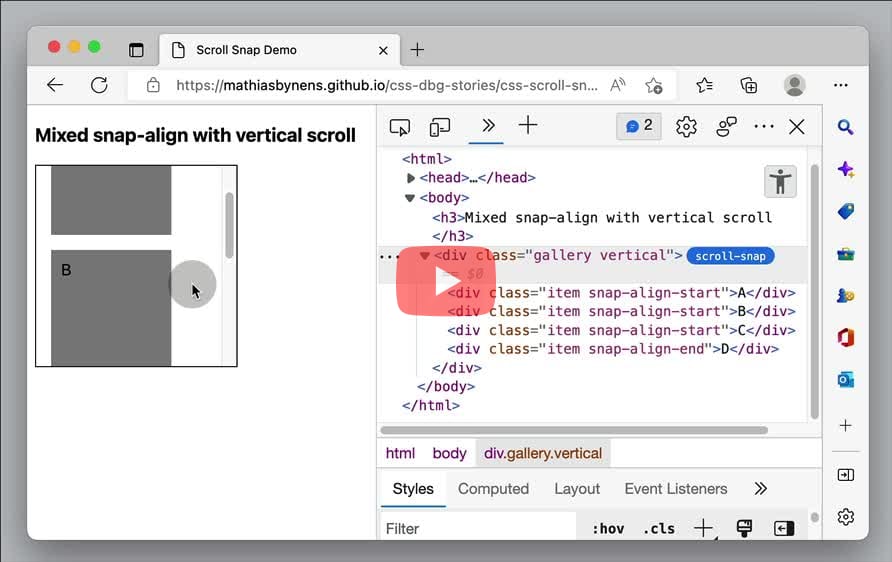
Edge:
- When an HTML element on your page (e.g. this demo page) has
scroll-snap-typeapplied to it, you can see ascroll-snapbadge next to it in the Elements panel. Click the badge to toggle the display of a scroll-snap overlay on the page. - In the example above, you can see dot marks on snap edges. The scroll port has solid outlined while the snap items have dash outlines. The scroll padding is filled in green color while the scroll margin is filled in orange.
Can I inspect the session storage of a website?
- In the Application panel, under the Storage section, expand Session storage from the left sidebar. Select the origin to view all the items stored in the session in a key-value format. Double-click the item to edit, right-click > Delete to remove the item from the session storage.
- In the Storage panel, expand Session Storage from the left sidebar. Select the host to view all the items stored in the session in a key-value format. Double-click the item to edit, + to add a new item and right-click > Delete to remove the item from the session storage.
Edge:
- In the Application panel, under the Storage section, expand Session storage from the left sidebar. Select the origin to view all the items stored in the session in a key-value format. Double-click the item to edit, right-click > Delete to remove the item from the session storage.
- In the Storage panel, under All Storage select Session Storage to view all the items stored in the session in a table. Double-click to edit the item, or click the trash icon to Clear Session Storage.
Can I inspect the shadow DOM of an element for a user-agent?
- Open Settings (
F1orShift+?) > Under the Elements section, enable Show user agent shadow DOM. - In the Elements panel, expand the node to inspect the shadow DOM available under shadow-root (user-agent).
Edge:
- Open Settings (
F1orShift+?) > Under the Elements section, enable Show user agent shadow DOM. - In the Elements panel, expand the node to inspect the shadow DOM available under shadow-root (user-agent).
- In the Elements panel, expand the element to reveal the Shadow root (user-agent) node, and its children, that were generated by the browser for this element.
Can I inspect the top layer elements like dialog, popover etc?
- Inspect the
<dialog>element. Scroll down to the end of the DOM tree to the#top-layersection, to visualise the currently active dialog elements. - In the case of multiple elements, they stack on top of each other, and the last one is on top.
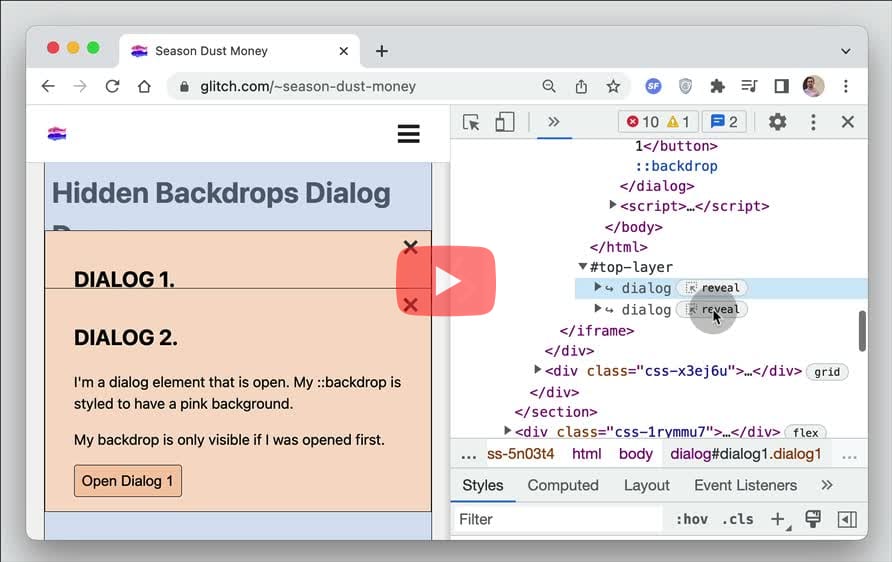
Can I inspect web vital statistics like CLS, LCP, FIP, etc.,
- Open App settings > Under the Settings tab, select Web Vitals Status. This will add a tiny icon in the bottom left of the page.
- Click the icon to open a popup containing the various web vital statistics like CLS, LCP, FIP, etc.,
- Click the eye icon to inspect the stats directly on the page.

Can I jump to the target element with an id from the source element?
- Firefox links the element referencing the ID attribute to its target element in the same DOM, highlighted with an underline.
- Use
Cmd+ClickorCtrl+Clickto jump to the target element with the identifier.
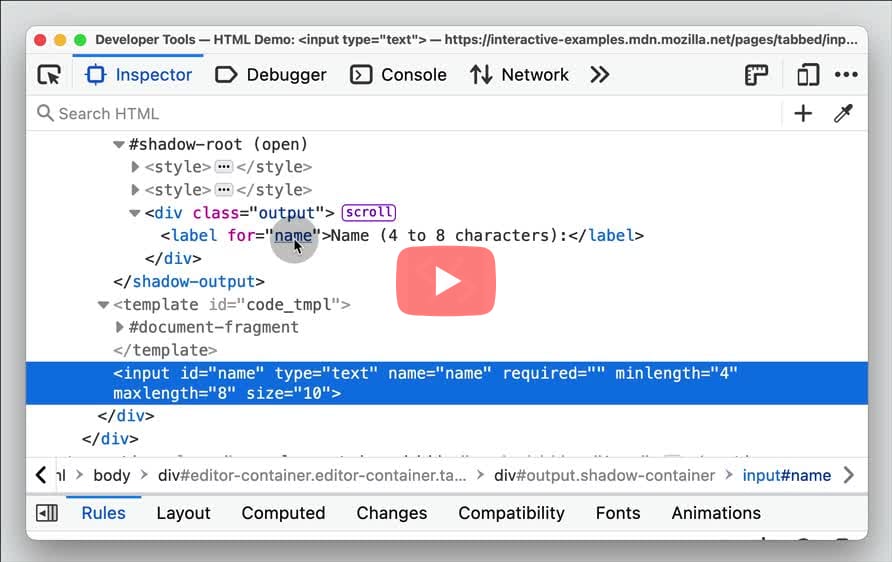
Can I trace style declarations in the original source file?
- Inspect element > Find the corresponding declaration in the "Styles" pane.
- Click the
<filename>:<lineno>link adjacent to the declaration to locate the style in the source file.
- Inspect element > Find the corresponding declaration in the styles section.
- Click the
<filename>:<lineno>link adjacent to the declaration to locate the style in the source file.
Edge:
- Inspect element > Find the corresponding declaration in the "Styles" pane.
- Click the
<filename>:<lineno>link adjacent to the declaration to locate the style in the source file.
- Inspect element > Find the corresponding declaration in the styles section.
- Click the
<filename>:<lineno>link adjacent to the declaration to locate the style in the source file.
Can I measure a portion of the page to compute the width, height and the distance between two points?
- Open Settings(
F1) > Scroll down to the Available Toolbox Buttons section, and enable the option, "Measure a portion of the page". This will add a new Ruler button in the toolbox at the top. - Click the Ruler button > Click and drag along the straight line to measure the straight line distance between any two points on the page.
Can I prevent the debugger from pausing at exceptions?
- In Sources, right click on the line number that throws an exception and select "Never pause here".
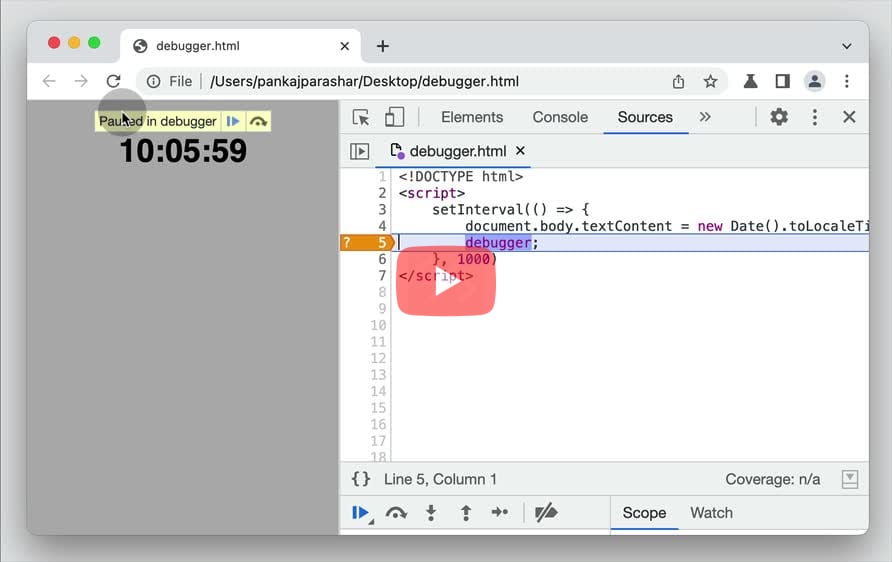
- In Debugger, right click on the line number that throws an exception and select "Never pause here".
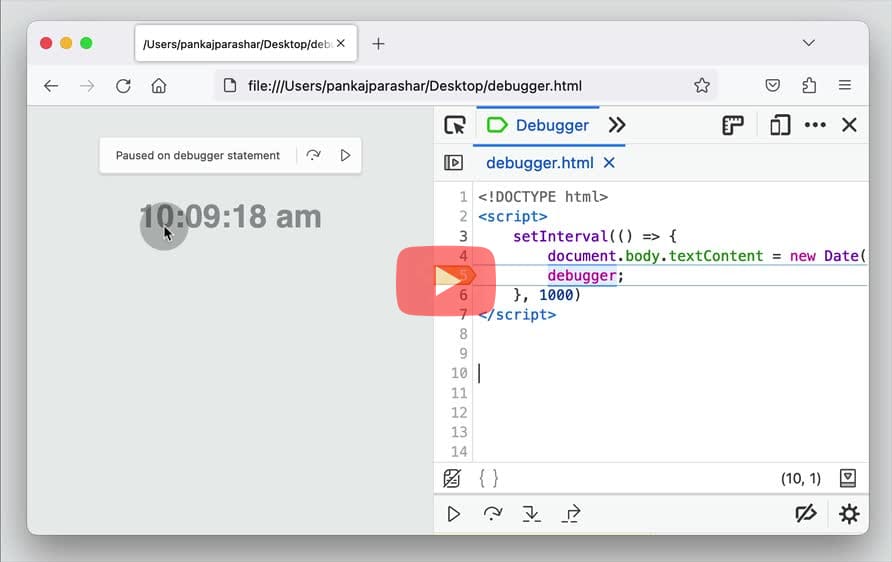
Edge:
- In Sources, right click on the line number that throws an exception and select "Never pause here".
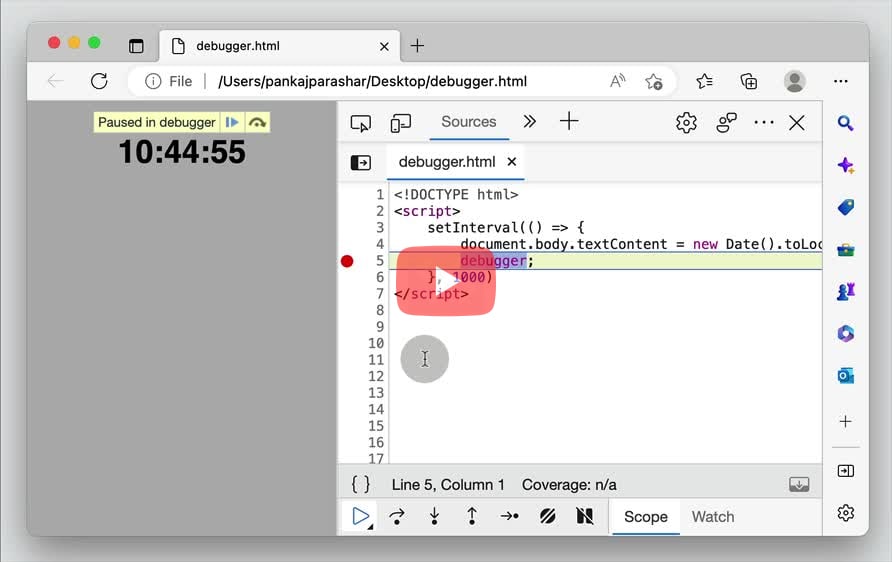
- In Sources, right click on the line that throws exceptions, select "Edit Breakpoint..." > Enter the condition as
false.
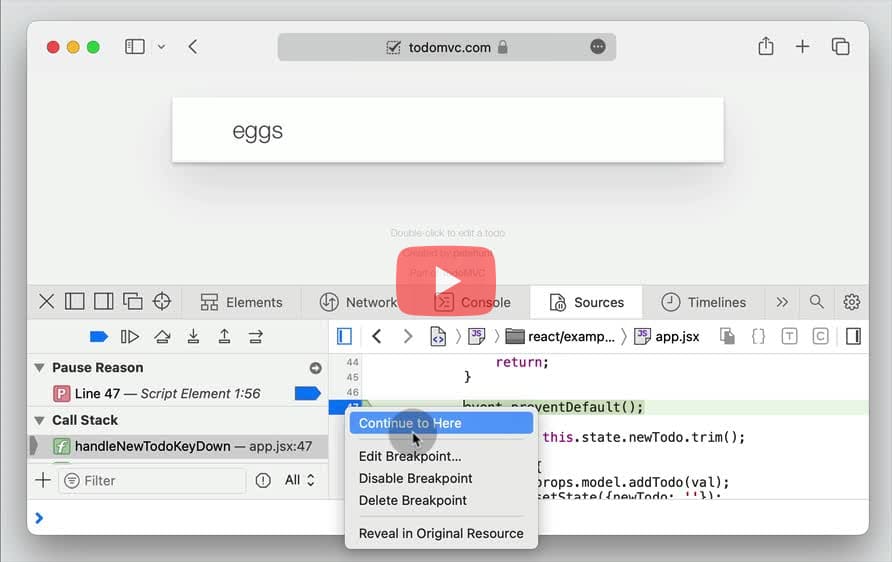
Can I open the console using the keyboard?
- Use
Cmd+Opt+JorCtrl+Shift+Jto directly open the Console tab.
- Use
Cmd+Opt+KorCtrl+Shift+Kto directly open the Console tab.
Edge:
- Use
Cmd+Opt+JorCtrl+Shift+Jto directly open the Console tab.
Safari: Use Cmd+Opt+C to directly open the Console tab.
- Use
Cmd+Opt+JorCtrl+Shift+Jto directly open the Console tab.
Can I open developer tools with the keyboard?
- Launch Chrome > Press
F12. Alternatively, you can also useCmd+Option+I(on Mac) andCtrl+Shift+I(on Windows/Linux) to open the last used panel.
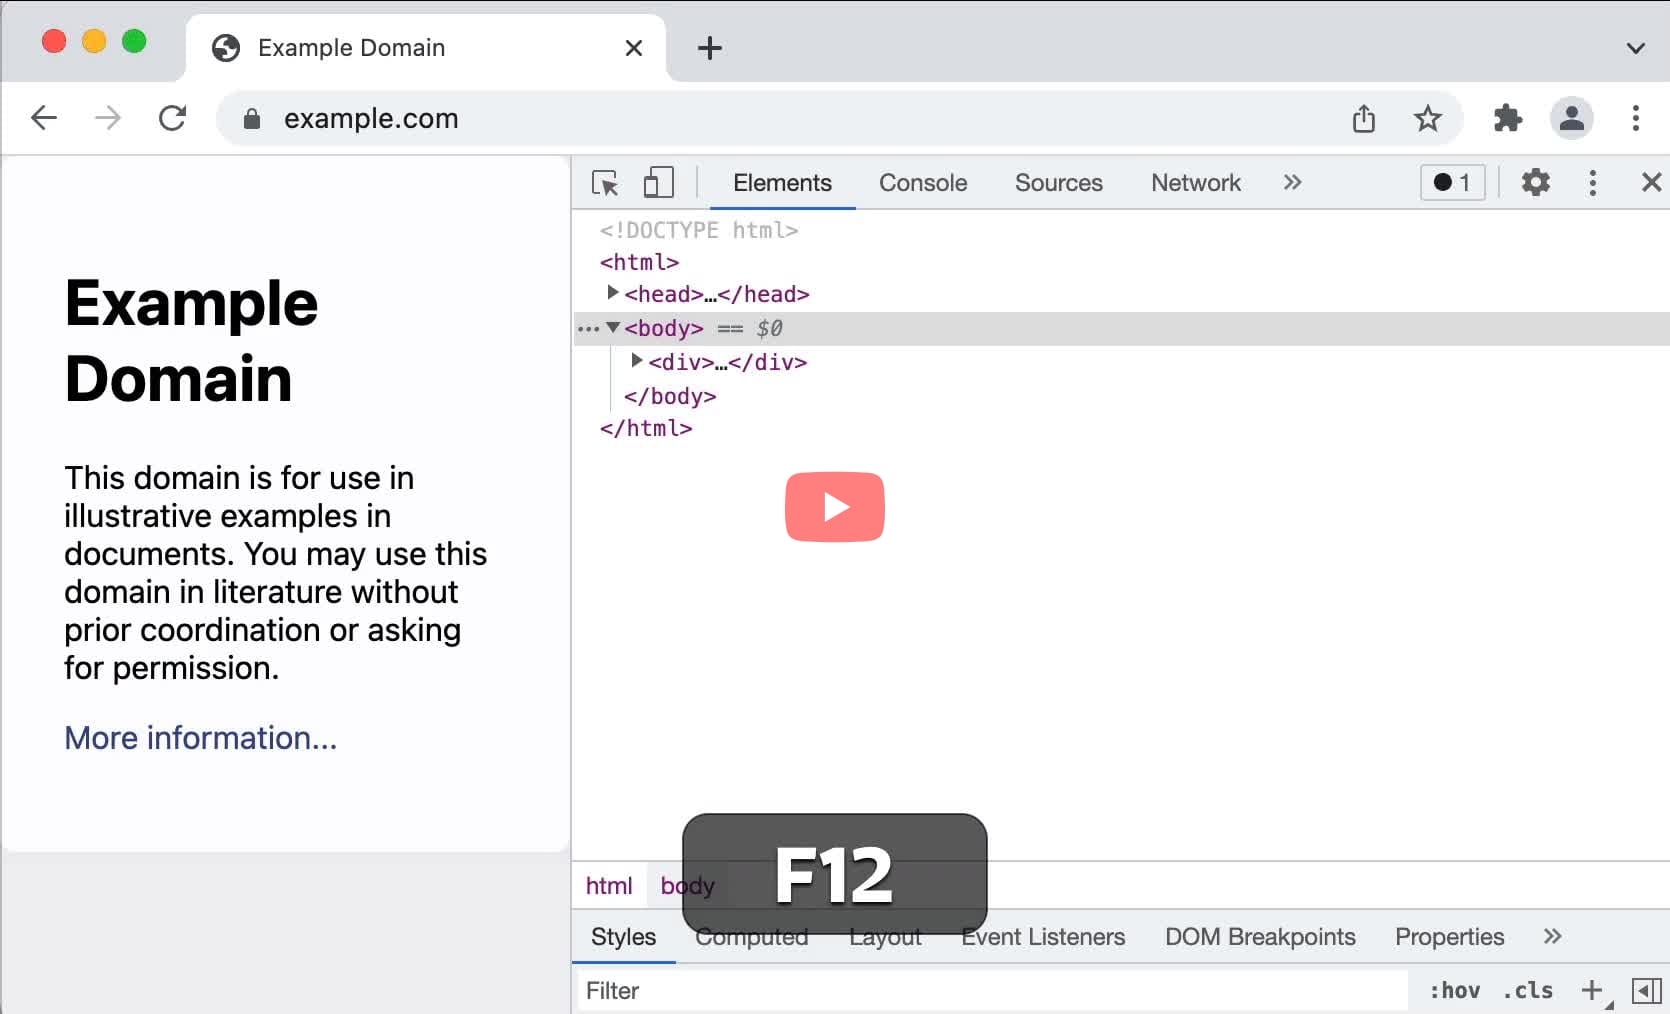
- Launch Firefox → Press
F12.
Edge:
- Launch Edge → Press
F12.

Safari: In the menu bar, navigate to Safari > Preferences > Click on the Advanced tab, check "Show Develop menu in menu bar".
Press Option+Cmd+I to open the devtools.
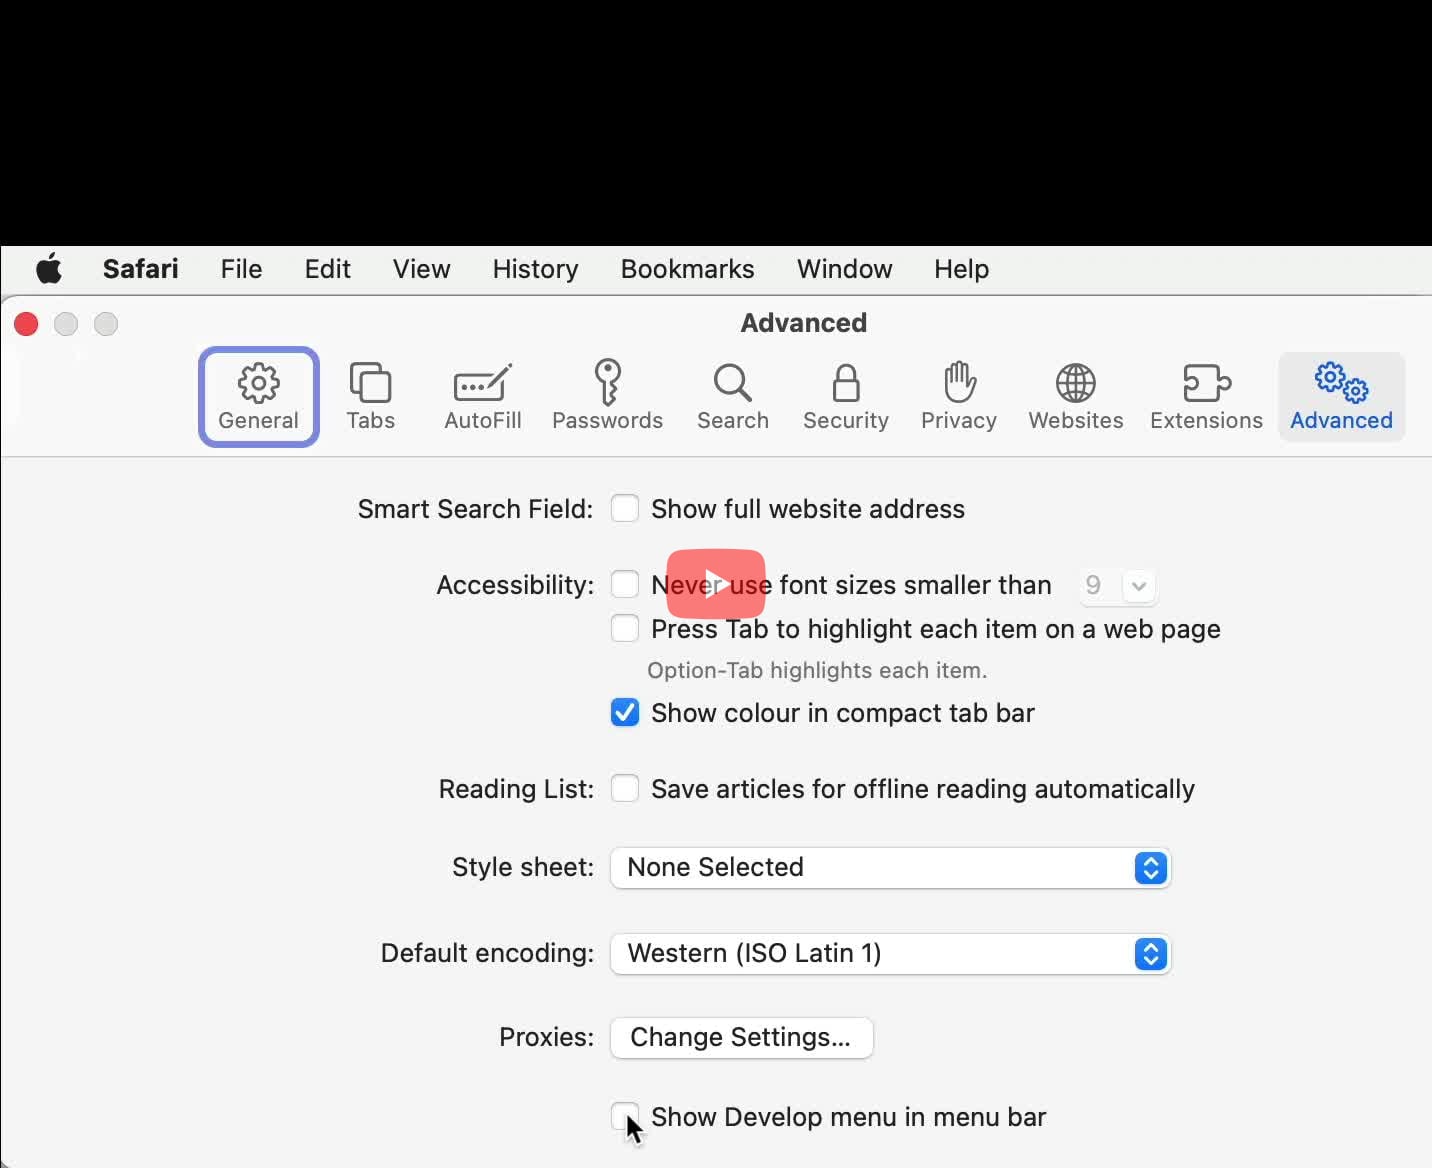
- Press
Cmd/Ctrl+Shift+Pto toggle the devtools panel,Cmd/Ctrl+Shift+Ito open the Element inspector directly andF12orCmd/Ctrl+Opt/Alt+Ito open the Chromium devtools directly.
Can I open developer tools using a mouse?
- Launch Chrome → Click on the vertical three dots icon (near top right of the window).
- Navigate to More Tools > Developer Tools.
- Launch Firefox → Click on the hamburger icon (near top right of the window).
- Navigate to "More Tools" > "Web Developer Tools".
Edge:
- Launch Edge → Click on the horizontal three dots icon (near top right of the window).
- Navigate to More Tools > Developer Tools.
- Launch Safari → In the menu bar, navigate to Safari > Preferences → Click on the General tab, check "Show Developer menu in menu bar".
- Again in the menu bar, navigate to Develop > Show Web Inspector.
- Click the "Panel" Icon in the header, then in the panel go to to the "Edit" tab and then the "Elements" tab.
Can I open developer tools by default with a new tab or a new window?
- MacOS: In the terminal, pass the
--auto-open-devtools-for-tabsflag to while launching Chrome./Applications/Google\ Chrome.app/Contents/MacOS/Google\ Chrome --auto-open-devtools-for-tabs
- Windows: Right-click the Chrome shortcut > Properties and add the flag at the end of the Target line. Alternatively, run the following from your command-line.
C:\Program Files (x86)\Google\Chrome\Application\chrome.exe -auto-open-devtools-for-tabs
- Firefox provides the
-devtoolscommand line parameter to launch a new window with devtools open by default. - In Windows: Open Run > Enter command,
> firefox -devtools
In MacOS: In the terminal, enter the following commands,$ cd /Applications/Firefox.app/Contents/MacOS $ ./firefox -devtools
Edge:
- At the command line, open Microsoft Edge, passing in the --auto-open-devtools-for-tabs flag, as follows:
- Windows:
start msedge --auto-open-devtools-for-tabs
Start-Process -FilePath "msedge" -ArgumentList "--auto-open-devtools-for-tabs
MacOS:/Applications/Microsoft\ Edge.app/Contents/MacOS/Microsoft\ Edge --auto-open-devtools-for-tabs
Linux:microsoft-edge --auto-open-devtools-for-tabs
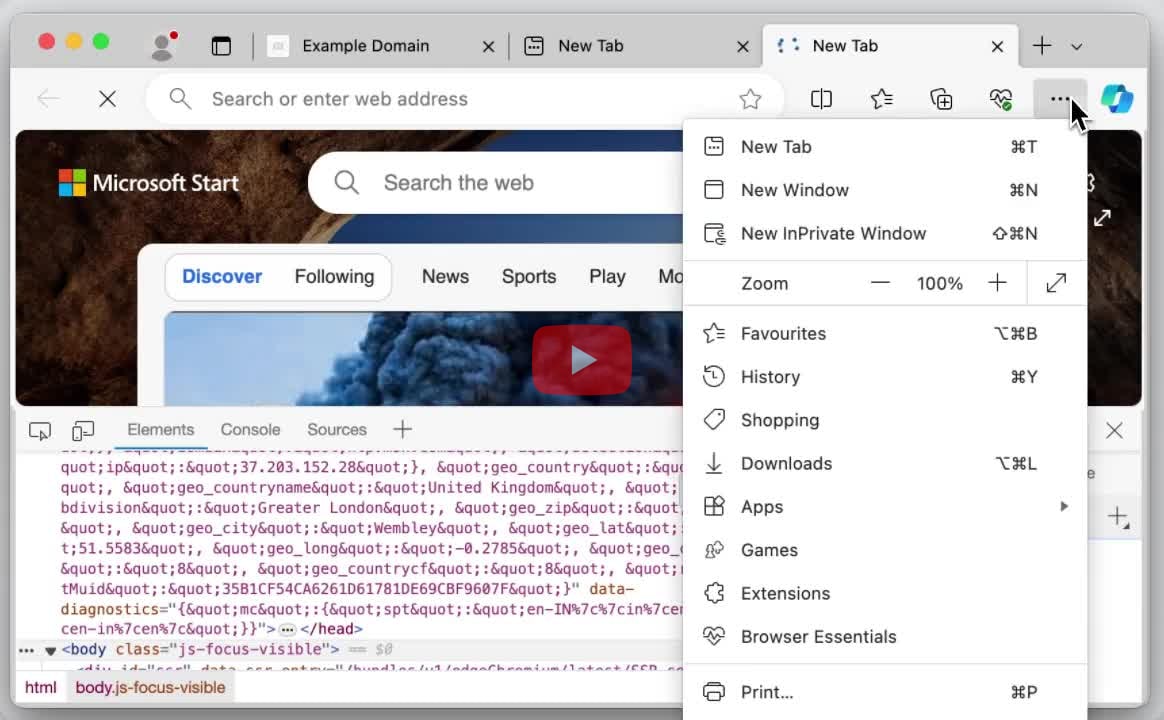
- Open DevTools > In the File menu select "Set Current Tab as Default New Tab".
Can I output data in console in the table format?
- Open console using
Cmd+Opt+JorCtrl+Shift+J. - Use
console.table()to output an array of arrays, or array of objects in a sortable, tabular format. For example,
console.table([[10, true, "blue"],[5, false]])
- If the number of elements in each object is not equal, the table will display
undefinedin cells for which there is no data. - There is an optional second argument which allows you to explicitly specify which columns to output.
console.table([
  {population:8173194, country:"UK", elevation:"24m"},
  {population:8336697, country:"USA", elevation:"10m"}
],["population", "country"])
- Open Console using
Cmd+Opt+KorCtrl+Shift+K> Useconsole.table()to output the object in tabulated format.
Example:
console.table([
  {population:8173194, country:"UK", elevation:"24m"},
  {population:8336697, country:"USA", elevation:"10m"}
],["population", "country"])
Edge:
- Open console using
Cmd+Opt+JorCtrl+Shift+J. - Use
console.table()to output an array of arrays, or array of objects in a sortable, tabular format. For example,
console.table([[10, true, "blue"],[5, false]])
- If the number of elements in each object is not equal, the table will display
undefinedin cells for which there is no data. - There is an optional second argument which allows you to explicitly specify which columns to output.
console.table([
  {population:8173194, country:"UK", elevation:"24m"},
  {population:8336697, country:"USA", elevation:"10m"}
],["population", "country"])
Safari:
Open Console using Cmd+Opt+C. Use console.table() to output arrays of array or array of objects in a sortable, tabular format.
Polypane:
Open Console. Use console.table() to output arrays of array or array of objects in a sortable, tabular format.
Can I override the CORS headers of the network response?
- In the Network panel, open the failed request. Under the Response Headers, add the CORS header to set
Access-Control-Allow-Origin=*. Modified requests are highlighted with a purple icon next to the Status code. - To override multiple requests, click Header Overrides to open the Overrides panel under Sources and use the wildchars to match the pattern.
Can I override location to match a different geographic region?
- Open Command Menu (
Cmd+Shift+PorCtrl+Shift+P) > Run "Show Sensors". This will open the Sensors drawer. - Select a location from the Location dropdown or choose Other to manually enter the Latitude/Longitude.
- Use the Manage button to add a new custom location.
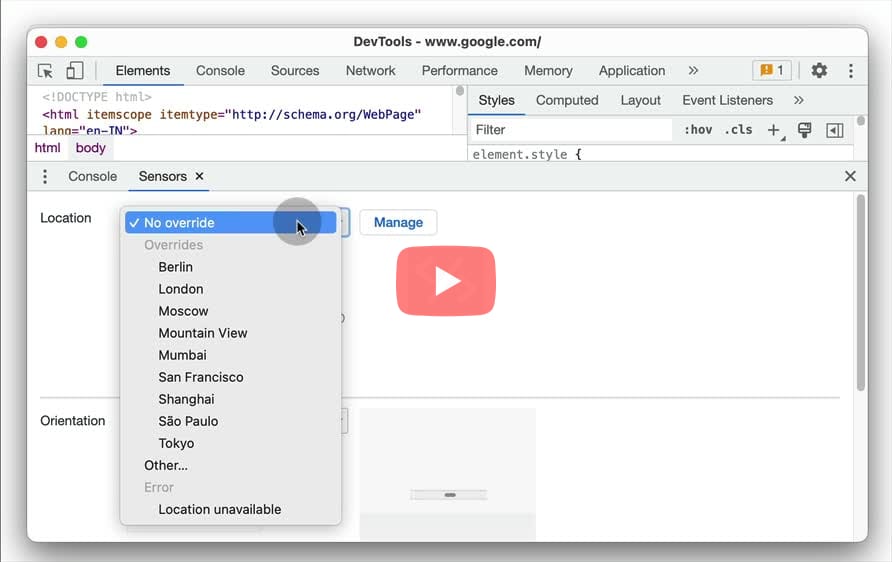
Edge:
- Open Command Menu (
Cmd+Shift+PorCtrl+Shift+P) > Run "Show Sensors". This will open the Sensors drawer. - Select a location from the Location dropdown or choose Other to manually enter the Latitude/Longitude.
- Use the Manage button to add a new custom location.
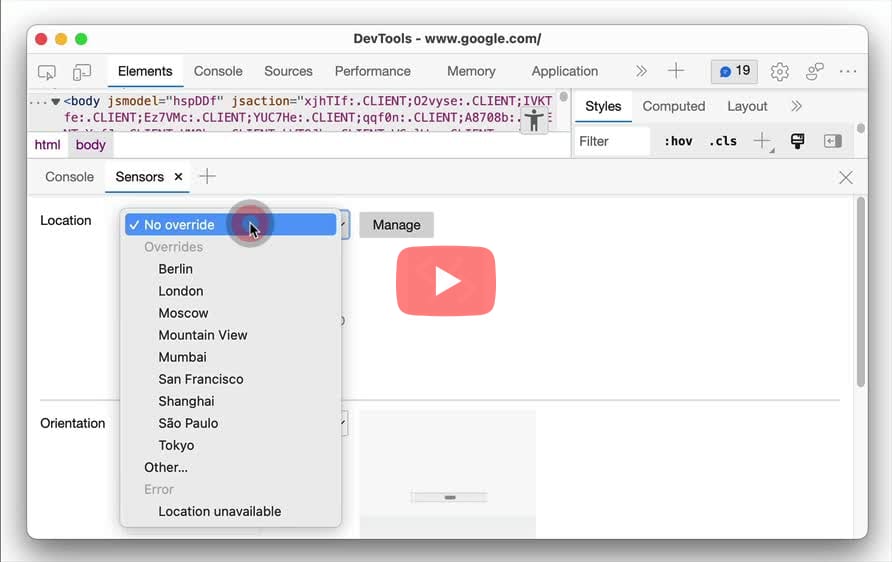
Can I override global objects on page load before other scripts run?
- In the Sources panel, click Add Resource (+) button in the bottom of the left sidebar > select "Inspector Bootstrap Script".
- Add the code snippet to override the behaviour of the global objects that is guaranteed to run before any other code.
Can I override the body of a network request?
- In the Network panel, right click on the request and select "Override content". Devtools will prompt to select a folder to store the overrides in.
- Once the overrides are setup, Devtools will navigate to Sources > Overrides > Editor to override content. Overriden resources are highlighted with a purple dot in the Network panel.
- The Network panel has a Has overrides column and a corresponding
has-overrides:[content|headers|yes|no]filter. To see the Has overrides column, right-click the table header and select it.
Can I override headers of the network response?
- In the Network panel, right click on the request and select "Override headers". Select the path where the overrides will be saved > Allow permissions to access the path.
- Under Response headers section, click "Add header" to add a custom key-value pair. Use the header overrides option to manage your custom headers across all domains.
- Request with overriden headers are highlighted with purple dot next to the Status code.
- The Network panel has a Has overrides column and a corresponding
has-overrides:[content|headers|yes|no]filter. To see the Has overrides column, right-click the table header and select it.
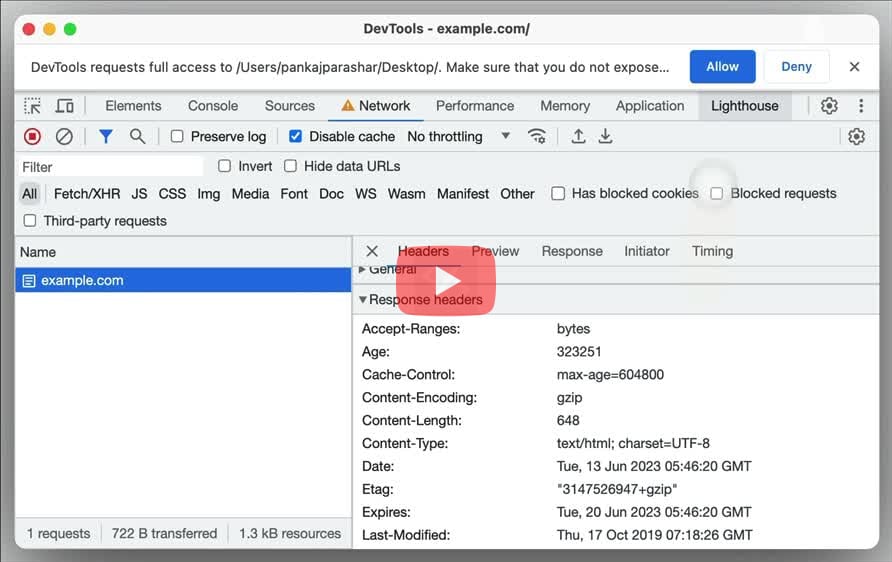
Can I override the user agent to emulate different profiles?
- Open Command Menu (
Cmd+Shift+PorCtrl+Shift+P) and Run > "Show network conditions". This will open the Network conditions drawer. - In the User agent section, disable "Use browser default" and select the user agent from the list below or enter your own custom string.
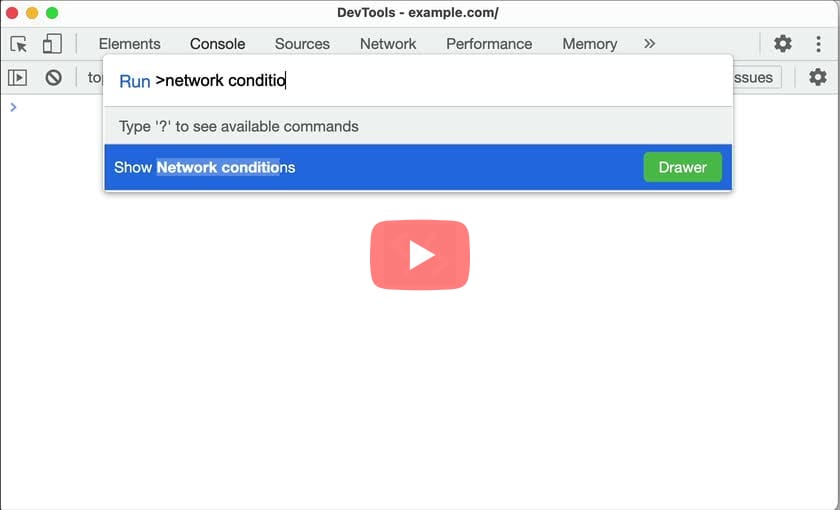
- Open
about:configfrom the address bar and Accept the Risk and Continue. - Search for "useragent.override" in the preference pane. Select String, click the
+button and paste the custom user agent string in the input field.
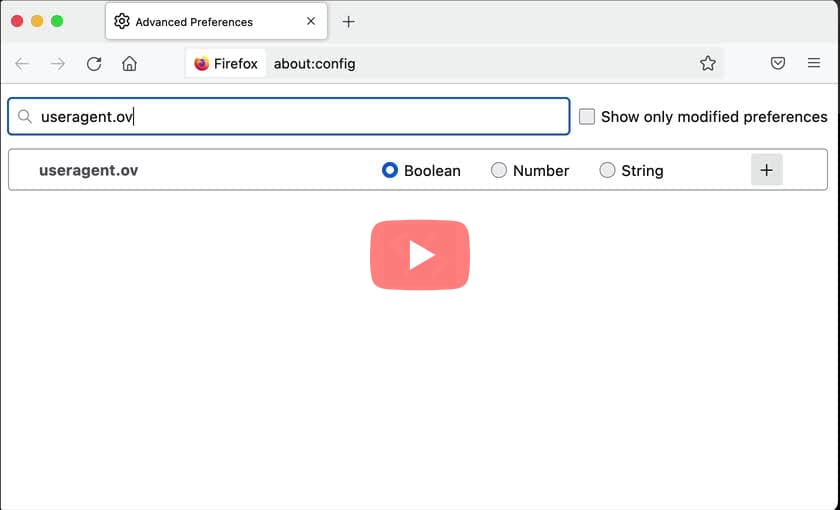
Edge:
- Open Command Menu (
Cmd+Shift+PorCtrl+Shift+P) and Run > "Show network conditions". This will open the Network conditions drawer. - In the User agent section, disable "Use browser default" and select the user agent from the list below or enter your own custom string.
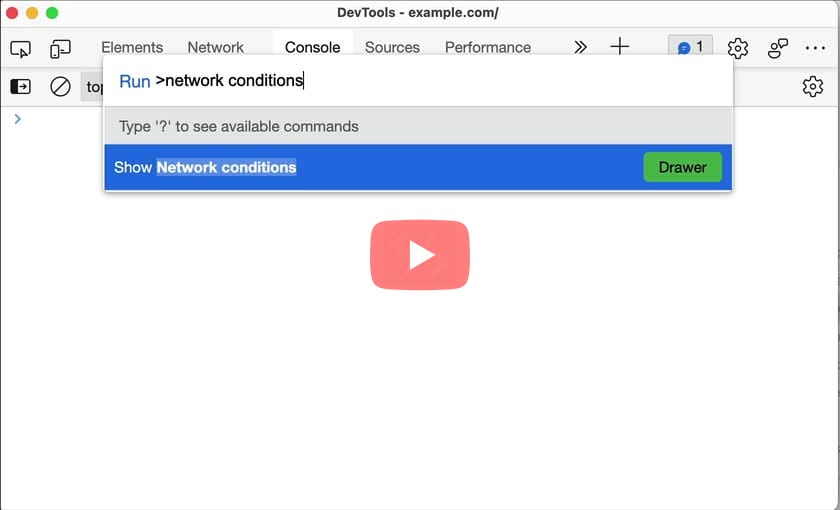
- In the Menu Bar, Developer > User Agent > Select the user agent. Choose "Other..." to use a custom user agent string.
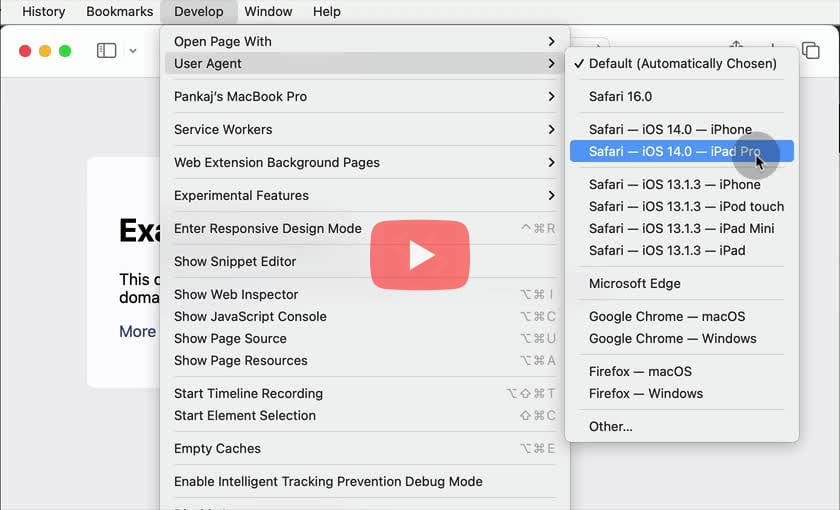
- Open the Change Media and Emulations settings of a pane
- Go to the "Emulation" tab.
- Enter the custom user agent string in the User agent input field.
Can I use the color picker to pick colors from outside the browser window?
- Open Settings (or press
Shift+?orF1) > Experiments > Apply filter on "color picker". - Check the "Enable color picking outside the browser window" option > Reload DevTools.
- In the Styles pane, click on any color preview to open a color picker. Use the eyedropper to pick color from anywhere.
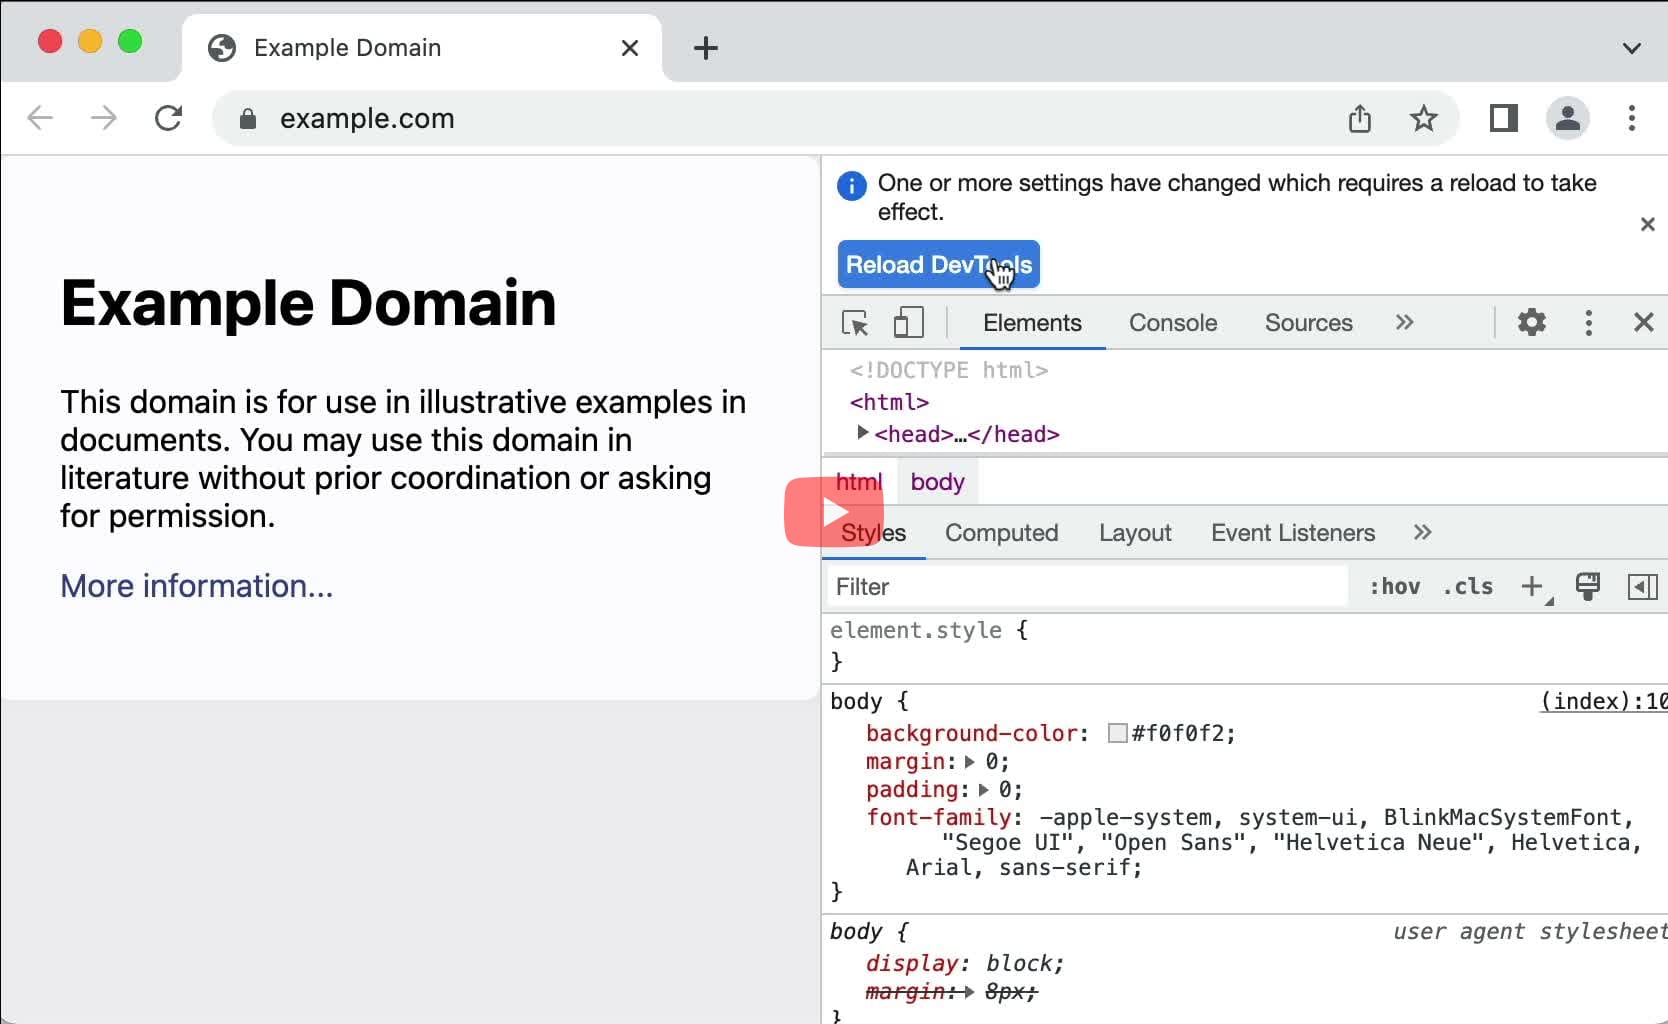
Edge:
- Open Settings (or press
Shift+?orF1) > Experiments > Apply filter on "color picker". - Check the "Enable color picking outside the browser window" option > Reload DevTools.
- In the Styles pane, click on any color preview to open a color picker. Use the eyedropper to pick color from anywhere.
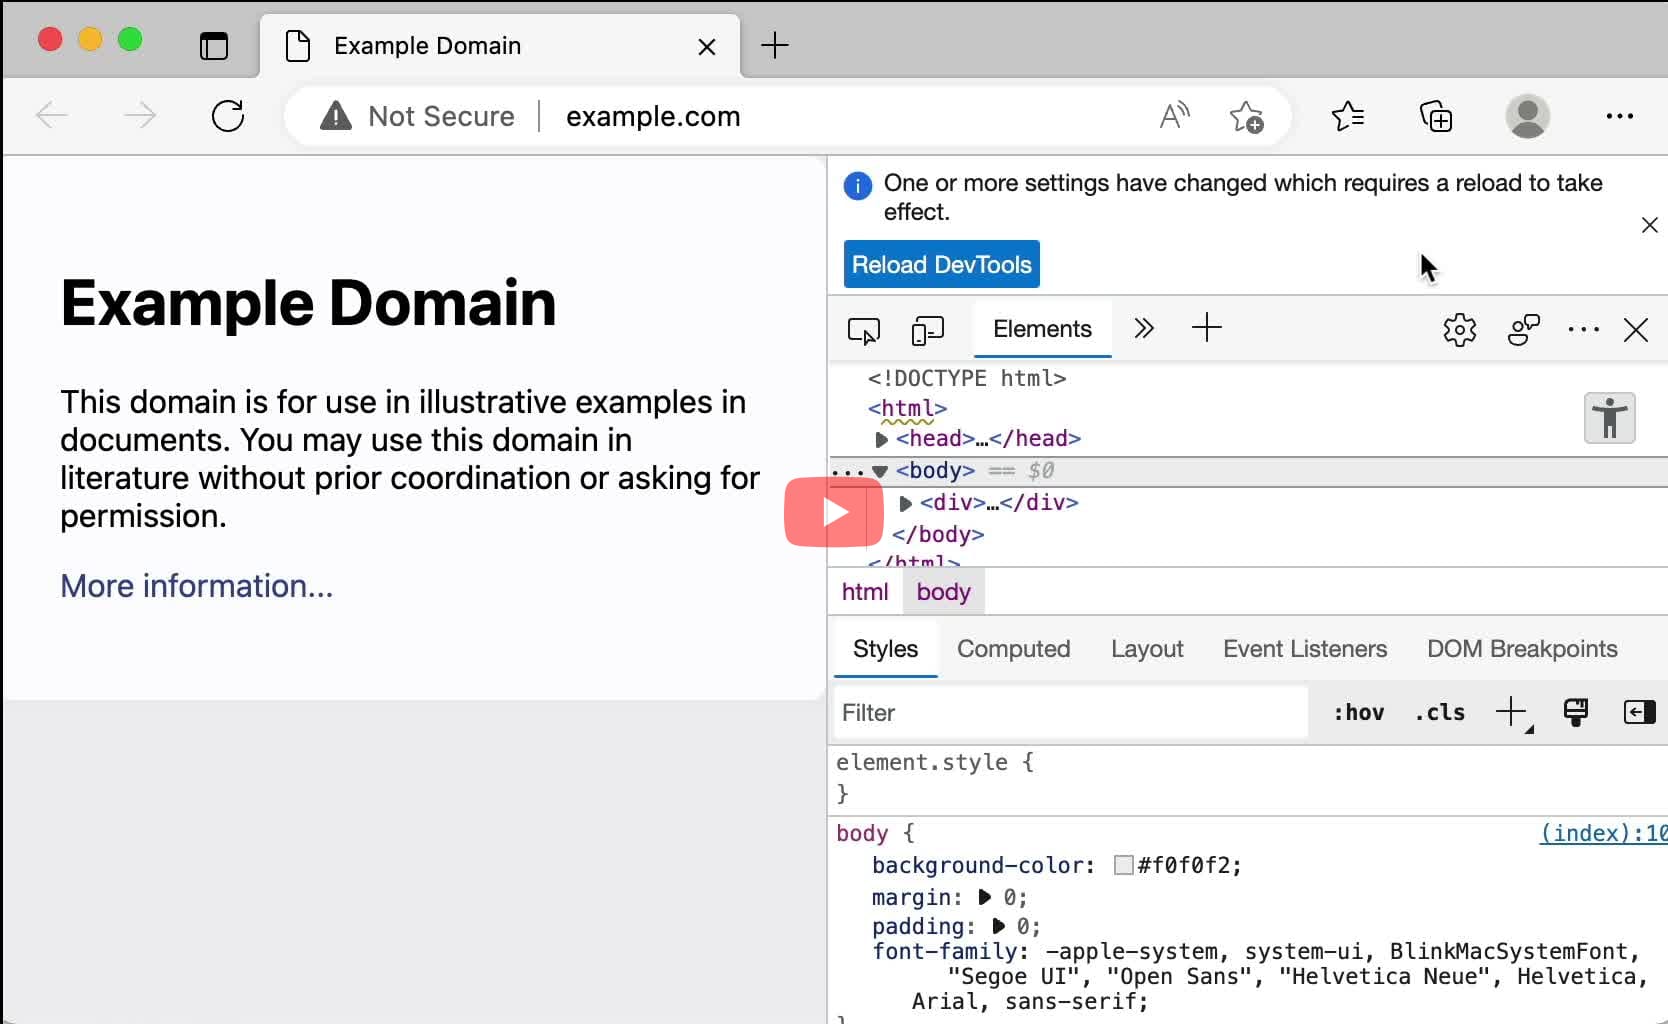
- In the Styles pane, click on any color preview to open a color picker. Use the eyedropper to pick color from anywhere.
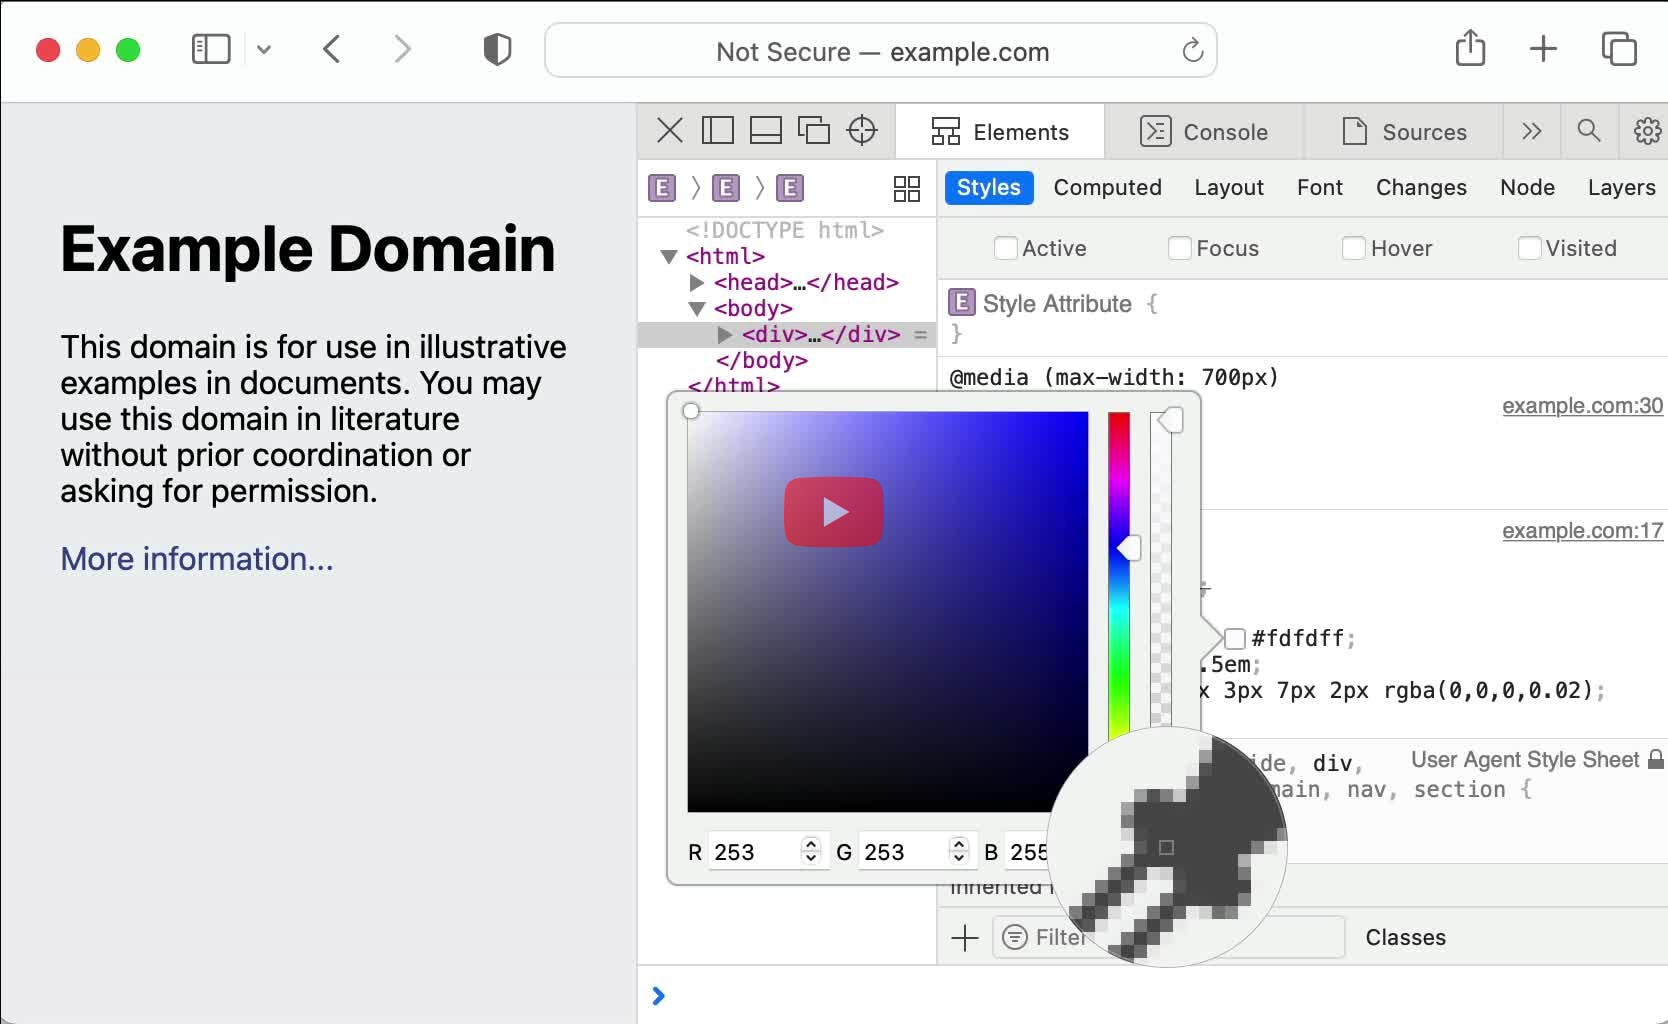
- Click the Color picker in the address bar.
- Use the eyedropper to pick color from anywhere.
- You can also start the color picker with
Opt/Alt+Shift+P.
Can I preserve console logs across page reloads?
- Open console using
Cmd+Opt+JorCtrl+Shift+J> Click on the gear icon in top right to open "Console settings". - Check "Preserve log" to preserve log statements between page reloads.
- Open Console Settings from the toolbar in top right > Click "Persist Logs" to preserve the console output each time you visit a new page.
Edge:
- Open console using
Cmd+Opt+JorCtrl+Shift+J> Click on the gear icon in top right to open "Console settings". - Check "Preserve log" to preserve log statements between page reloads.
- In the Console tab, select the "Preserve Log" checkbox in the toolbar (top) to persist logs across page reloads.
- Open console using
Cmd/Ctrl+Shift+J> Click the checkbox next to "Preserve" to preserve log statements between page reloads.
Can I preserve network log on page reloads?
- In the Network panel, enable the "Preserve log" option in the toolbar to preserve all the network requests on page reloads.
Can I pretty print minified JavaScript code?
- In the Sources tab, open the
.jsfile from the left sidebar. In the bottom tray, click the icon{}titled "Pretty print" to pretty print the JavaScript code. - This will open the formatted file in a new tab suffixed ":formatted".
- In the Debugger tab, open the
.jsfile from the Sources panel in the left sidebar. From the status bar in the bottom, click the{}icon to pretty print the source file.
Edge:
- In the Sources tab, open the
.jsfile from the Page panel in the left sidebar. From the bottom status bar, click the{}icon to pretty print the source file. - This action will open the formatted file in the new tab with the filename suffixed with
:formatted.
- In the Sources tab, open the
.jsfile from the left sidebar. Click the pretty print icon{}from the top toolbar to toggle between pretty print and original source format.
Can I preview the social media cards for websites like Facebook, X etc
- In Developer Tools, open Info > Meta. Scroll down to the Social media previews section to see cards for each social media website like X, Facebook, LinkedIn etc.
- This also works with
localhostwhile running the app locally. Use the Overwrite domain button to preview the card with production URL. - Toggle the light/dark buttons to preview the card in the light and the dark mode respectively.
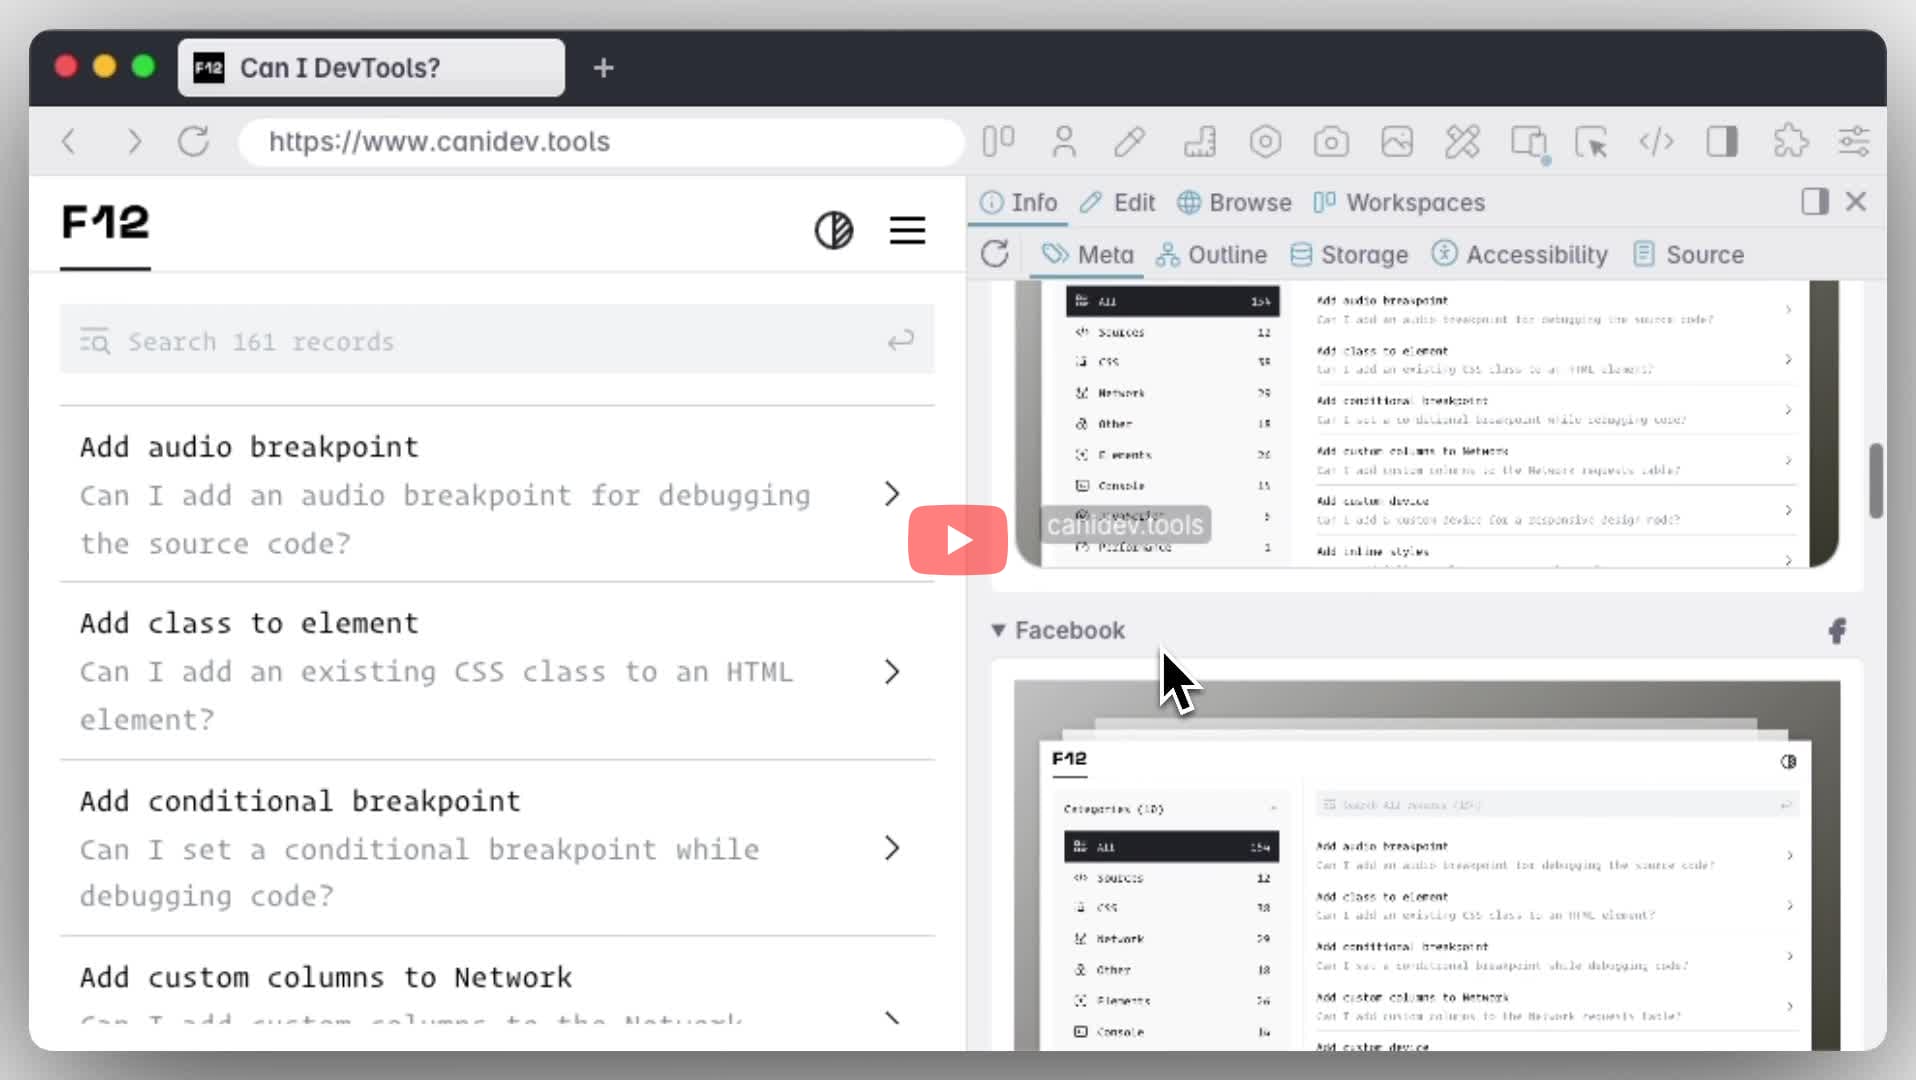
Can I record and replay all the user actions performed on the website?
-
Open Command Menu (
Ctrl+Shift+PorCmd+Shift+P) > Run > Show Recorder (Panel). -
Click "Start new recording" > Enter name > Click "Start a new recording" > Perform actions on the page > Click "End recording".
-
Click the "Replay" button to replay the recorded user journey.
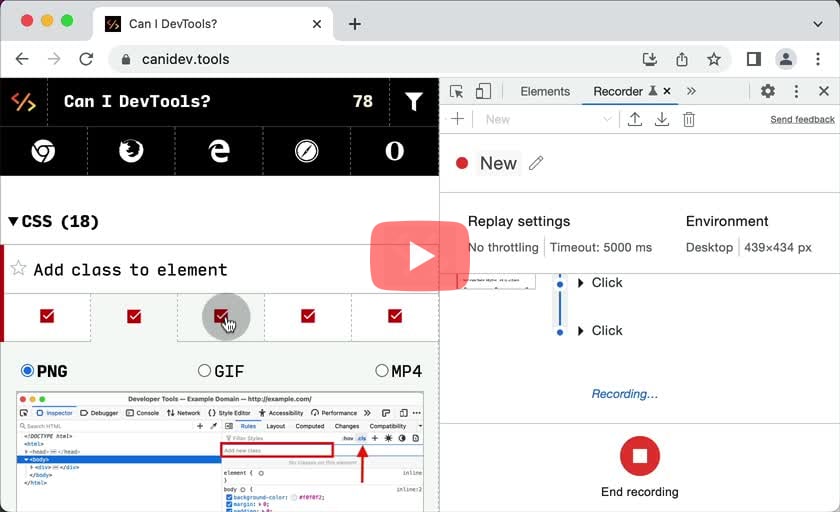
Can I reorder tabs & panes in the devtools panel?
- In the main browser window, drag and drop tabs (or panes) anywhere across the tab-bar to reorder tabs (or panes) based on preference.
- Once re-ordered, the order will persist for future devtools sessions.
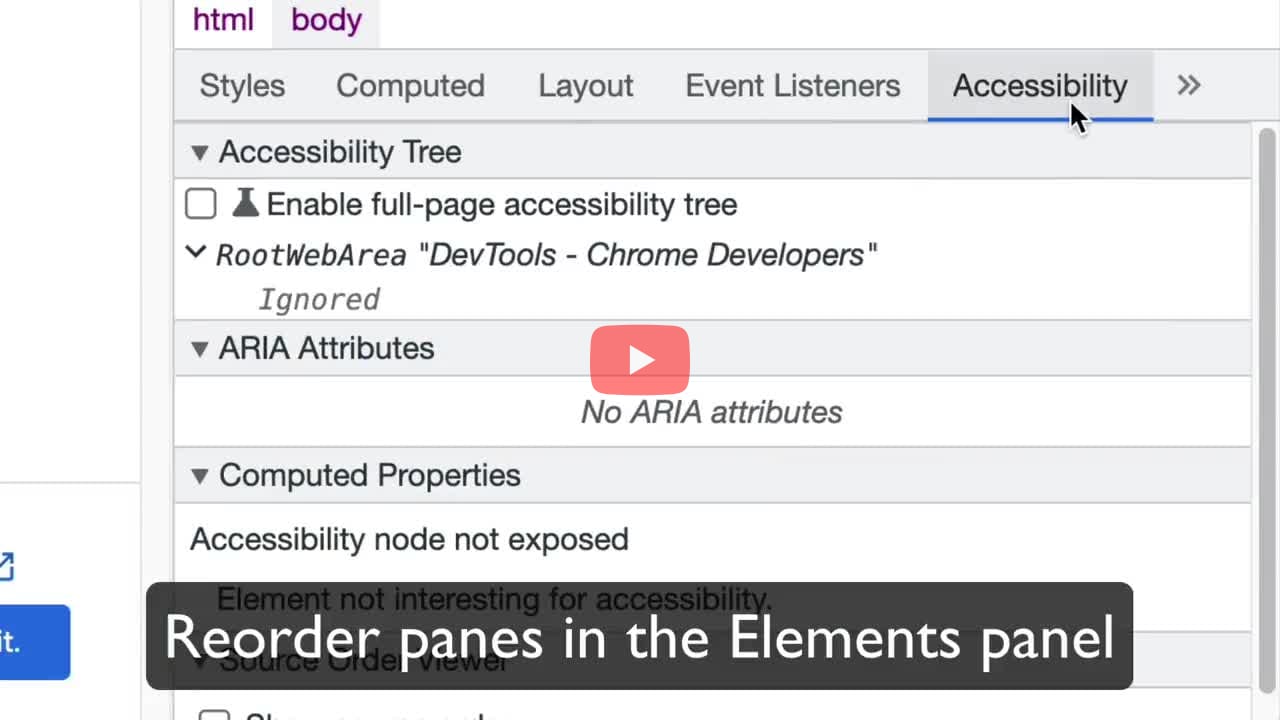
- In the main browser window, drag and drop tabs (or panes) anywhere across the tab-bar to reorder tabs (or panes) based on preference.
- Once re-ordered, the order will persist for future devtools sessions.
Edge:
- In the main browser window, drag and drop tabs (or panes) anywhere across the tab-bar to reorder tabs (or panes) based on preference.
- Once re-ordered, the order will persist for future devtools sessions.
- In the main browser window, drag and drop tabs anywhere across the tab-bar to reorder tabs based on preference.
- Once re-ordered, the order will persist for future devtools sessions.
- This does not work for panes within a tab.
Can I report issues, feedback or request features related to DevTools and the docs?
Chrome: Use the following options to discuss the new features and changes in the docs, or anything else related to DevTools.
- Submit a suggestion or feedback via crbug.com.
- Report a DevTools issue using the "More options" > Help > Report a DevTools issues in DevTools.
- Tweet at @ChromeDevTools.
- Leave comments on "What's new in DevTools" YouTube videos.
- Chrome DevTools documentation
- Bugzilla - For bugs in Firefox DevTools, the developer tools within the Firefox web browser. This includes issues about the user interface of the toolbox, special pages such as about:debugging and about:devtools, and developer-related APIs.
- Discourse forums
- @FirefoxDevTools on Twitter
- YouTube
- Firefox DevTools Docs
Edge:
- Use the send feedback button (
Opt/Alt+Shift+I) to report any issues encountered while using the DevTools. - File issues on the Microsoft Edge DevTools Github repository.
- Report Docs related bugs or issues on the Edge Developer Github repository.
- Microsoft Edge DevTools documentation.
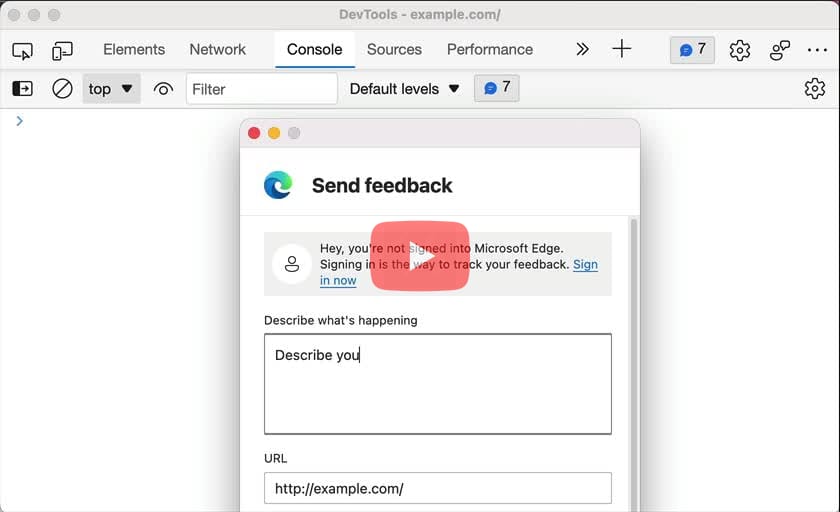
- File Webkit Inspector related bugs on Webkit Bugzilla or report issues on the Github repository.
- Web Inspector Reference
- In the Help menu, click "Chat with us" for chat support, or click "Get Support" for e-mail support.
Can I restore the default settings of the developer tools?
Chrome: To restore the default theme, placement, tools order, and any other customised settings, select Settings > Preferences > Restore defaults and reload.
Edge: To restore the default theme, placement, tools order, and any other customised settings, select Settings > Preferences > Restore defaults and refresh.
Polypane: In the Help menu, select "Delete settings and restart".
Can I run the previously executed commands in the console?
- Use the
Uparrow key to scroll through the list of previously executed commands and then pressEnter.
- Use the
Uparrow key to scroll through the list of previously executed commands and then pressEnter.
Edge:
- Use the
Uparrow key to scroll through the list of previously executed commands and then pressEnter.
- Use the
Uparrow key to scroll through the list of previously executed commands and then pressEnter.
- Use the
Uparrow key to scroll through the list of previously executed commands and then pressEnter.
Can I run snippet of code in devtools?
- Sources > In the left sidebar, open Snippets > Click "+ New snippet". This will open an empty file in the main view.
- Enter the snippet and press
Cmd+Enterto run the code. - Additionally, you can also save the snippet and run it directly from the Command Menu using
!<script>.
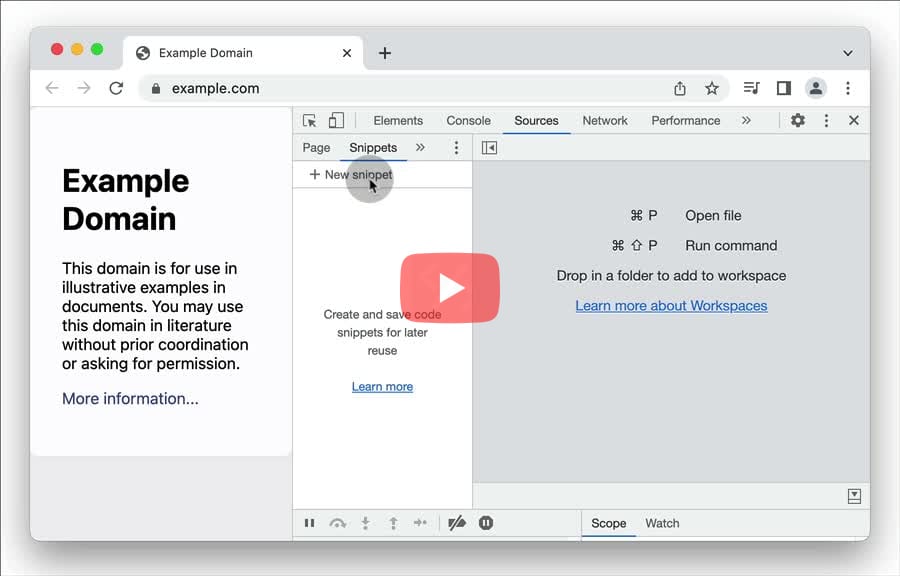
- Open Console (
Cmd+Opt+KorCtrl+Shift+K) > Switch to multi-editor mode (Cmd+BorCtrl+B). - This will open the editor next to the Console, where you can enter the snippet and click "Run" to execute.
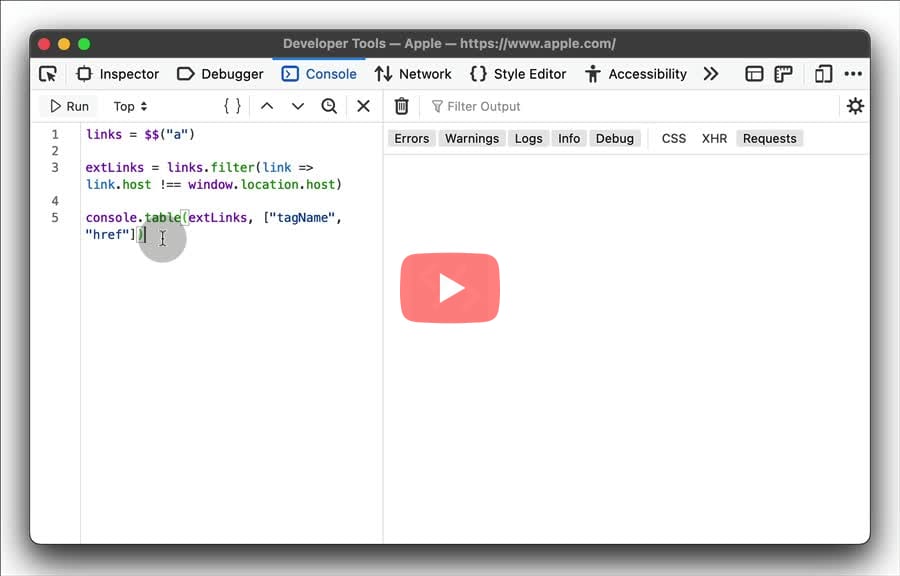
Edge:
- Sources > In the left sidebar, open Snippets > Click "+ New snippet". This will open an empty file in the main view.
- Enter the snippet and press
Cmd+Enterto run the code. - Additionally, you can also save the snippet and run it directly from the Command Menu using
!<script>.
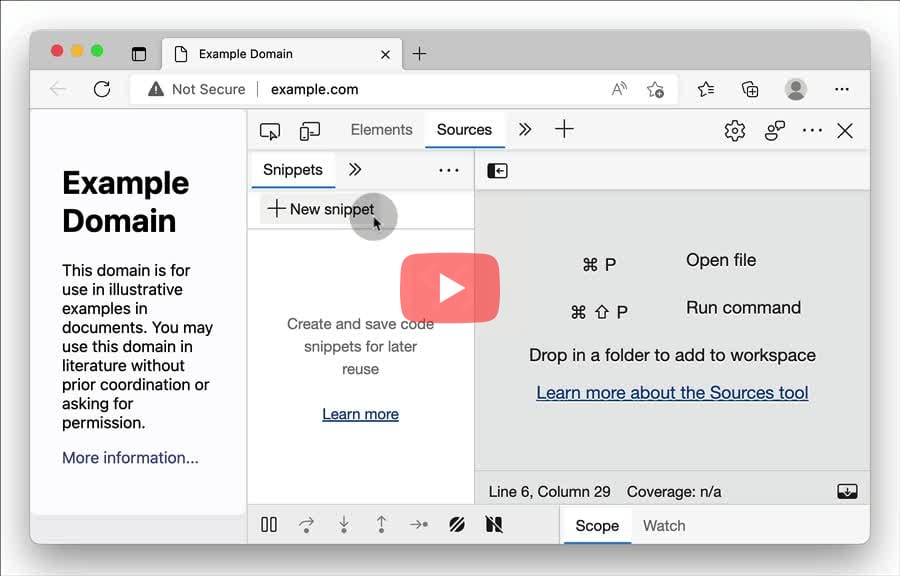
- In Sources > Click the "+" button to Create Resource > "Console Snippet...". Input the name of the snippet and enter the script.
- Click the Play button next to the snippet name to execute the code in Console.
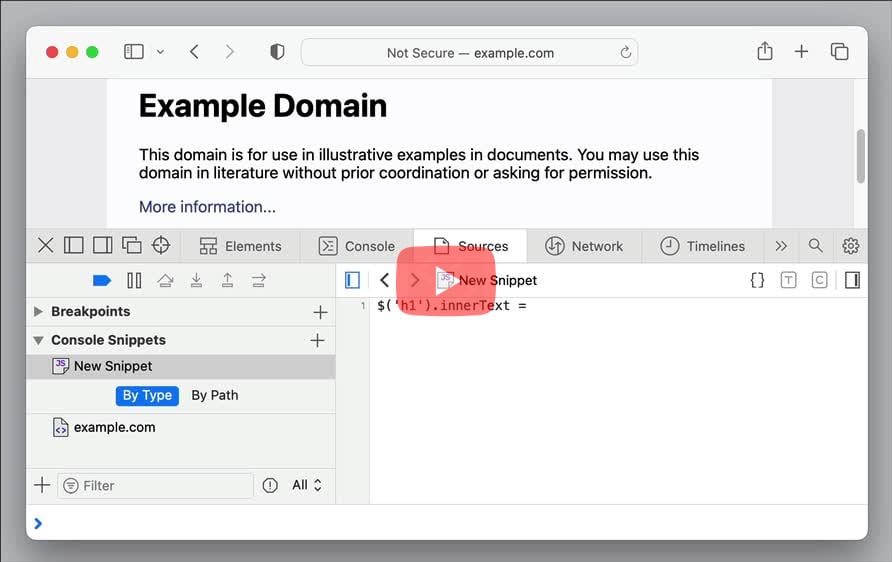
Can I scroll a DOM node into the viewport?
- In the Elements panel, right click on the node and select "Scroll into view".
Can I select one or more elements using XPath expression?
Chrome:
$x(path [, startNode]) returns an array of DOM elements that match the given XPath expression. It has an optional second parameter, startNode, that specifies an element or Node from which to search for elements.
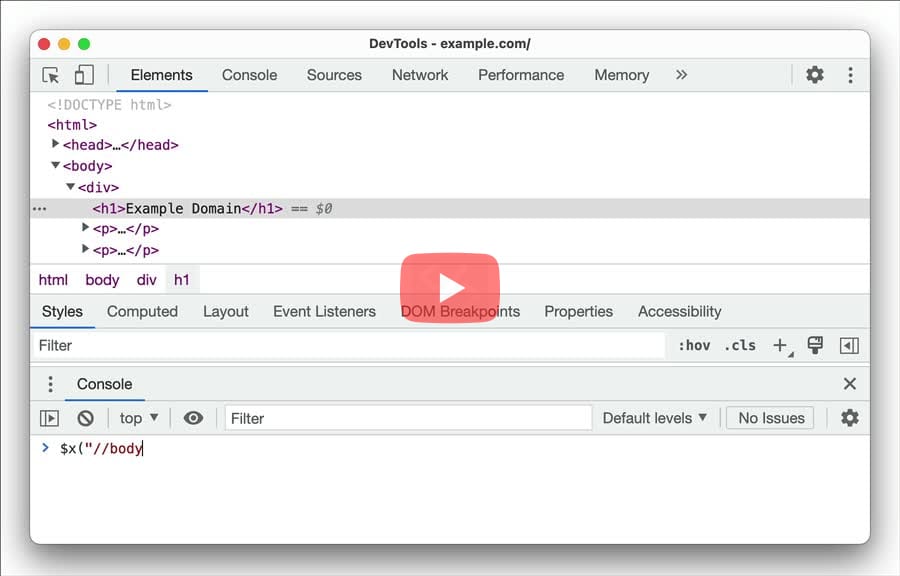
$x(path [, startNode])returns an array of DOM elements that match the given XPath expression. It has an optional second parameter,startNode, that specifies an element or Node from which to search for elements.
Edge:
$x(path [, startNode]) returns an array of DOM elements that match the given XPath expression. It has an optional second parameter, startNode, that specifies an element or Node from which to search for elements.
Safari:
$x(path [, startNode]) returns an array of DOM elements that match the given XPath expression. It has an optional second parameter, startNode, that specifies an element or Node from which to search for elements.
Can I select one or more elements from the console?
$(selector [, startNode])returns the reference to the first DOM element with the specified CSS selector. This command is equivalent to callingdocument.querySelector().$$(selector [, startNode])returns an array of elements that match the given CSS selector. This command is equivalent to callingdocument.querySelectorAll().
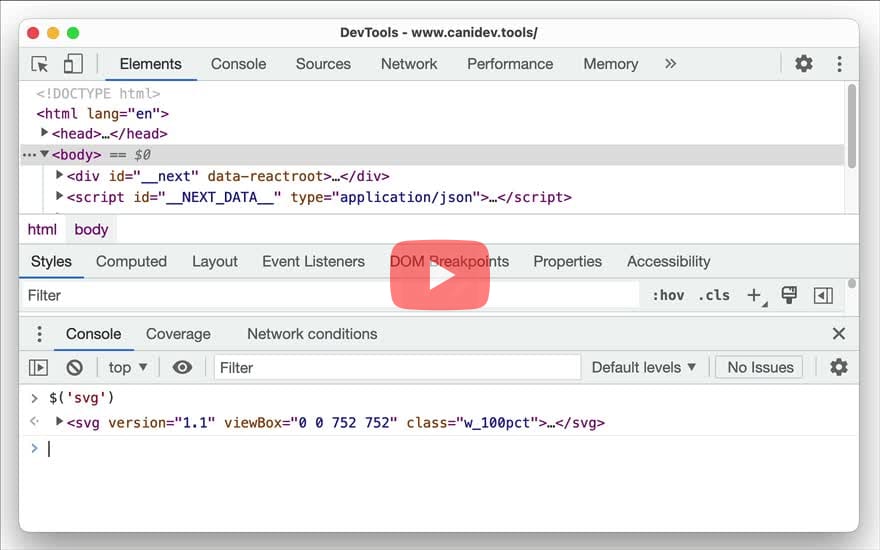
$(selector [, startNode])returns the reference to the first DOM element with the specified CSS selector. This command is equivalent to callingdocument.querySelector().$$(selector [, startNode])returns an array of elements that match the given CSS selector. This command is equivalent to callingdocument.querySelectorAll().
Edge:
$(selector [, startNode])returns the reference to the first DOM element with the specified CSS selector. This command is equivalent to callingdocument.querySelector().$$(selector [, startNode])returns an array of elements that match the given CSS selector. This command is equivalent to callingdocument.querySelectorAll().
$(selector [, startNode])returns the reference to the first DOM element with the specified CSS selector. This command is equivalent to callingdocument.querySelector().$$(selector [, startNode])returns an array of elements that match the given CSS selector. This command is equivalent to callingdocument.querySelectorAll().
$(selector)returns the reference to the first DOM element with the specified CSS selector. This command is equivalent to callingdocument.querySelector().$$(selector)returns an array of elements that match the given CSS selector. This command is equivalent to callingdocument.querySelectorAll().
Can I set a custom keyboard shortcuts in devtools?
Enable "Enable keyboard shortcut editor" in the Experiments, using
Cmd+Shift+PorCtrl+Shift+P> Show Experiments > Reload DevTools.
- Press
Cmd+Shift+PorCtrl+Shift+Pto launch the Command Menu > Type "Shortcuts" > PressEnter. - Click the "Edit" icon next to the shortcut. Apply the shortcut and Save.
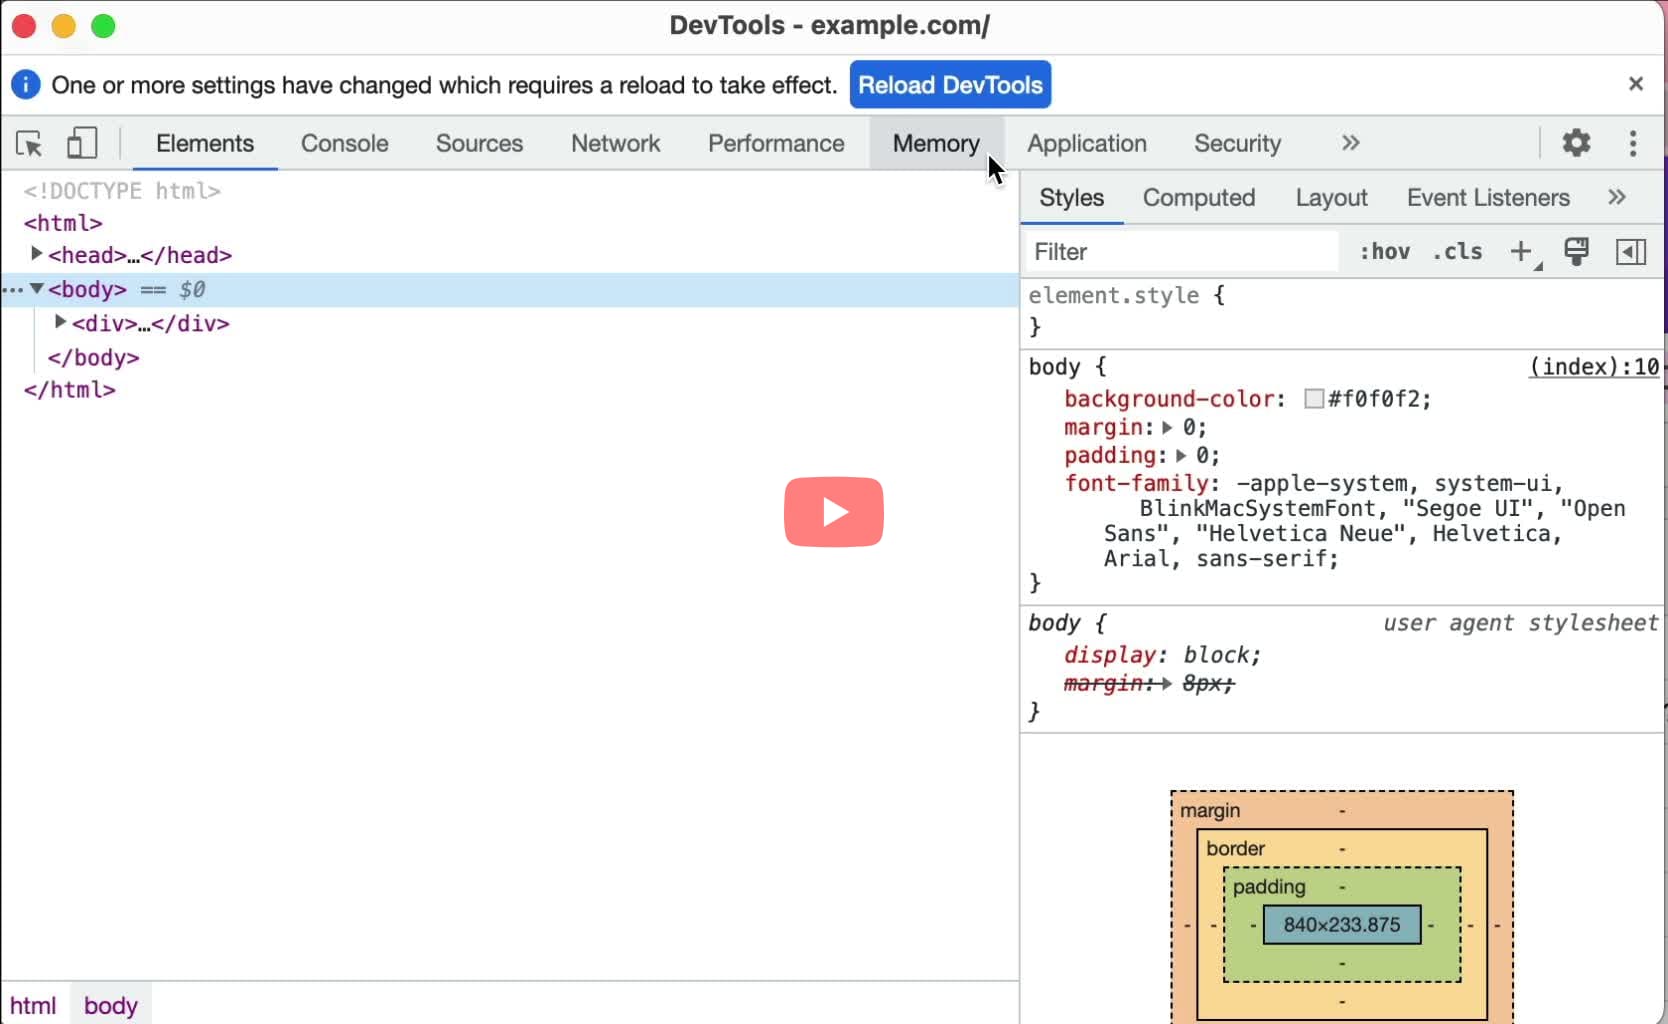
Edge:
- Press
Cmd+Shift+PorCtrl+Shift+Pto launch the Command Menu > Type "Shortcuts" > PressEnter. - Click the "Edit" icon next to the shortcut. Apply the shortcut and Save.
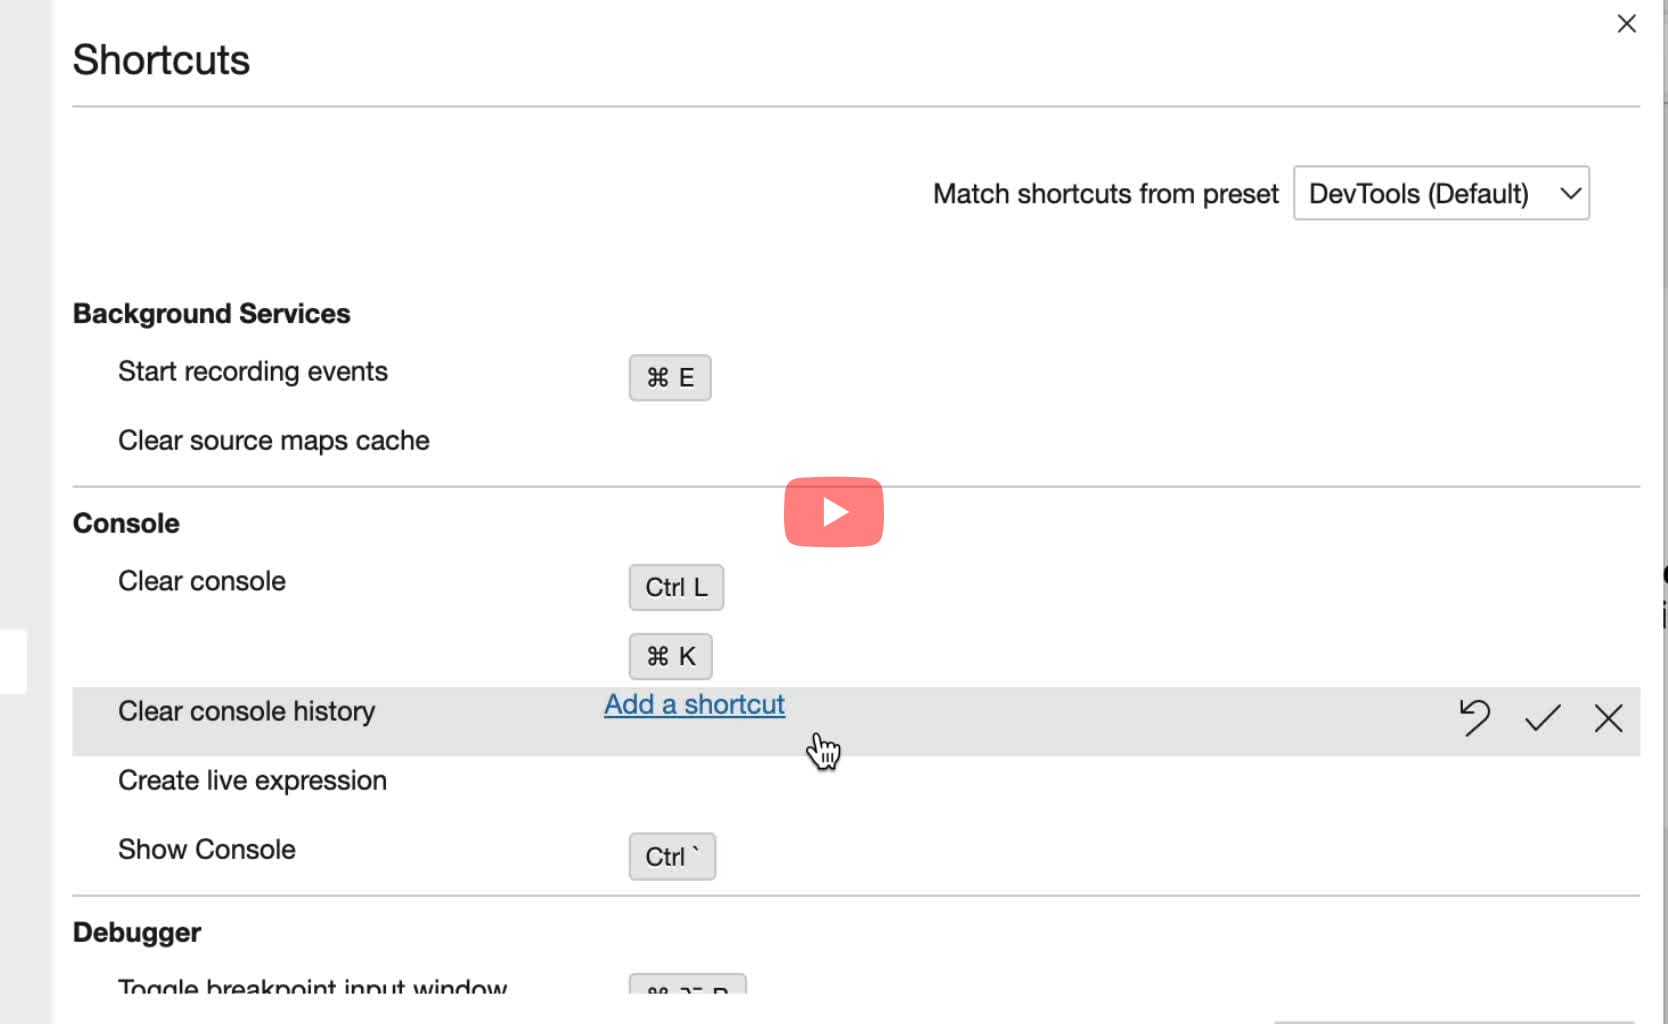
Can I enable vertical and horizontal rulers on the page when I hover on the elements?
- Open Settings (
Shift+?orF1) > Preferences > Scroll down to the Elements section, and enable "Show rulers on hover".
- Open Settings (
F1) > Scroll down to the Available Toolbox Buttons section, and enable "Toggle rulers for the page"
Edge:
- Open Settings (
Shift+?orF1) > Preferences > Scroll down to the Elements section, and enable "Show rulers on hover".
- Open Settings (
Cmd+,) > Elements > Enable "Show page rulers and node border lines"
- Press
Cmd/Ctrl+Gto toggle rulers on the top and left sides of all panes.
Can I see the tab order of the web page?
- In the Elements tab > Open the Accessibility pane on the right.
- Scroll down to the Source Order Viewer section, check the option "Show source order" to view the order of source elements on the screen.
- In the devtools panel open the Accessibility tab.
- Select the checkbox "Show Tabbing Order" to highlight the tab order on the web page.
Edge:
- In the Elements tab > Open the Accessibility pane on the right.
- Scroll down to the Source Order Viewer section, check the option "Show source order" to view the order of source elements on the screen.
- Open DevTools panel (
Cmd/Ctrl+Shift+P) > Info > Outline. Select "Focus Order" from the dropdown menu at the top. - Click "Show Overlay" to visualize the tab order in each pane. tab order that goes against the reading direction is marked in red.
Can I simulate different color blindness conditions to test my web page?
- In the Accessibility panel, from the toolbar open the Simulate menu and select the type of deficiency to simulate the page for the users with that deficiency.
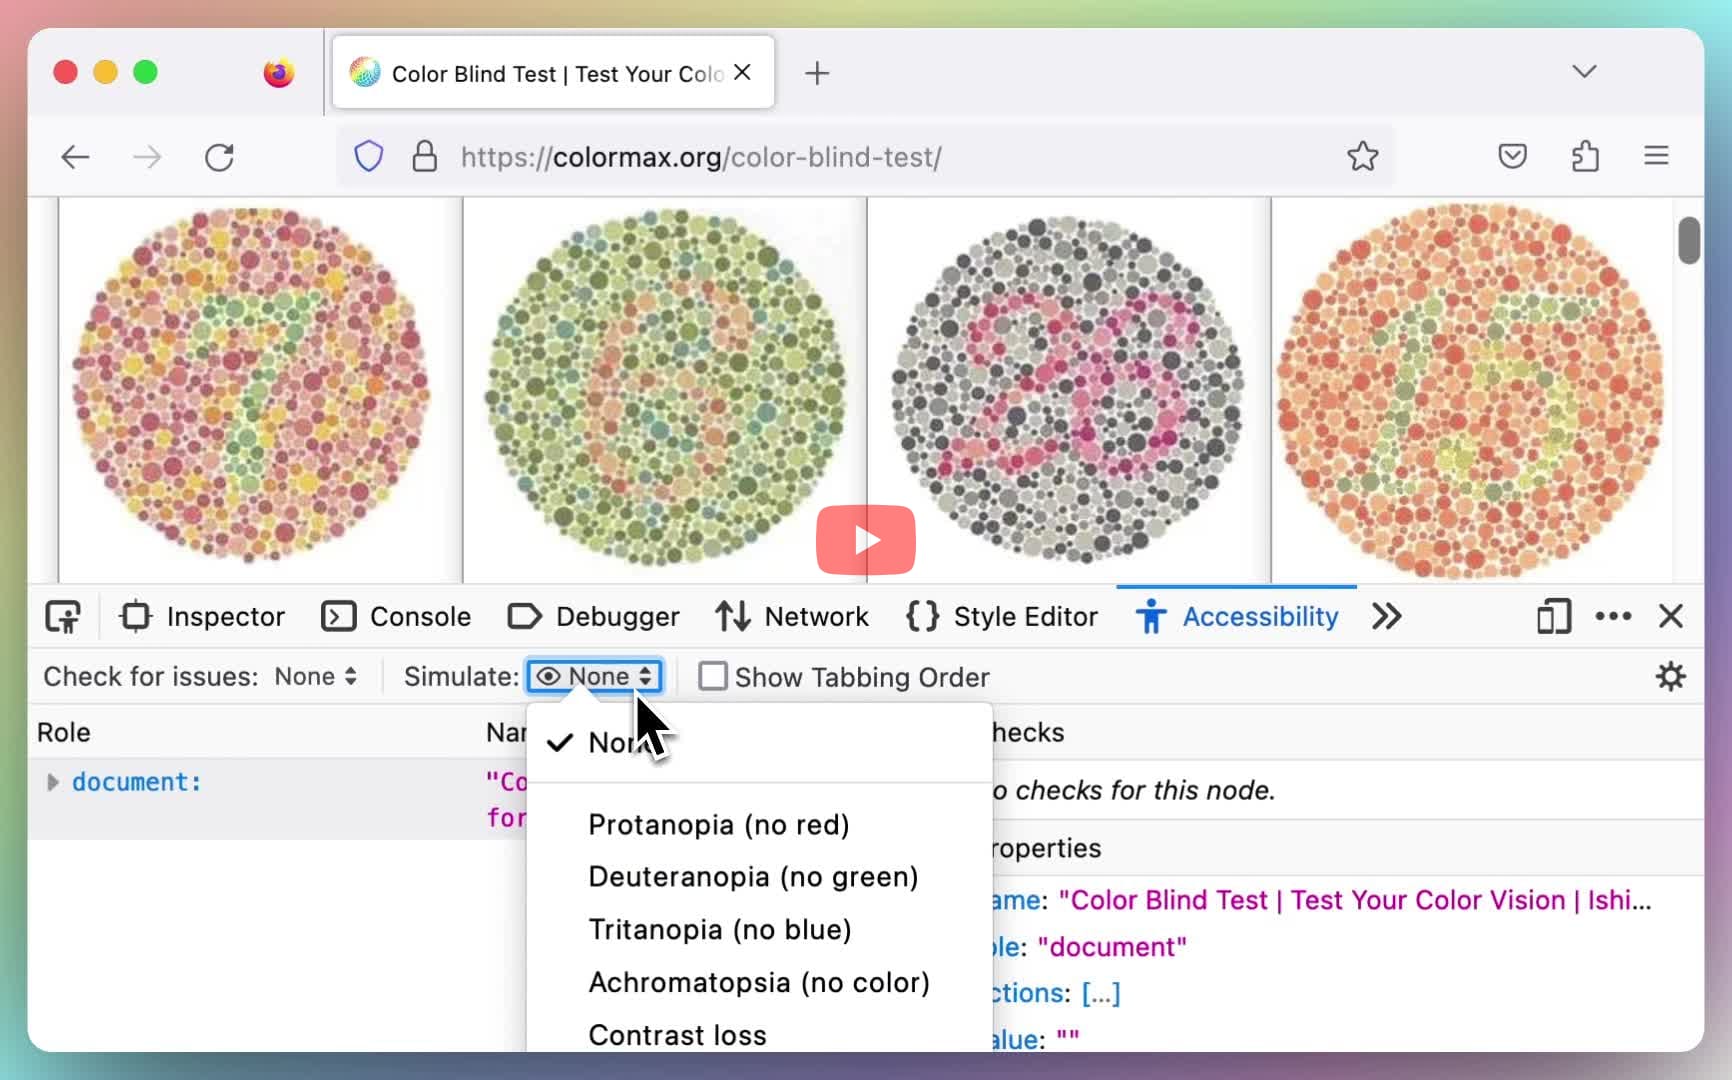
- Click the Debug tools icon to open the list of available debug tools. Switch to the Simulators tab to find various color blindness conditions like, Red-green, Blue-yellow, and Full color blindness. Toggle the conditions to simulate the deficiency on the page.
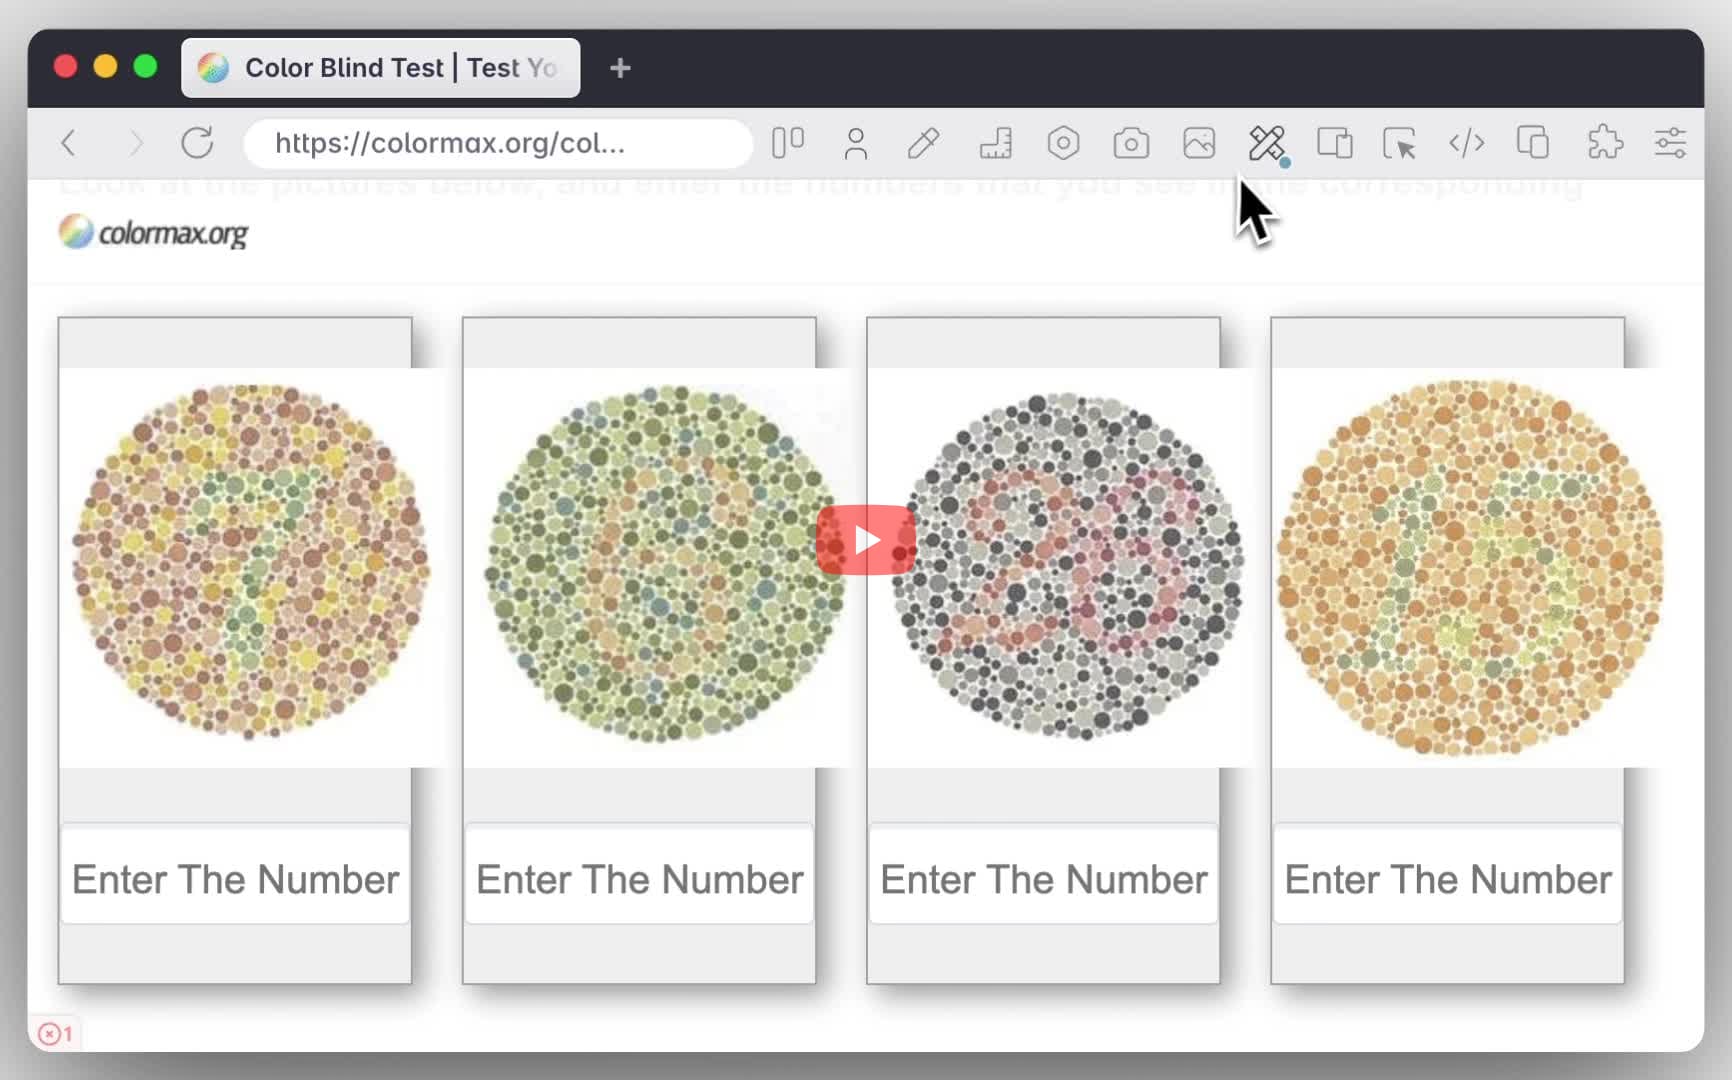
Can I simulate device orientation to mock built-in accelerometer, gyroscope & compass?
- Open Command Menu (
Cmd+Shift+PorCtrl+Shift+P) > Run "Show Sensors" > PressEnter. This will open the Sensors drawer at the bottom of the Devtools panel. - From the Orientations list, select a preset orientation or drag the device to set custom orientation.
Edge:
- Open Command Menu (
Cmd+Shift+PorCtrl+Shift+P) > Run "Show Sensors" > PressEnter. This will open the Sensors drawer at the bottom of the Devtools panel. - From the Orientations list, select a preset orientation or drag the device to set custom orientation.
- Open Change Media and Emulation settings of a pane and go to the "Emulation" tab
- Toggle the Orientation events switch to enable/disable device orientation simulation.
Can I simulate force touch to test touch events on the website?
- Open Command Menu (
Cmd+Shift+PorCtrl+Shift+P) > Run "Show Sensors" > PressEnter. This will open the Sensors drawer at the bottom of the Devtools panel. - Under the Touch drop-down list, select Force touch > Reload Devtools.
Can I apply style to the log statements in the console?
- Open console using
Cmd+Option+JorCtrl+Shift+J. - Prefix the log statement with
%c, and supply the CSS styles as the second argument toconsole.log(). For example,
console.log(
  "%cThis is green text with yellow background",
  "color:green; background:yellow"
)
- Open console using
Cmd+Option+JorCtrl+Shift+J. - Prefix the log statement with
%c, and supply the CSS styles as the second argument toconsole.log()
For example,
console.log(
  "%cThis is green text with yellow background",
  "color:green; background:yellow"
)
Edge:
- Open console (
Cmd+Option+JorCtrl+Shift+J). - Prefix the log statement with
%c, and supply the CSS styles as the second argument toconsole.log()
For example,
console.log(
  "%cThis is green text with yellow background",
  "color:green; background:yellow"
)
- Open console (
Cmd+Option+JorCtrl+Shift+J). - Prefix the log statement with
%c, and supply the CSS styles as the second argument toconsole.log()
For example,
console.log(
  "%cThis is green text with yellow background",
  "color:green; background:yellow"
)
- Open console
- Prefix the log statement with
%c, and supply the CSS styles as the second argument toconsole.log(). For example,
console.log(
  "%cThis is green text with yellow background",
  "color:green; background:yellow"
)
Can I target iframes while debugging from the Console panel?
- In the Console panel, click the "top" menu, and select the iframe to target in the Console.
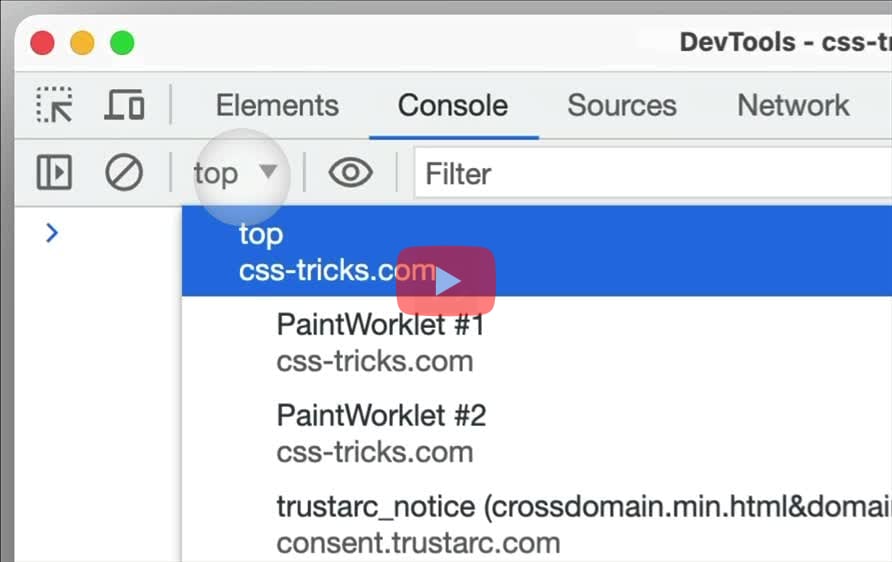
- In the Console panel, click the "iframe context picker button" (top right) to launch a popup listing all the iframes in the document (including the main document).
- Select the iframe to target in the Console. (Note: The button is only displayed if the page includes iframes!)
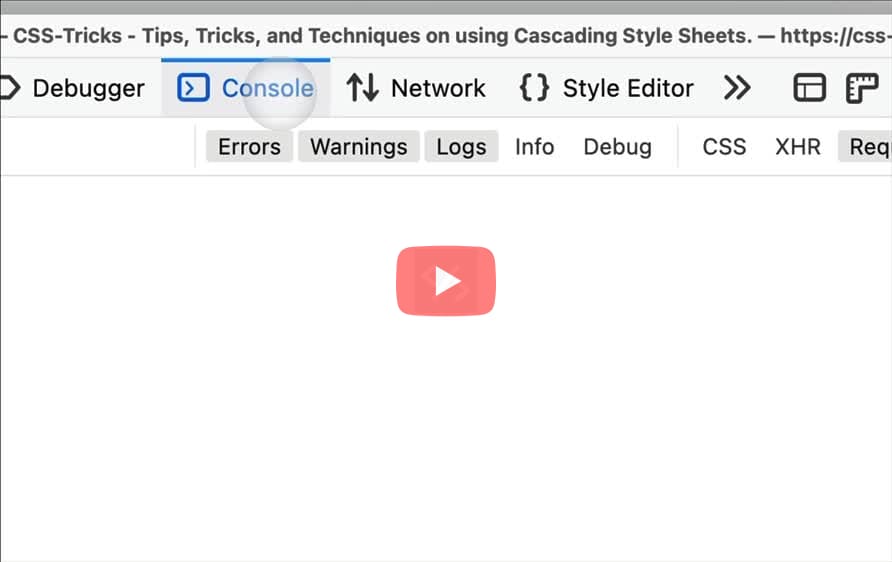
Edge:
- In the Console panel, click the "top" menu, and select the iframe to target in the Console.
- In the Console panel, select the target iframe from the "Execution context for $0" dropdown (bottom-right).
Can I test the Back/Forward cache of a web app?
Can I throttle CPU speed to simulate slower devices?
- In the Performance panel, open Settings using the gear icon and select the "CPU: No throttling" dropdown to choose "4x/6x slowdown".
Edge:
- In the Performance panel, open Settings using the gear icon and select the "CPU: No throttling" dropdown to choose "4x/6x slowdown."
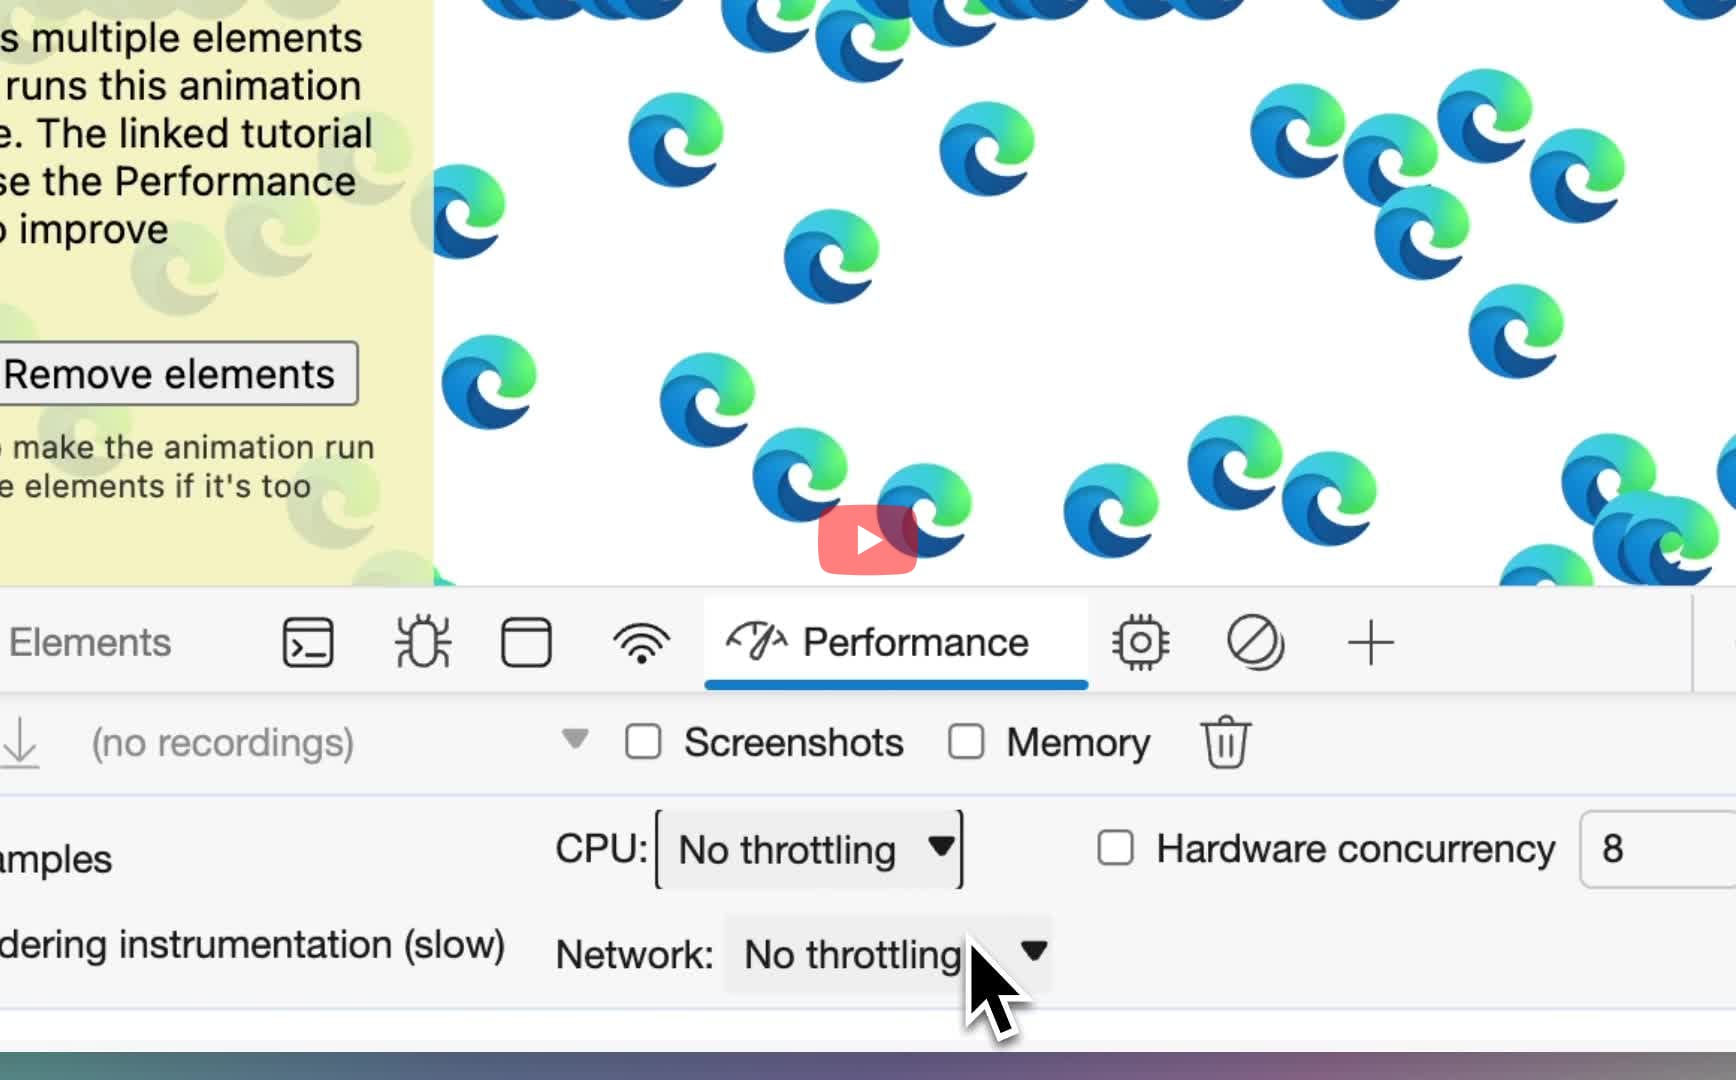
Can I throttle CSS animation playback speed?
- Inspect the element with CSS
animationproperty applied. - Open the Command Menu (
Cmd+Shift+PorCtrl+Shift+P) > Run "Show Animations (Drawer)". - Use the buttons (100%, 25%, 10%) to throttle the playback speed of the CSS animation live.
Can I throttle network speed to simulate slower network connections like 2G, 3G etc.,?
- In Network > Click the dropdown "No Throttling" and select a value to throttle the network speed.
- In Network > Click the dropdown "No Throttling" and select a value to throttle the network speed.
Edge:
- In Network > Click the dropdown "No Throttling" and select a value to throttle the network speed.
- Open Change Media and Emulation settings of a pane and go to the "Network" tab
- Toggle the Throttle network speed switch to Fast 3G, Slow 3G or Offline.
Can I toggle the element state like hover, visited, focus etc.,?
- Inspect an element > In the Styles pane (next to the DOM tree), click the
:hovbutton next to the Filter box. - Use the checkboxes to force the element state to any of the listed pseudo classes to view the corresponding CSS applied.
- Inspect an element > In the Styles pane (next to the DOM tree), click the
:hovbutton next to the Filter box. - Use the checkboxes to force the element state to any of the listed pseudo classes to view the corresponding CSS applied.
Edge:
- Inspect an element > In the Styles pane (next to the DOM tree), click the
:hovbutton next to the Filter box. - Use the checkboxes to force the element state to any of the listed pseudo classes to view the corresponding CSS applied.
- Inspect an element > Make sure the node is selected in the DOM Tree.
- In the styles section (next to the DOM tree), right at the top toolbar, you'll find checkboxes for different pseudo states, which you can toggle to view the corresponding CSS.
Can I switch to light or dark theme in devtools?
Chrome:
Open Command Menu (Cmd/Ctrl+Shift+P) & Run > "Switch to light/dark theme" (Appearance) > Press Enter.
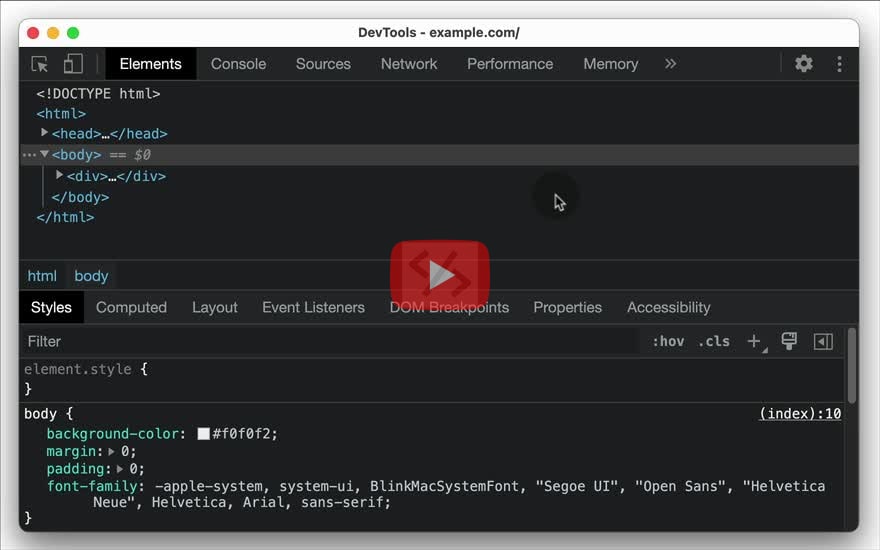
- Open Settings (
F1) > Under the Themes section, select "Dark" or "Light" to switch themes.
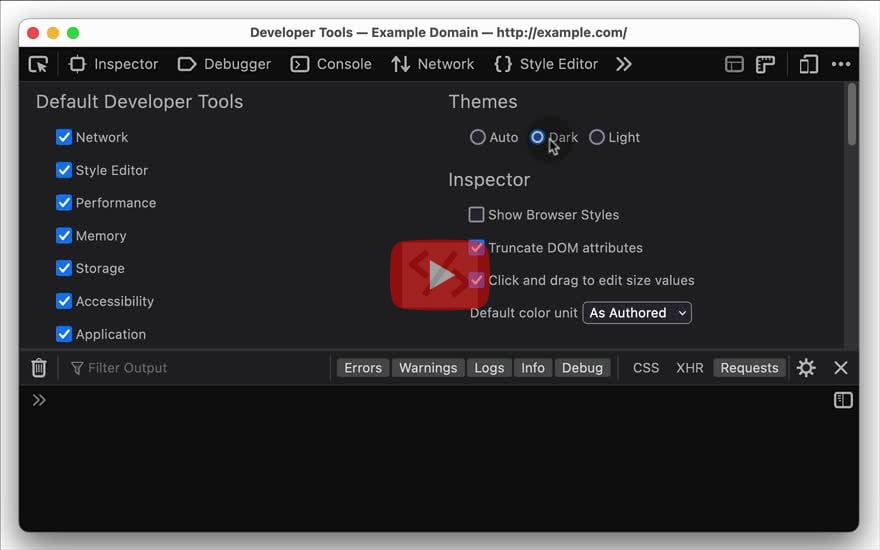
Edge:
Open Command Menu (Cmd/Ctrl+Shift+P) & Run > "Switch to light/dark theme" (Appearance) > Press Enter.
Safari:
Open Settings (Cmd+,) > General > Appearance > Select "Dark" or "Light" to change the appearance.
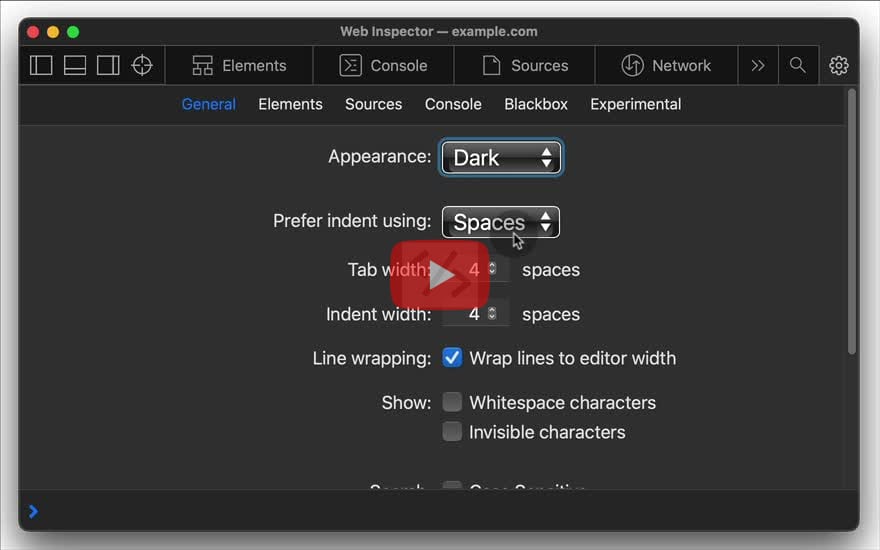
Polypane:
Press Cmd/Ctrl+I or select "Toggle Dark Mode" in the "View" Menu.
Can I use Display P3 color format?
- Right click on the color box > Select "Convert to Display-P3". This will change the color format to `display-p3`.
- Click the color box to open the color swatch. The white line shows the edge of sRGB. Everything on its top right is Display-P3 colors not available in sRGB.
- For fallback, right click on the color box, and select "Clamp to sRGB" to convert to the closest available color in the sRGB space.
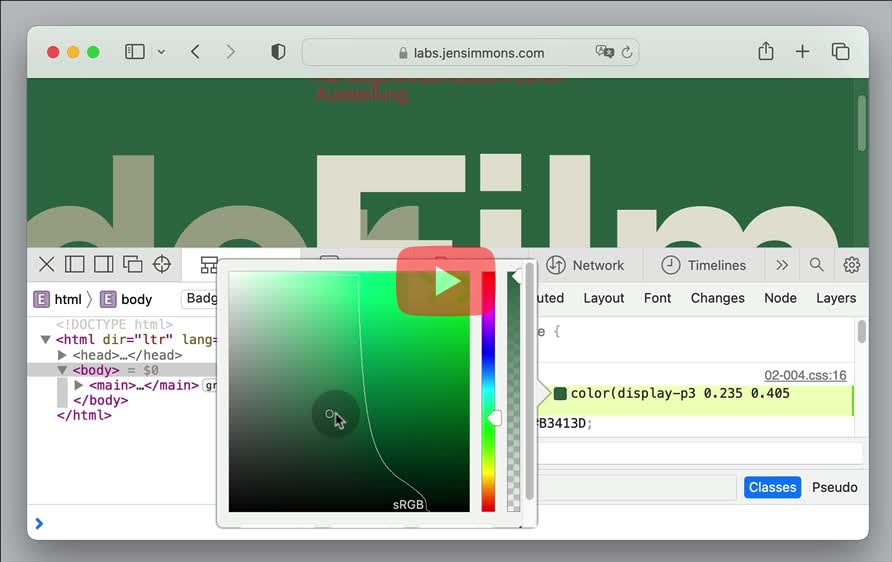
Can I use the easing editor to edit transitions and animations?
- Inspect the element with CSS transition or animation applied. In the Styles pane, click the icon next to the timing function to open the Easing editor to play around with the timing functions.
- Click anywhere on the line to add a control point. Drag the point to change the easing of the animation. Double click on the point to remove it.
- Inspect the element with CSS transition or animation applied. In the Rules pane, click the icon next to the timing function to open the Timing editor to play around with the timing functions.
Edge:
- Inspect the element with CSS transition or animation applied. In the Styles pane, click the icon next to the timing function to open the Easing editor to play around with the timing functions.
- Click anywhere on the line to add a control point. Drag the point to change the easing of the animation. Double click on the point to remove it.
- Inspect the element with CSS transition or animation applied. In the styles section, click the icon next to the timing function to open the Cubic-bezier editor to play around with the timing functions.
Can I watch JavaScript values in real time with Live Expressions?
- In the Console panel, click the Create live expression icon. Input the expression in the text box and press
Enter. - The value below the pinned expression is its result. The result updates every 250ms.
- For a multi-line expression, start a new line using
Shift+Enter. - To use multiple live expressions, click the same icon again to add a new expression. To remove the expression, click the
Xbutton next to it.
Edge:
- In the Console panel, click the Create live expression icon. Input the expression in the text box and press
Enter. - The value below the pinned expression is its result. The result updates every 250ms.
- For a multi-line expression, start a new line using
Shift+Enter. - To use multiple live expressions, click the same icon again to add a new expression. To remove the expression, click the
Xbutton next to it.
Can I use a type profiler to identify the types inferred by the engine?
- In the Sources panel, open the script from the left sidebar. Click the
Ticon in the top-right of the main toolbar to enable the type profiler
Can I view the accessibility tree?
- Inspect > Open the Accessibility pane on the right (Click the >> icon to show more tabs, if hidden) > Check "Enable full-page accessibility tree" > Reload Devtools.
- Click on the floating icon in the top right in the Elements panel which says, "Switch to Accessibility tree view".
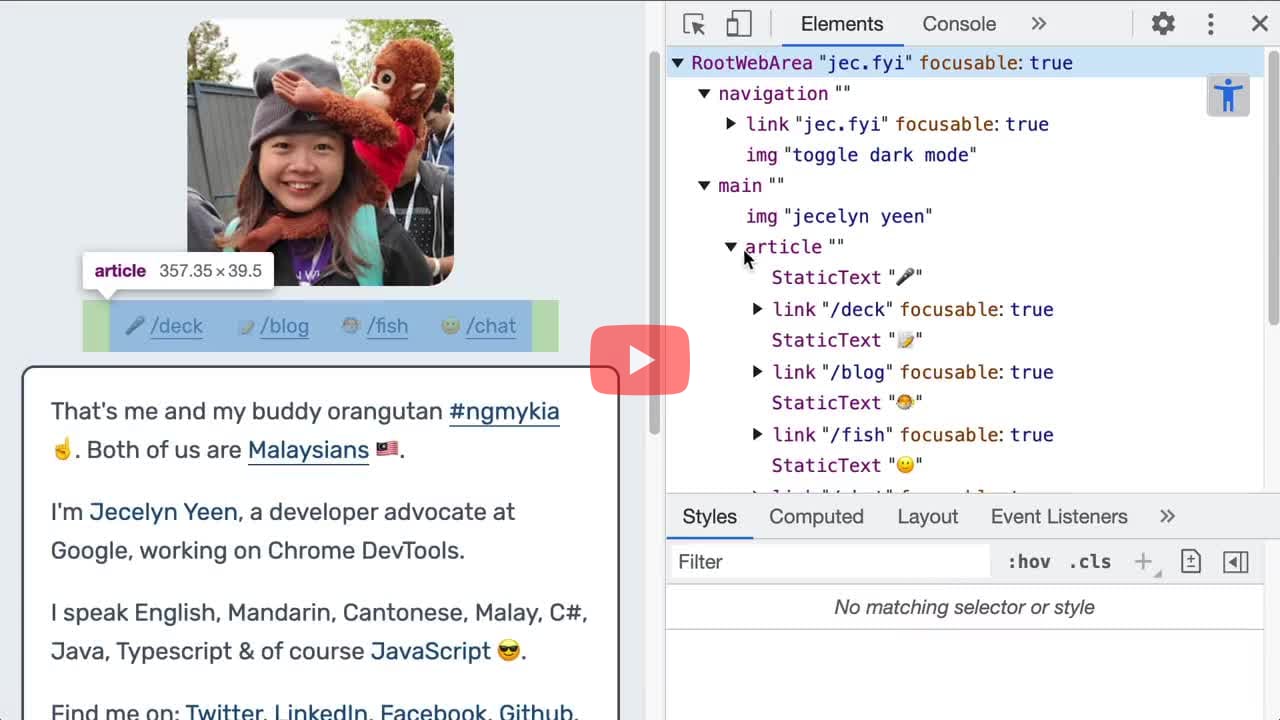
- Open devtools > Accessibility (Click >> icon to open more tabs if hidden).
- The main section shows the accessibility tree under the Role section.
Edge:
- Inspect > Elements > Open the Accessibility pane on the right (Click the >> icon to show more tabs, if hidden) > Check "Enable full-page accessibility tree" > Reload Devtools.
- Click on the floating icon in the top right in the Elements panel which says, "Switch to Accessibility tree view".
Can I view ARIA attributes of an element?
- Inspect the element in the DOM tree.
- Click on the Accessibility tab (It maybe hidden behind the "More Tabs" button). Scroll down to the section which says, "ARIA Attributes".
- Right click on the element on the page and select "Inspect Accessibility Properties".
- This will open the Accessibility tab. The ARIA attributes are available under the "Properties" panel on the right.
Edge:
- Inspect the element in the DOM tree.
- Click on the Accessibility tab (It maybe hidden behind the "More Tabs" button). Scroll down to the section which says, "ARIA Attributes".
- Inspect the element > Click the Node pane next to the DOM node.
- Scroll down to the Accessibility section, expand to see all the ARA attributes for the selected node.
- Inspect the element in the DOM tree.
- Click on the "A11y" tab. All "ARIA Attributes" are listed here.
Can I inspect CSS cascade layers?
- Inspect the element that is part of the
@layer. In the Styles pane, each layer and its corresponding styles are visible. - Clicking on the layer name will reveal the CSS layers section at the top which will contain the layer order, that drives the specificity.
- Inspect the element that is part of the
@layer. In the Styles pane, each layer and its corresponding styles are visible.
Edge:
- Inspect the element that is part of the
@layer. In the Styles pane, each layer and its corresponding styles are visible. - Clicking on the layer name will reveal the CSS layers section at the top which will contain the layer order, that drives the specificity.
- Inspect the element that is part of the
@layer. In the Styles pane, each layer and its corresponding styles are visible.
- Inspect the element that is part of the
@layer. In the Styles pane, each layer and its corresponding styles are visible.
Can I view computed styles?
- Inspect the element > Navigate to the Computed tab in the panel next to the DOM tree.
- Click the "Show All" checkbox to see all the inherited values.
- Inspect the element > Navigate to the Computed tab in the panel next to the DOM tree.
- Click the "Browser Styles" checkbox to see all the values inherited from the user agent.
Edge:
- Inspect the element > Navigate to the Computed tab in the panel next to the DOM tree.
- Click the "Show All" checkbox to see all the inherited values.
- Inspect the element > Navigate to the Computed tab in the panel next to the DOM tree.
- Click the filter icon > Select "Show All" to see all the inherited values.
- Inspect the element > Navigate to the Computed tab in the panel next to the "Style" tab.
- Click the "Show All" checkbox to see all the inherited values.
Can I view and copy the CSS changes applied to an element?
- In the Rules pane, apply changes to the CSS declarations, and then click on the Changes pane to see the diff. Click "Copy All Changes" button to copy the modified styles, with previous declaration automatically commented.
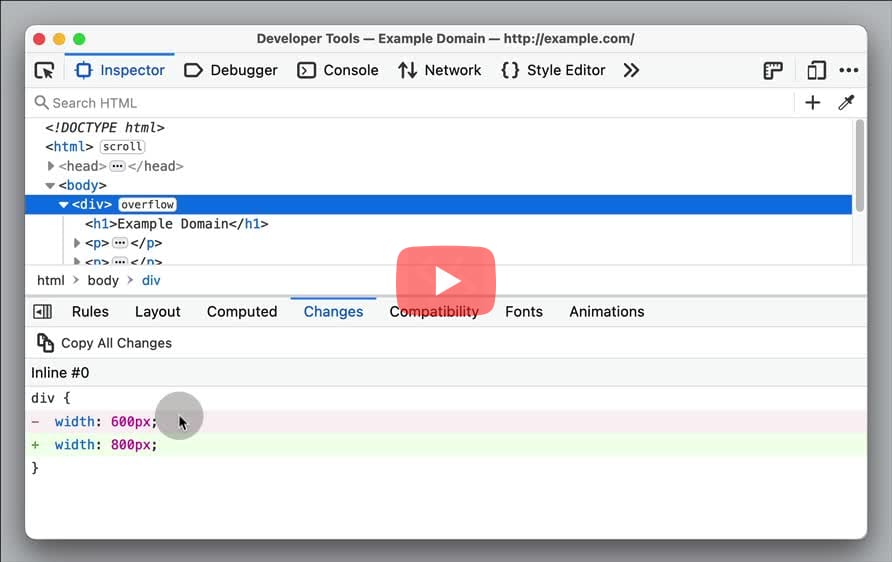
- In the Styles pane, apply changes to the CSS declarations, and then click on the Changes pane to see the diff.
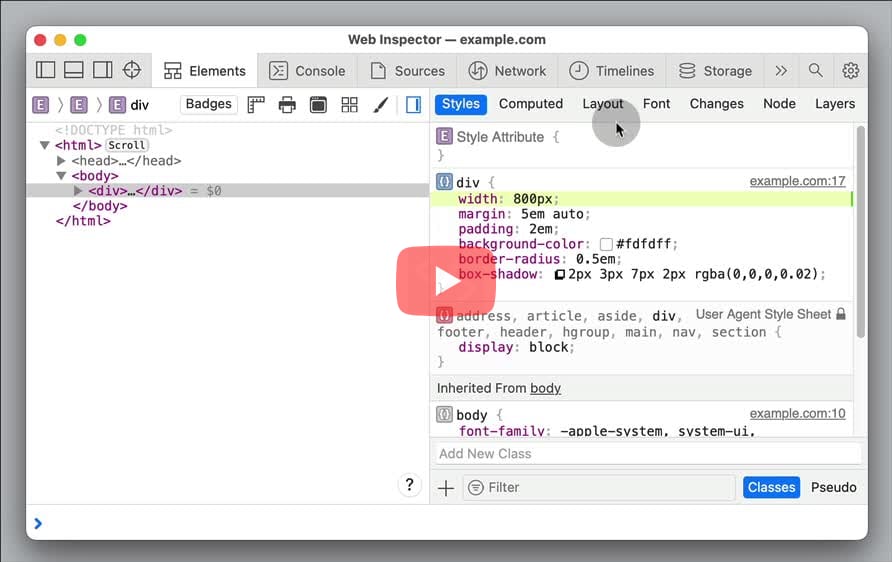
Can I view the human readable text of the HTTP status codes?
- In the Network panel, click to open the network request. In the Headers tab, under General, contains the HTTP status code along with the human readable text.
Edge:
- In the Network panel, click to open the network request. In the Headers tab, under General, contains the HTTP status code along with the human readable text.
Can I view a web page in 3D?
- Open Command Menu (
Cmd+Shift+PorCtrl+Shift+P) > Run > Show Layers. This will open a new tab called Layers. - For developers, it is useful to visualise a web page in three dimensions to,
- Find out how complex a web page is
- Spot out-of-viewport elements
- Debug z-index stacking issues
- Debug performance issues with composite layers
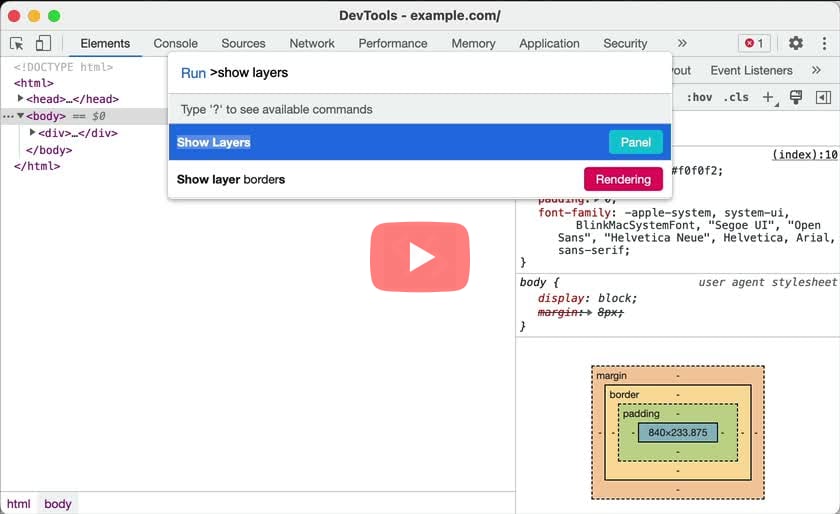
Edge:
- In the devtools, open the Command Menu using,
Cmd+Shift+PorCtrl+Shift+P.Search for "Show 3D View" and pressEnter. - This will open the 3D View drawer next to the Console. For developers, it is useful to visualise a web page in three dimensions to,
- Find out how complex a web page is
- Spot out-of-viewport elements
- Debug z-index stacking issues
- Debug performance issues with composite layers
Can I view the styles applied to a pseudo element?
- Right click on the element and select "Inspect" (This will open the Elements panel in the devtools with selected element highlighted in the DOM tree).
- The CSS applied to the element is visible in the "Styles" tab, adjacent to the DOM tree.
- Right click on the element and select "Inspect" (This will open the "Inspector" panel in the devtools with selected element highlighted in the DOM tree).
- The CSS applied to the element is visible in the panel, adjacent to the DOM tree.
Edge:
- Right click on the element and select "Inspect". (This will open the Elements panel in the devtools with selected element highlighted in the DOM tree).
- The CSS applied to the element is visible in the "Styles" tab, adjacent to the DOM tree.
- Right click on the element and select "Inspect Element" (This will open the "Elements" panel in the devtools with selected element highlighted in the DOM tree).
- The CSS applied to the element is visible in the panel, adjacent to the DOM tree.
- Right click on the element and select "Inspect" (This will open the Elements panel in the devtools with selected element highlighted in the DOM tree).
- The CSS applied to the element is visible in the "Styles" tab, below the Element Navigator.
Can I view the size of the data transferred over the network?
- In the Network panel, the footer contains the size of the data transferred in Bytes. If a filter is applied, then it displays the size of the filtered resources followed by all the resources.
- In the Network panel, the footer contains the size of the data transferred in Bytes. If a filter is applied, then it displays the size of the filtered resources followed by all the resources.
Edge:
- In the Network panel, the footer contains the size of the data transferred in Bytes. If a filter is applied, then it displays the size of the filtered resources followed by all the resources.
- In the Network panel, the footer contains the size of the data transferred in Bytes. If a filter is applied, then it displays the size of the filtered resources.
Can I view the uncompressed size of a resources transferred over the network?
- In the Network panel, open Network settings and select Big request rows option. The uncompressed size of the resource is available in the Size column below the compressed size.
Edge:
- In the Network panel, open Network settings and select Big request rows option. The uncompressed size of the resource is available in the Size column below the compressed size.
Can I view the full URL path of the network requests?
- In the Network panel, open Network settings > Enable the Big request rows option to show the URL path under the resource name.
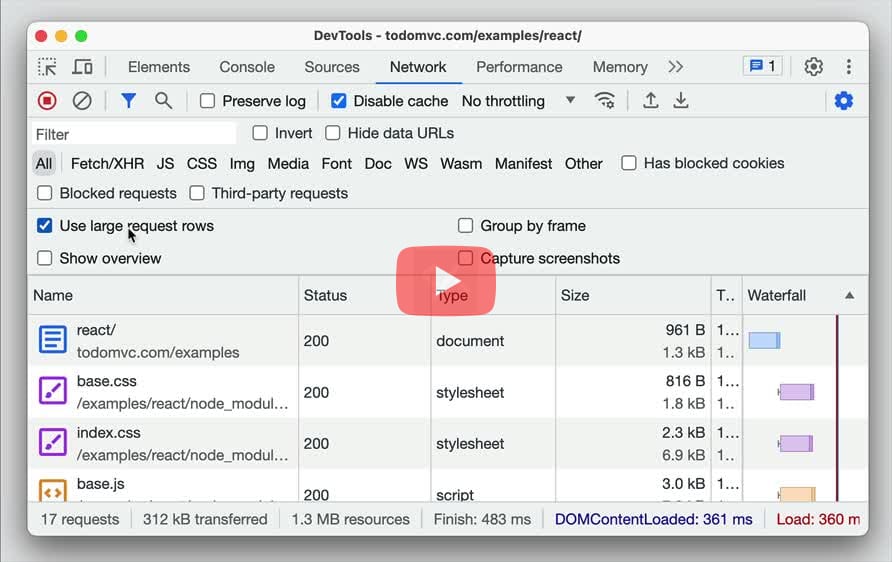
- In the Network panel, right click on the column header, and select URL. This will add a new column in the grid, which contains the full URL of the resource.
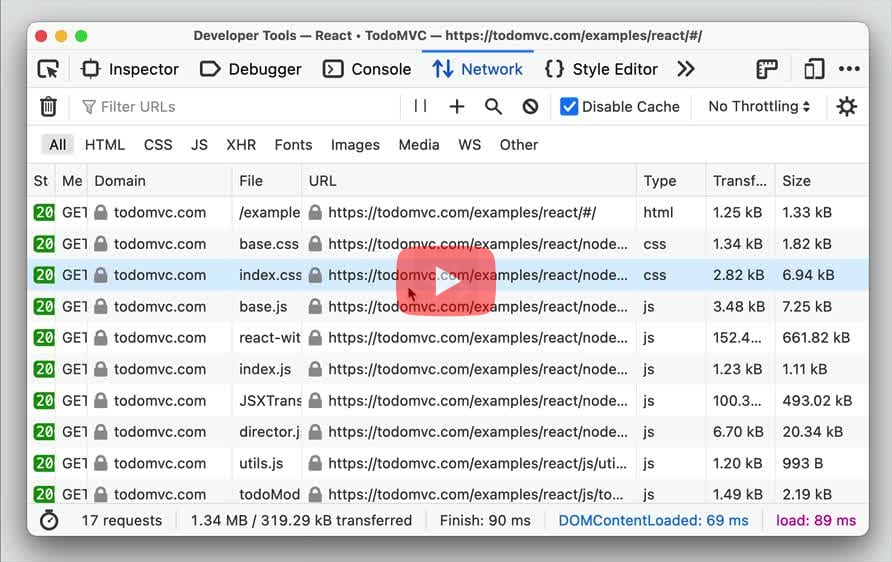
Edge:
- In the Network panel, open Network settings > Enable the Big request rows option to show the URL path under the resource name.
- In the Network panel, right click on the column header, and select "Path" to add a new column showing the URL path for the resource.
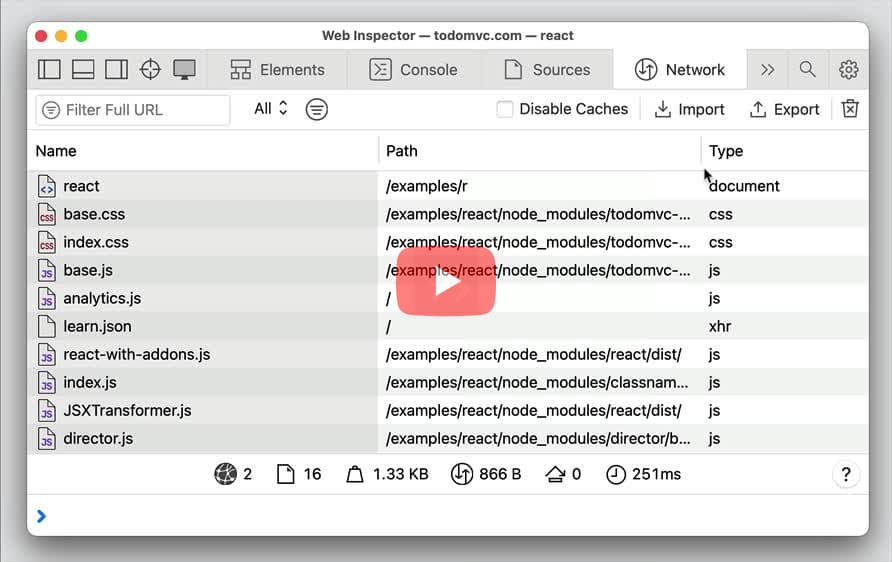
Can I zoom in and out of the devtools panel?
- In Developer Tools > Open Command Menu (
Cmd+Shift+PorCtrl+Shift+P) and Run > "Zoom in" orCmd+orCtrl+to increase the zoom level. - Run > "Zoom out" or
Cmd-orCtrl-to decrease the zoom level. - Run > "Reset zoom level" or
Cmd+0orCtrl+0to reset the zoom level.
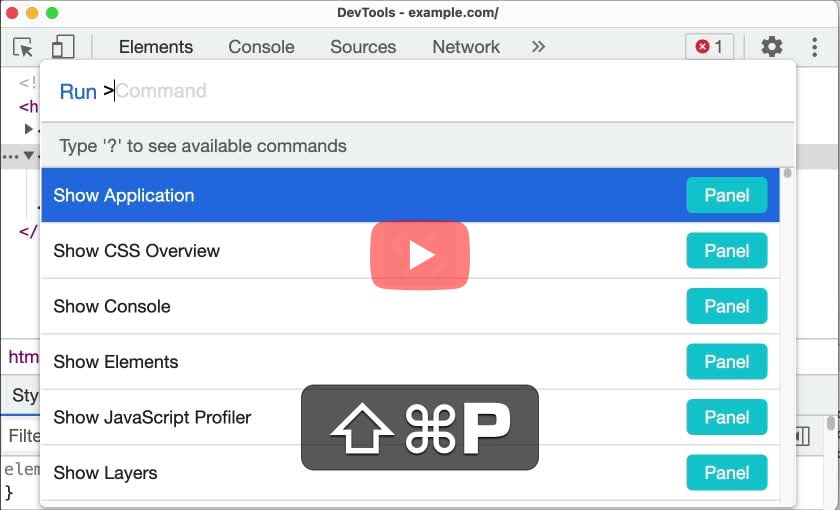
- In Web Developer Tools > Use
Cmd+orCtrl+to increase the zoom level. UseCmd-orCtrl-to decrease the zoom level. To reset the zoom level, pressCtrl+0orCmd+0.
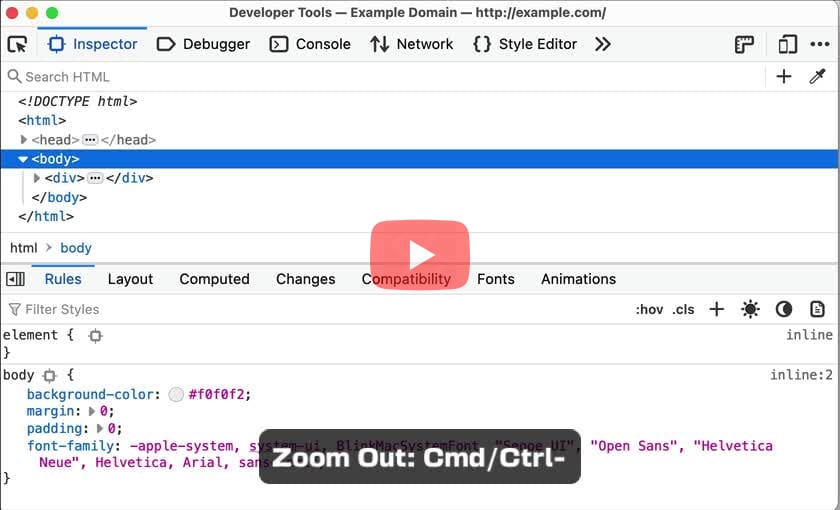
Edge:
- In Developer Tools > Open Command Menu (
Cmd+Shift+PorCtrl+Shift+P) and Run > "Zoom in" orCmd+orCtrl+to increase the zoom level. - Run > "Zoom out" or
Cmd-orCtrl-to decrease the zoom level. - Run > "Reset zoom level" or
Cmd+0orCtrl+0to reset the zoom level.
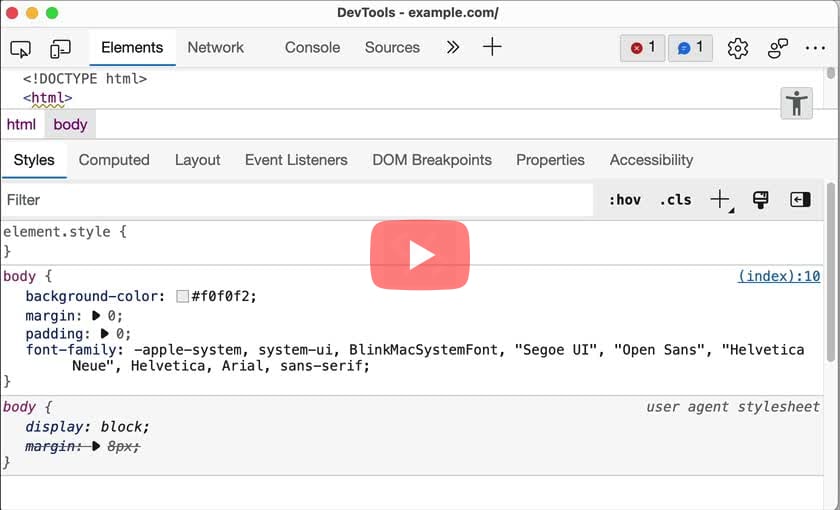
- In Web Inspector > Use
Cmd+orCtrl+to increase the zoom level. UseCmd-orCtrl-to decrease the zoom level. To reset the zoom level, pressCtrl+0orCmd+0. - (Or) Settings (
Cmd,) > General > Zoom.