A Python package for reconstructing the shape of a 2D point cloud on the plane.
Given a finite set of points (or point cloud) in the Euclidean plane, alpha shapes are members of a family of closed polygons on the 2D plane associated with the shape of this point cloud. Each alpha shape is associated with a single non negative parameter α.
Intuitively an alpha shape can be conceptualized as follows. Imagine carving out the plane using a cookie scoop of radius 1/α, without removing any of the points in the point cloud. The shape that remains is the shape of the point cloud. If we replace the arc-like edges, due to the circular rim of the scoop, with straight segments, we are left with the alpha shape of parameter α.
pip install alpha_shapesimport matplotlib.pyplot as plt
from alpha_shapes import Alpha_Shaper, plot_alpha_shapeDefine a set of points. Care must be taken to avoid duplicate points:
points = [(0.,     0.),    (0.,    1.),    (1.,     1.1),
          (1.,     0.),    (0.25,  0.15),  (0.65,   0.45),
          (0.75,   0.75),  (0.5,   0.5),   (0.5,    0.25),
          (0.5,    0.75),  (0.25,  0.5),   (0.75,   0.25),
          (0.,     2.),    (0.,    2.1),   (1.,     2.1),
          (0.5,    2.5),   (-0.5,  1.5),   (-0.25,  1.5),
          (-0.25,  1.25),  (0,     1.25),  (1.5,    1.5),
          (1.25,   1.5),   (1.25,  1.25),  (1,      1.25),
          (1.,    2.),    (0.25,   2.15),
          (0.65,   2.45),  (0.75,  2.75),  (0.5,    2.25),
          (0.5,    2.75),  (0.25,  2.5),   (0.75,   2.25)]
Create the alpha shaper
shaper = Alpha_Shaper(points)For the alpha shape to be calculated, the user must choose a value for the alpha parameter.
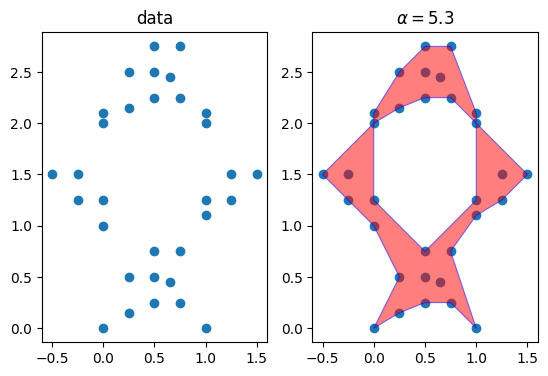
Here, let us set alpha to 5.3:
# Calculate the shape
alpha = 5.3
alpha_shape = shaper.get_shape(alpha=alpha)
Visualize the result:
fig, (ax0, ax1) = plt.subplots(1, 2)
ax0.scatter(*zip(*points))
ax0.set_title('data')
ax1.scatter(*zip(*points))
plot_alpha_shape(ax1, alpha_shape)
ax1.set_title(f"$\\alpha={alpha:.3}$")

for ax in (ax0, ax1):
    ax.set_aspect('equal')
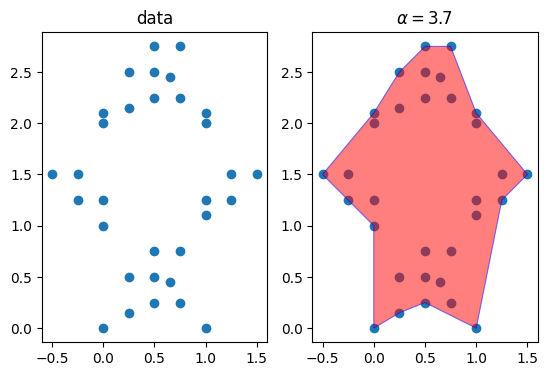
Good results depend on a successful choise for the value of alpha. If for example we choose a smaller value, e.g.
# Calculate the shape for smaller alpha
alpha = 3.7
alpha_shape = shaper.get_shape(alpha=alpha)

fig, (ax0, ax1) = plt.subplots(1, 2)
ax0.scatter(*zip(*points))
ax0.set_title('data')
ax1.scatter(*zip(*points))
plot_alpha_shape(ax1, alpha_shape)
ax1.set_title(f"$\\alpha={alpha:.3}$")

for ax in (ax0, ax1):
    ax.set_aspect('equal')
We find out that the hole is no longer there.
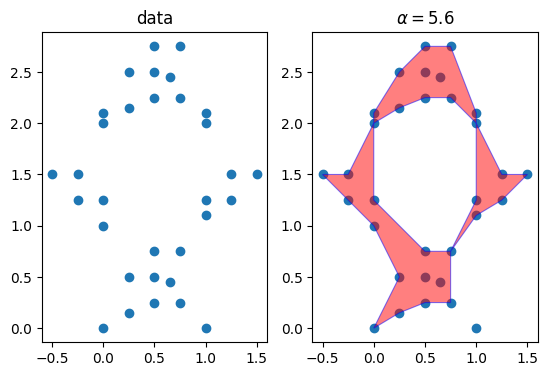
On the other hand, for larger alpha values, e.g.
# Calculate the shape for larger alpha
alpha = 5.6
alpha_shape = shaper.get_shape(alpha=alpha)

fig, (ax0, ax1) = plt.subplots(1, 2)
ax0.scatter(*zip(*points))
ax0.set_title('data')
ax1.scatter(*zip(*points))
plot_alpha_shape(ax1, alpha_shape)
ax1.set_title(f"$\\alpha={alpha:.3}$")

for ax in (ax0, ax1):
    ax.set_aspect('equal')
We find out that mabe we have cut out too much. The point on the bottom right is no longer incuded in the shape
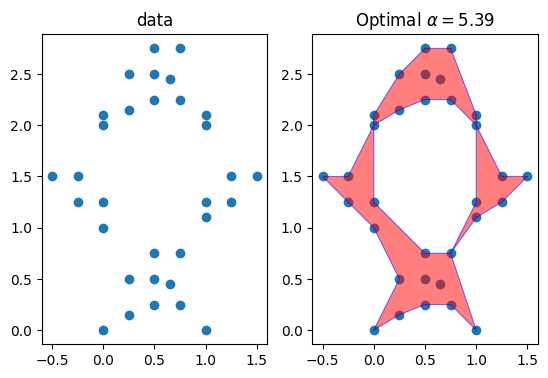
A satisfactory calculation of the alpha shape requires a successful guess of the alpha parameter. While trial and error might work well in some cases, users can let the Alpha_Shaper choose a value for them. That is what the optimize method is about. It calculates the largest possible value for alpha, so that no points from the point cloud are left out.
alpha_opt, alpha_shape = shaper.optimize()
alpha_opt
5.391419185032161
fig, (ax0, ax1) = plt.subplots(1, 2)
ax0.scatter(*zip(*points))
ax0.set_title('data')
ax1.scatter(*zip(*points))
plot_alpha_shape(ax1, alpha_shape)
ax1.set_title(f"Optimal $\\alpha={alpha_opt:.3}$")

for ax in (ax0, ax1):
    ax.set_aspect('equal')
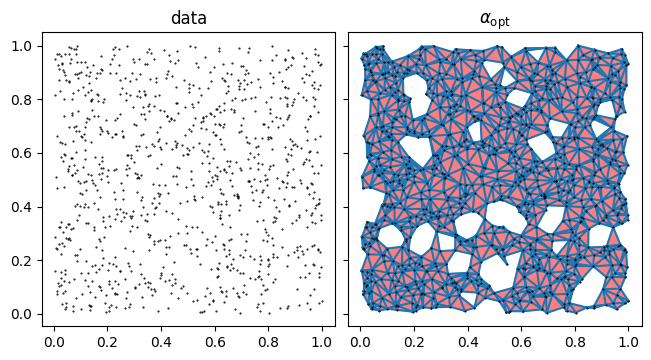
The optimize method runs efficiently for relatively large point clouds. Here we calculate the optimal alpha shape of an ensemble of 1000 random points uniformly distributed on the unit square.
from time import time
import numpy as np

np.random.seed(42)  # for reproducibility

#  Define a set of random points
points = np.random.random((1000, 2))
# Prepare the shaper
alpha_shaper = Alpha_Shaper(points)

# Estimate the optimal alpha value and calculate the corresponding shape
ts = time()
alpha_opt, alpha_shape = alpha_shaper.optimize()
te = time()
print(f'optimization took: {te-ts:.2} sec')

fig, axs = plt.subplots(1,
                        2,
                        sharey=True,
                        sharex=True,
                        constrained_layout=True)

for ax in axs:
    ax.plot(*zip(*points),
            linestyle='',
            color='k',
            marker='.',
            markersize=1)

    ax.set_aspect('equal')

_ = axs[0].set_title('data')

plot_alpha_shape(axs[1], alpha_shape)
axs[1].triplot(alpha_shaper)
_ = axs[1].set_title(r'$\alpha_{\mathrm{opt}}$')
optimization took: 0.081 sec
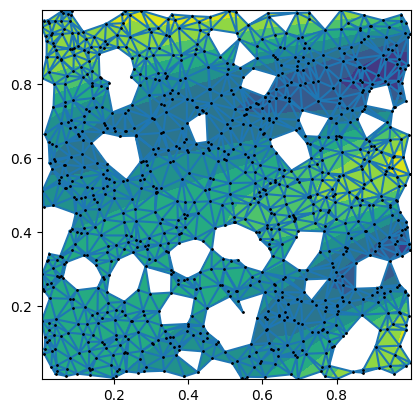
The Alpha_Shaper class implements the interface of matplotlib.tri.Triangulation. This means that it will work with algorithms that expect a triangulation as input (e.g. for contour plotting or interpolation)
#  Define a set of points

np.random.seed(42)  # for reproducibility

points = np.random.random((1000, 2))

x = points[:, 0]
y = points[:, 1]

z = x**2 * np.cos(5 * x * y - 8 * x + 9*y) + y**2 * np.sin(5 * x * y - 8 * x + 9*y)

# If the characteristic scale along each axis varies significantly,
# it may make sense to turn on the `normalize` option.
shaper = Alpha_Shaper(points, normalize=True)
alpha_opt, alpha_shape_scaled = shaper.optimize()

#  mask = shaper.set_mask_at_alpha(alpha_opt)

fig, ax = plt.subplots()

ax.tricontourf(shaper, z)
ax.triplot(shaper)
ax.plot(x, y, ".k", markersize=2)
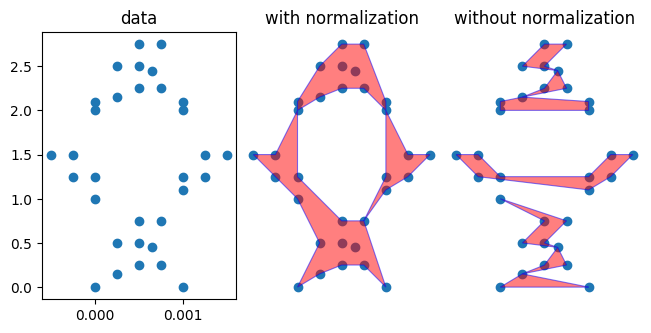
ax.set_aspect('equal')Before calculating the alpha shape, Alpha_Shaper normalizes by default the input points so that they are distributed on the unit square. When there is a scale separation along the x and y direction, deactivating this feature may yield surprising results.
#  Define a set of points
points = [
    (0.0, 2.1),
    (-0.25, 1.5),
    (0.25, 0.5),
    (-0.25, 1.25),
    (0.75, 2.75),
    (0.75, 2.25),
    (0.0, 2.0),
    (1.0, 0.0),
    (0.25, 0.15),
    (1.25, 1.5),
    (1.25, 1.25),
    (1.0, 2.1),
    (0.65, 2.45),
    (0.25, 2.5),
    (0.0, 1.0),
    (0.5, 0.5),
    (0.5, 0.25),
    (0.5, 0.75),
    (0, 1.25),
    (1.5, 1.5),
    (1.0, 2.0),
    (0.25, 2.15),
    (1.0, 1.1),
    (0.75, 0.75),
    (0.75, 0.25),
    (0.0, 0.0),
    (-0.5, 1.5),

    (1, 1.25),
    (0.5, 2.5),
    (0.5, 2.25),
    (0.5, 2.75),
    (0.65, 0.45),
]

# Scale the points along the x-dimension
x_scale = 1e-3
points = np.array(points)
points[:, 0] *= x_scale

#  Create the alpha shape without accounting for the x and y scale separation
unnormalized_shaper = Alpha_Shaper(points, normalize=False)
_, alpha_shape_unscaled = unnormalized_shaper.optimize()


# If the characteristic scale along each axis varies significantly,
# it may make sense to turn on the `normalize` option.
shaper = Alpha_Shaper(points, normalize=True)
alpha_opt, alpha_shape_scaled = shaper.optimize()


#  Compare the alpha shapes calculated with and without scaling.
fig, (ax0, ax1, ax2) = plt.subplots(
    1, 3, sharey=True, sharex=True, constrained_layout=True
)
ax0.scatter(*zip(*points))
ax0.set_title("data")
ax1.scatter(*zip(*points))
ax2.scatter(*zip(*points))

plot_alpha_shape(ax1, alpha_shape_scaled)

ax1.set_title("with normalization")
ax2.set_title("without normalization")
plot_alpha_shape(ax2, alpha_shape_unscaled)

for ax in (ax1, ax2):
    ax.set_axis_off()
for ax in (ax0, ax1, ax2):
ax.set_aspect(x_scale)This library is inspired by the alphashape library.
