Talaiot is a simple and extensible plugin targeting teams using Gradle Build System. It records the duration of your Gradle tasks helping to understand problems of the build and detecting bottlenecks. For every record, it will add additional information defined by default or custom metrics.
Some of the features are:
- Integration with Time/Series systems like InfluxDb, ElasticSearch and Prometheus.
- Extensible definition of metrics depending on the requirements.
- Definition of custom publishers
- Develop it entirely with Kotlin
- Generation Task Dependency Graph for the build
What is Talaiot?
"... while some certainly had a defensive purpose, the use of others is not clearly understood. Some believe them to have served the purpose of lookout or signalling towers..."
https://en.wikipedia.org/wiki/Talaiot
- Setup Plugin
- Snapshots
- Basic Configuration
- Talaiot Extension
- Example: Analyzing Data provided by Talaiot
- Other Plugins
- Docs
- Articles
- Contributing
- Contributors
- Thanks
Using the plugins DSL
plugins {
  id("com.cdsap.talaiot") version "1.2.0"
}
Using legacy plugin application:
buildscript {
  repositories {
    maven {
      url = uri("https://plugins.gradle.org/m2/")
    }
  }
  dependencies {
    classpath("com.cdsap:talaiot:1.2.0")
  }
}

apply(plugin = "com.cdsap.talaiot")
Using the plugins DSL:
plugins {
  id "com.cdsap.talaiot" version "1.2.0"
}
Using legacy plugin application:
buildscript {
  repositories {
    maven {
      url "https://plugins.gradle.org/m2/"
    }
  }
  dependencies {
    classpath "com.cdsap:talaiot:1.2.0"
  }
}

apply plugin: "com.cdsap.talaiot"
Include the OJO artifactory oss-snapshot local:
maven ( url = uri("http://oss.jfrog.org/artifactory/oss-snapshot-local") )
And the current Snapshot:
classpath("com.cdsap:talaiot:1.2.1-SNAPSHOT")
talaiot {
    publishers {
        influxDbPublisher {
            dbName = "tracking"
            url = "http://localhost:8086"
            taskMetricName = "task"
            buildMetricName = "build"
        }

    }
    filter {
        threshold {
            minExecutionTime = 10
        }
    }
}
This example adds the InfluxDbPublisher with the information of the InfluxDb Server where it will be posted the information tracked.
Additionally, we are disabling the metrics for Git and Performance.
| Property | Description |
|---|---|
| logger | Mode for logging (Silent,Info) |
| ignoreWhen | Configuration to ignore the execution of Talaiot |
| generateBuildId | Generation of unique identifier for each execution(disabled by default) |
| publishers | Configuration to define where to submit the information of the build |
| metrics | Additional information tracked during the execution of the task |
| filter | Rules to filter the build or the tasks to be reported |
In terms of publishing Talaiot includes some default Publishers, but at the same time you can extend it and create your publisher for your requirements
| Property | Description |
|---|---|
| OutputPublisher | Publish the results of the build on the console, this Publisher will only print the task name and duration |
| InfluxDbPublisher | Publish the results of the build to the InfluxDb database defined in the configuration |
| TaskDependencyGraphPublisher | Publish the results of the build using the dependency graph of the tasks executed |
| PushGatewayGraphPublisher | Publish the results of the build to the PushGateway server defined in the configuration |
| JsonPublisher | Publish the results of the build with a json format |
| TimelinePublisher | Publish the results of the build decomposed by the different workers used in the execution |
| ElasticSearchPublisher | Publish the results of the build to the ElasticSearch instance defined in the configuration |
| HybridPublisher | Publish the results of the build in two different publishers defined for tasks metrics and build metrics |
| RethinkDbPublisher | Publish the results of the build in the RethinkDb instance defined in the configuration |
Talaiot will send to the InfluxDb server defined in the configuration the values collected during the execution
| Property | Description |
|---|---|
| dbName | Name of the database |
| url | Url of the InfluxDb Server |
| taskMetricName | Name of the metric used for specific task in the execution |
| buildMetricName | Name of the metric used for the overall information of the build in the execution |
| username | username which is used to authorize against the influxDB instance (optional) |
| password | password for the username which is used to authorize against the influxDB (optional) |
| retentionPolicyConfiguration | retention policy which is used for writing points |
| publishBuildMetrics | Publish build metrics of the publisher, true by default |
| publishTaskMetrics | Publish tasks metrics of the publisher, true by default |
Retention Policy (RP) describes how long InfluxDB keeps data, how many copies of the data to store in the cluster,
and the time range covered by shard groups. RPs are unique per database and along with the measurement and tag set define a series.
Since version 1.0.0 we are including by default RP in all the operations included in the publisher. The RetentionPolicyConfiguration includes:
| Property | Description |
|---|---|
| name | name of the retentionPolicy(rp). Default rpTalaiot |
| duration | duration of the rp. Default 30d |
| shardDuration | the shardDuration. Default 30m |
| replicationFactor | the replicationFactor of the rp. Default 2 |
| isDefault | if the rp is the default rp for the database or not. Default false |
Example of custom RP Configuration:
influxDbPublisher {
  dbName = "xxxxxx"
  url = "xxxxxx"
  retentionPolicyConfiguration {
    name = "customRp"
    duration = "4w"
    shardDuration = "30m"
    replicationFactor = 1
    isDefault = true
  }
}
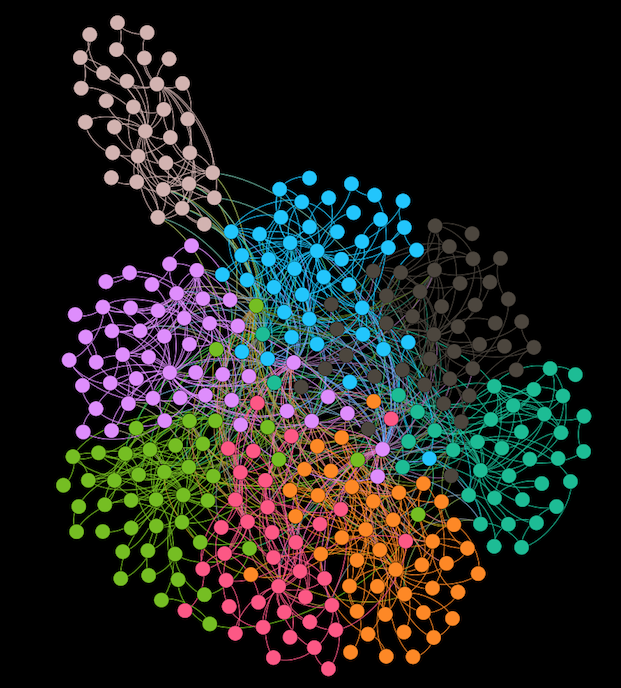
Talaiot will generate the Task Dependency Graph in the specific format specified in the configuration
| Property | Description |
|---|---|
| ignoreWhen | Configuration to ignore the execution of the publisher |
| html | Export the task dependency graph in Html format with support of vis.js |
| gexf | Export the task dependency graph in gexf format |
| dot | Export the task dependency graph in png format. See Graphviz |
This new category of publishers does not require constantly evaluating the builds, that's why there is an extra parameter configuration in the Publisher to ignore the execution unless there is some property enabled. Typical use case is use this publisher and collect the files on CI.
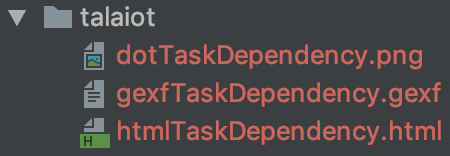
The output will be found "${project.rootDir}/talaiot:
Example:
Talaiot will send to the PushGateway server defined in the configuration the values collected during the execution.
| Property | Description |
|---|---|
| url | Url of the PushGateway Server |
| taskJobName | Name of the job required for the tasks metrics to be exported to Prometheus |
| buildJobName | Name of the job required for the build metrics to be exported to Prometheus |
| publishBuildMetrics | Publish build metrics of the publisher, true by default |
| publishTaskMetrics | Publish tasks metrics of the publisher, true by default |
Talaiot will Publish the results of the build with a json format .
    publishers {
        jsonPublisher = true

    }
Talaiot will create a PNG file with the detailed information in chronological order by task of the execution in the different workers.
    publishers {
        timelinePublisher = true

    }
Talaiot will send to the ElasticSearch server defined in the configuration the values collected for tasks and build metrics during the execution in the different workers.
| Property | Description |
|---|---|
| url | ElasticSearch server |
| taskIndexName | Name for the index used to report tasks metrics |
| buildIndexName | Name for the index used to report build metrics |
| publishBuildMetrics | Publish build metrics of the publisher, true by default |
| publishTaskMetrics | Publish tasks metrics of the publisher, true by default |
Example:
    publishers {
        elasticSearchPublisher {
          url = "http://localhost:9200"
          taskIndexName = "task"
          buildIndexName = "build"
        }
    }
This Publisher allows composition over publishers to report tasks and build metrics.
| Property | Description |
|---|---|
| taskPublisher | Publisher configuration used to publish tasks metrics |
| buildPublisher | Publisher configuration used to publish build metrics |
Example:
    publishers {
        hybridPublisher {
            taskPublisher = ElasticSearchPublisherConfiguration().apply {
                url = "http://localhost:9200"
                buildIndexName = "build"
                taskIndexName = "task"
            }

            buildPublisher = InfluxDbPublisherConfiguration().apply {
                dbName = "tracking"
                url = "http://localhost:8086"
                buildMetricName = "build"
                taskMetricName = "task"
            }
        }
    }
In this example we are using InfluxDbPublisher to report build metrics and ElasticSearchPublisher to report task metrics.
Talaiot will send to the RethinkDb server defined in the configuration the values collected during the execution
| Property | Description |
|---|---|
| dbName | Name of the database |
| url | Url of the RethinkDb Server |
| taskTableName | Name of the table used to track tasks information |
| buildTableName | Name of the table used to track the build information |
| username | username which is used to authorize against the RethinkDb instance (optional) |
| password | password for the username which is used to authorize against the RethinkDb (optional) |
| publishBuildMetrics | Publish build metrics of the publisher, true by default |
| publishTaskMetrics | Publish tasks metrics of the publisher, true by default |
Talaiot allows using custom Publishers defined by the requirements of your environment, in case you are using another implementation. Check here how to define a custom publisher
We can include extra information on the build and task tracked data during the build. This information will be added to the default metrics defined.
talaiot {
    metrics {
       customBuildMetrics ("versionApp" to $version)
       customTaskMetrics ("versionApp" to $version, "customProperty" to getCustomProperty())
    }
}
For every measurement done, Talaiot can filter the tasks tracked to be published. These filters don't apply to GraphPublishers:
| Property | Description |
|---|---|
| tasks | Configuration used to filter which tasks we want to exclude and include in the execution |
| module | Configuration used to filter which modules we want to exclude and include in the execution |
| threshold | Configuration used to define time execution ranges to filter tasks to be reported |
For every measurement done, Talaiot can completely skip publishing process. These filters affect all publishers:
| Property | Description |
|---|---|
| build.success | Configuration used to skip publishing based on build success. |
| build.requestedTasks | Configuration used to skip publishing based on what was the requested task. |
Example:
 filter {
     tasks {
         excludes = arrayOf("preDebugBuild", "processDebugResources")
     }
     modules {
         excludes = arrayOf(":app")
     }
     threshold {
         minExecutionTime = 10
     }
     build {
         success = true
         requestedTasks {
             includes = arrayOf(":app:assemble.*")
             excludes = arrayOf(":app:generate.*")
         }
     }
 }
| Property | Description |
|---|---|
| envName | Name of the Property |
| envValue | Value of the Property |
We will use IgnoreWhen when we want to ignore publishing the results of the build. One use case is to ignore it when we are building on CI:
talaiot {
    ignoreWhen {
        envName = "CI"
        envValue = "true"
    }
}
To have a quick setup to see the possibilities of Talaiot we are providing a Docker image to setup a Grafana + InfluxDb instances(based on this great repo).
Additionally, the Docker image is creating a default database, a provisioned dashboard and the default datasource for InfluxDb. The source is here:
To run the Docker Image:
docker run -d \
  -p 3003:3003 \
  -p 3004:8083 \
  -p 8086:8086 \
  -p 22022:22 \
  -v /var/lib/influxdb \
  -v /var/lib/grafana \
  cdsap/talaiot:latest
You can access to the local instance of Grafana:
http://localhost:3003 root/root
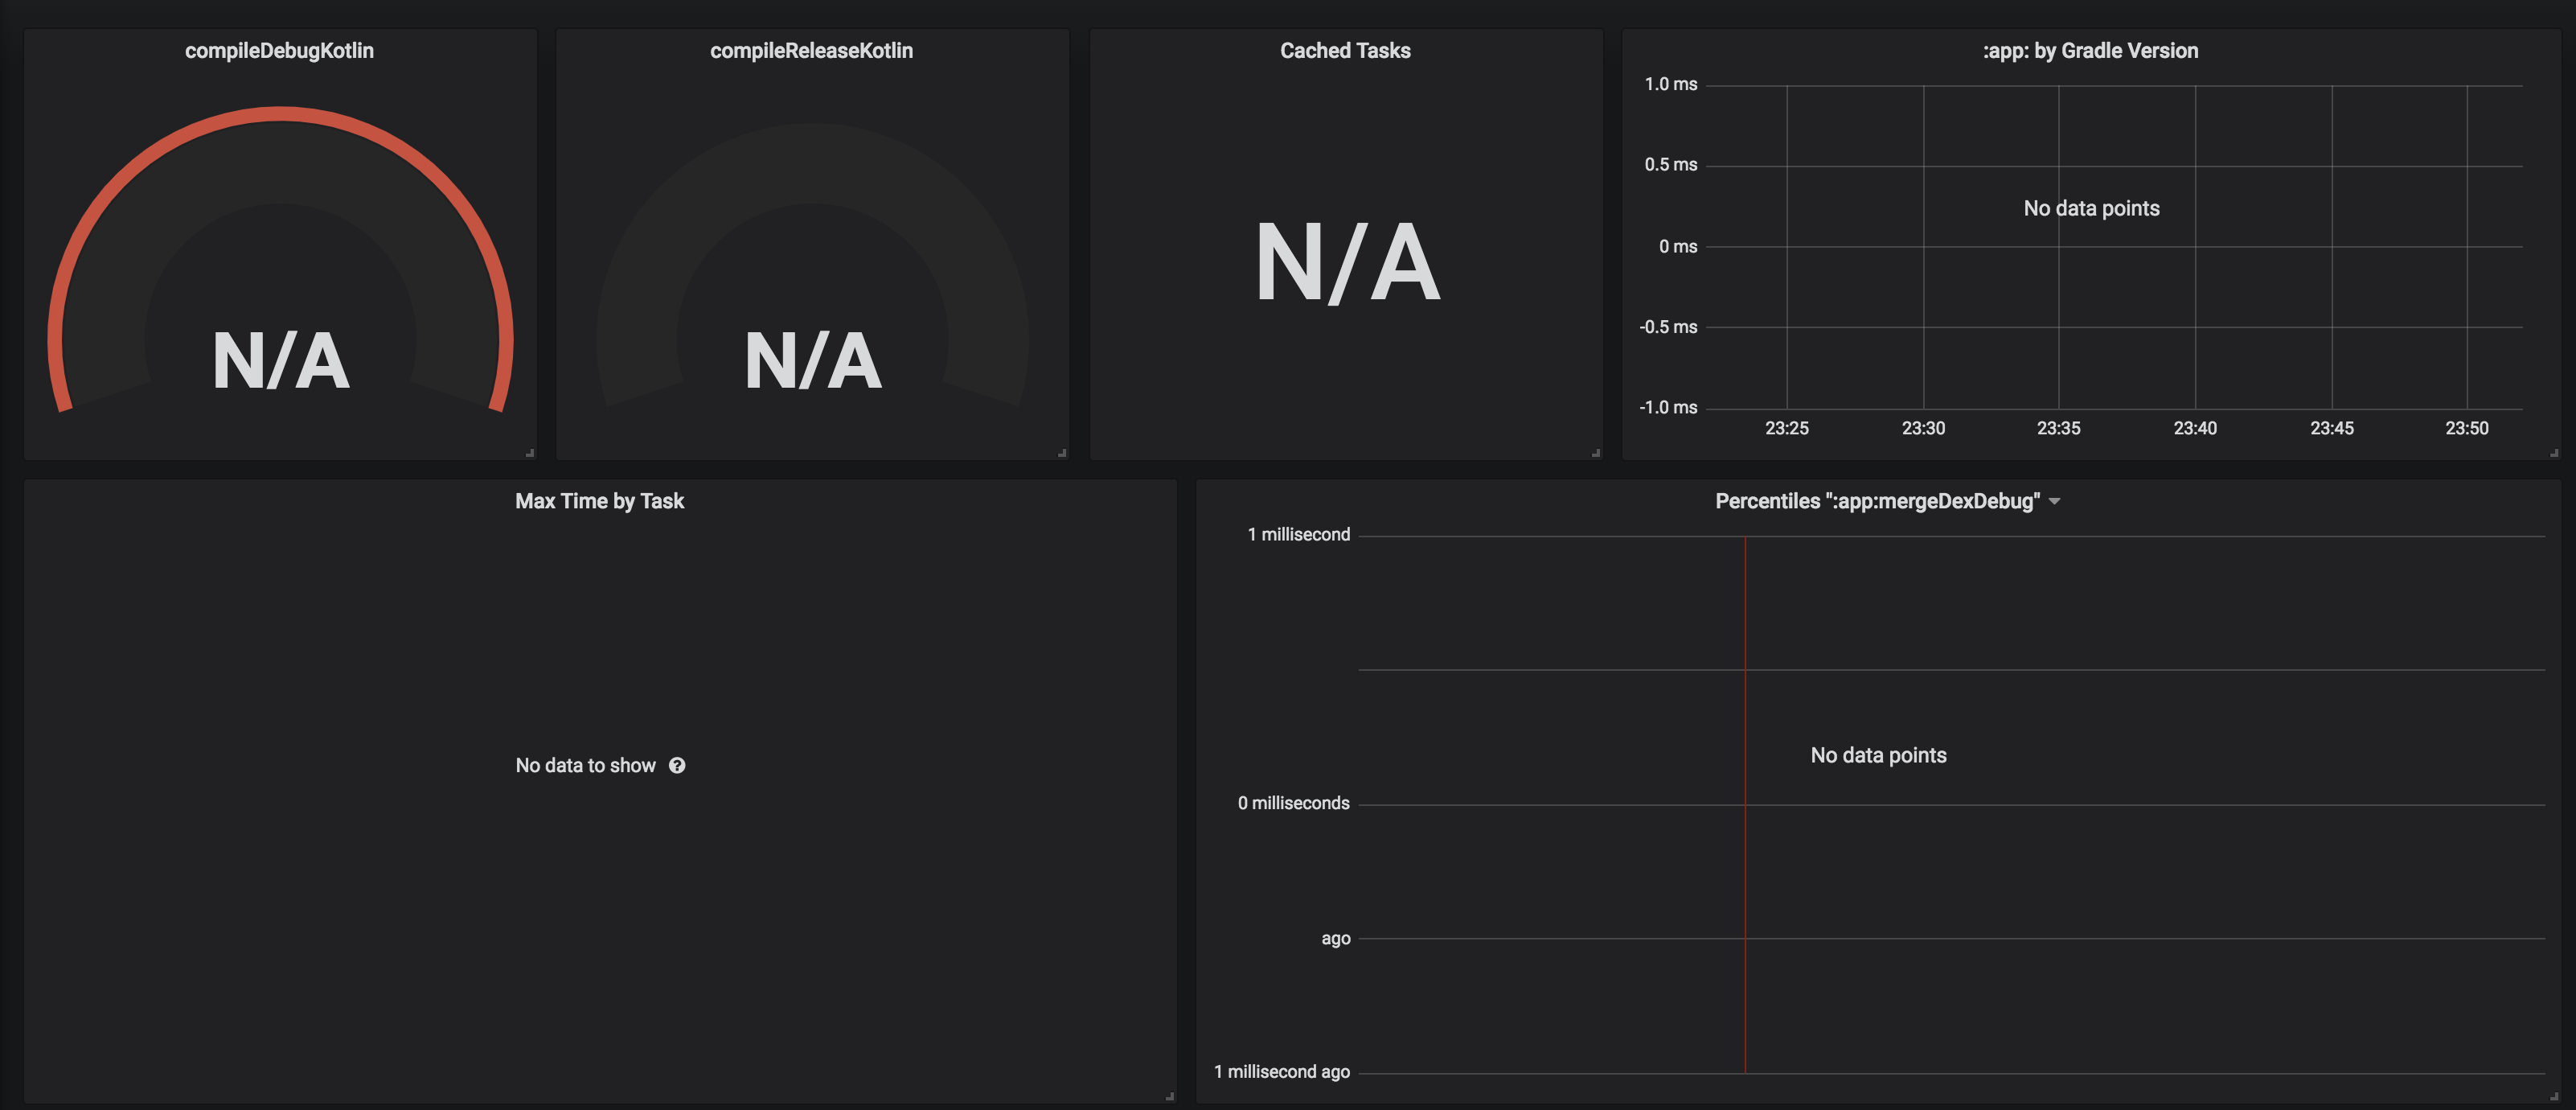
If you access to the provisioned Dashboard included in the Docker Image(http://localhost:3003/d/F9jppxQiz/android-task-tracking?orgId=1), you will see an empty dashboard like:
To see Talaiot in action, you need to populate the data. We are providing a script to populate data based in the sample project included in the repository. You can execute the script:
bash scripts/populate.sh
The script will download the repository and with the help of Gradle Profiler(https://github.com/gradle/gradle-profiler) will trigger number of builds defined in the scenario file:
assemble {
  tasks = ["clean"]
}
clean_build {
  versions = ["5.1"]
  tasks = ["assemble"]
  gradle-args = ["--parallel"]
  cleanup-tasks = ["clean"]
  run-using = cli
  warm-ups = 20
}
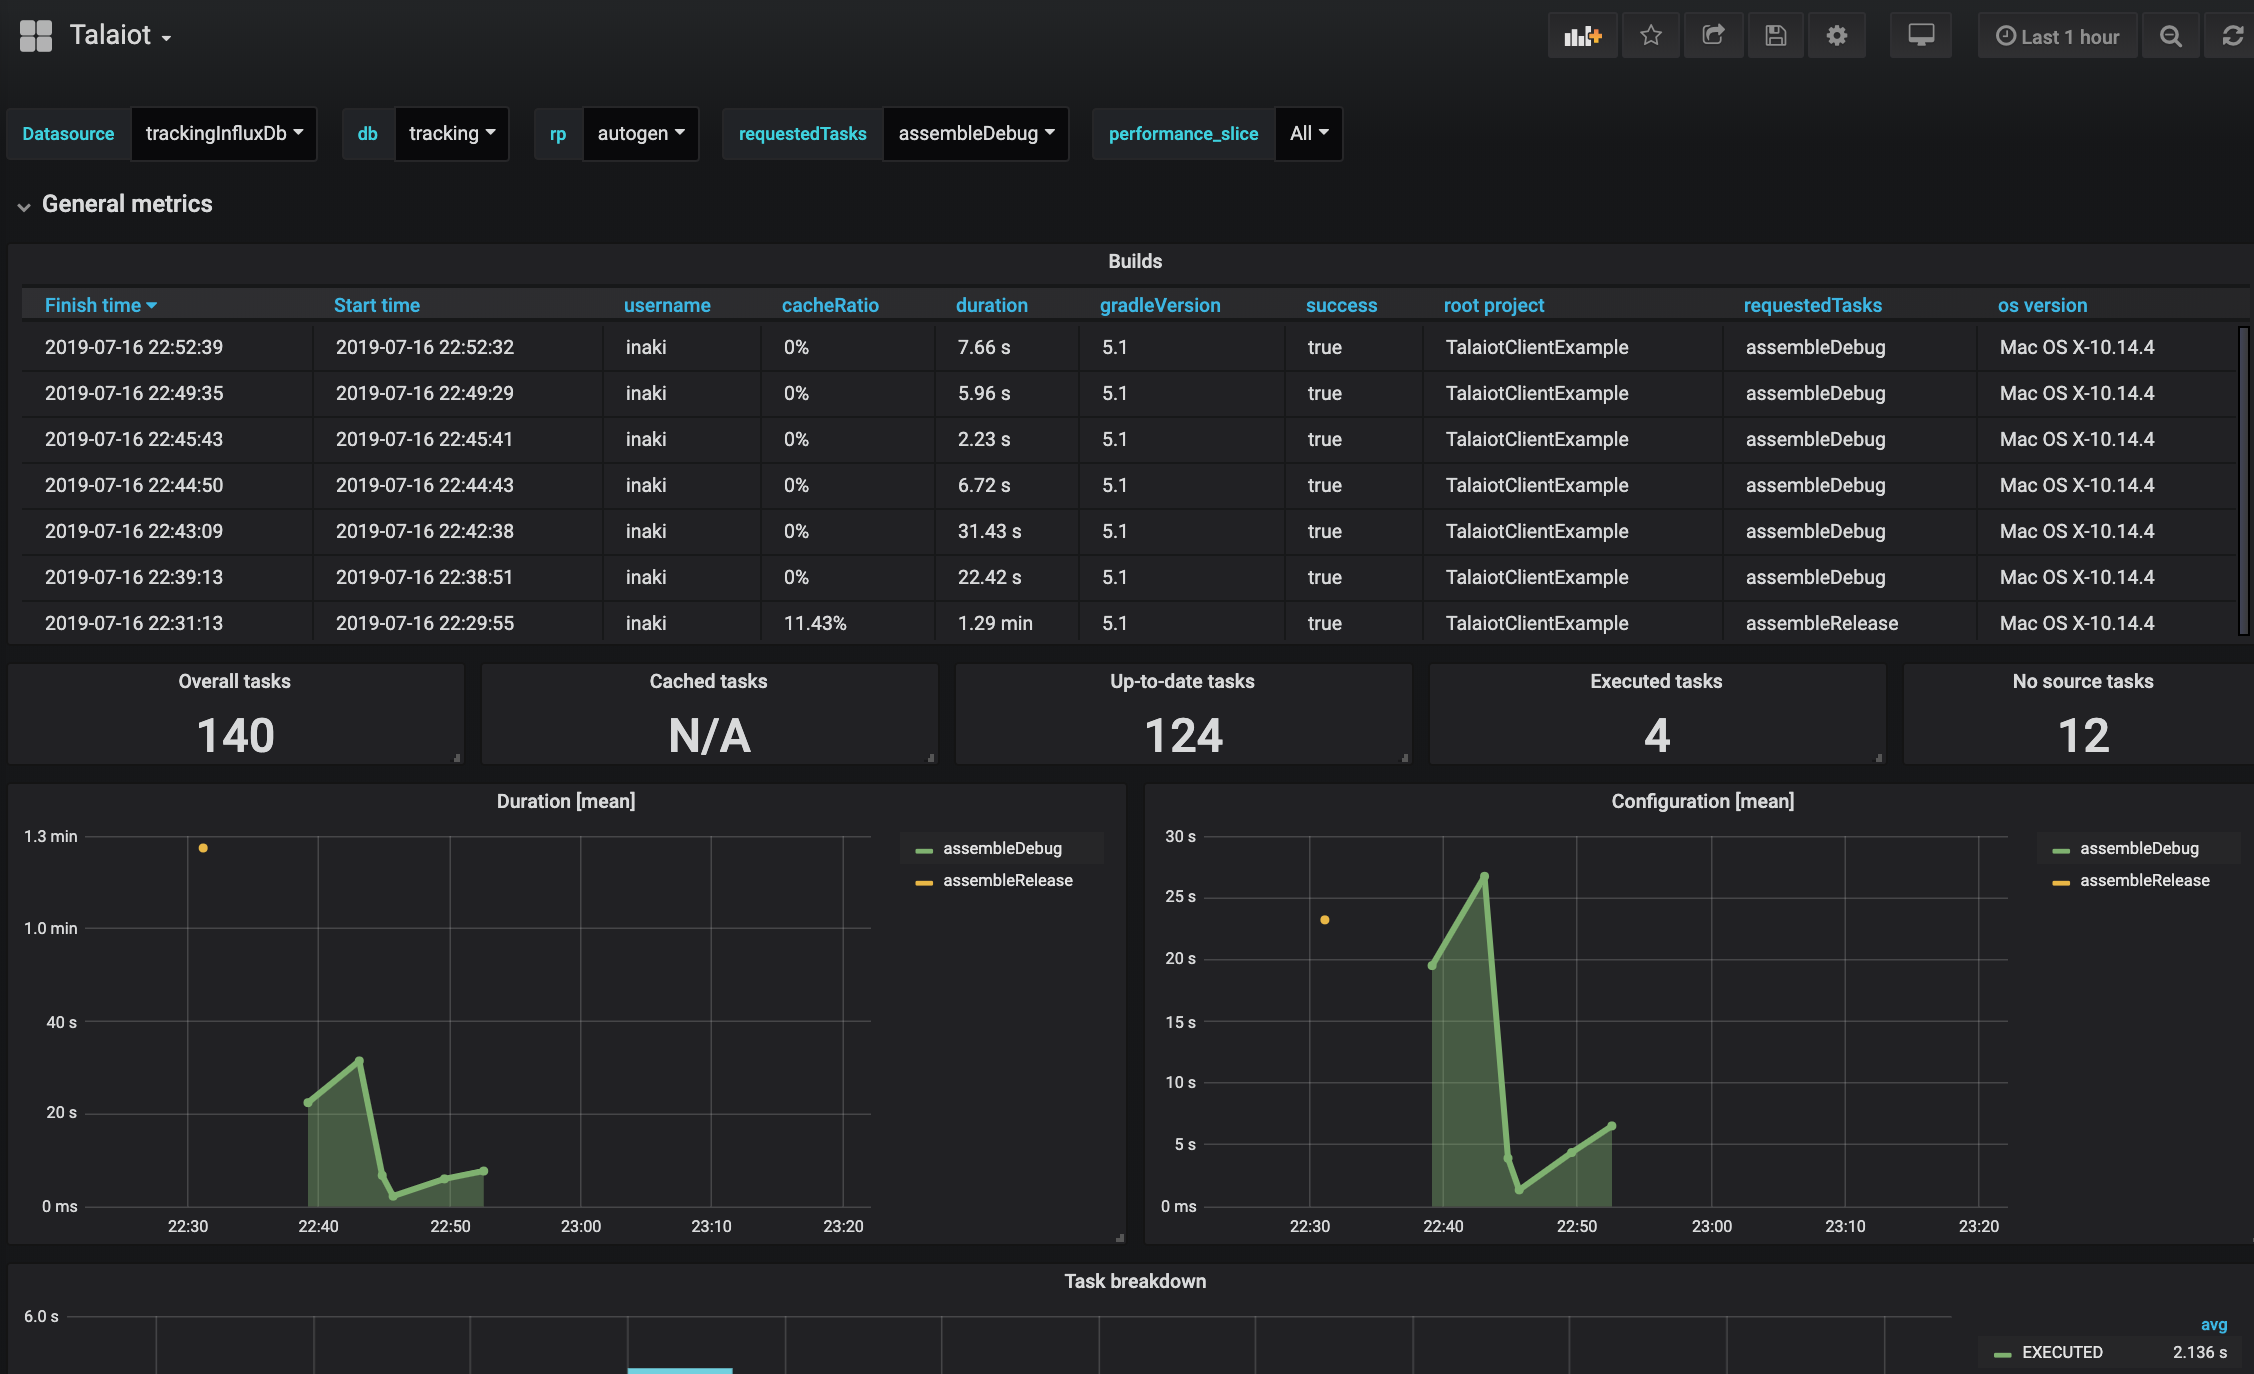
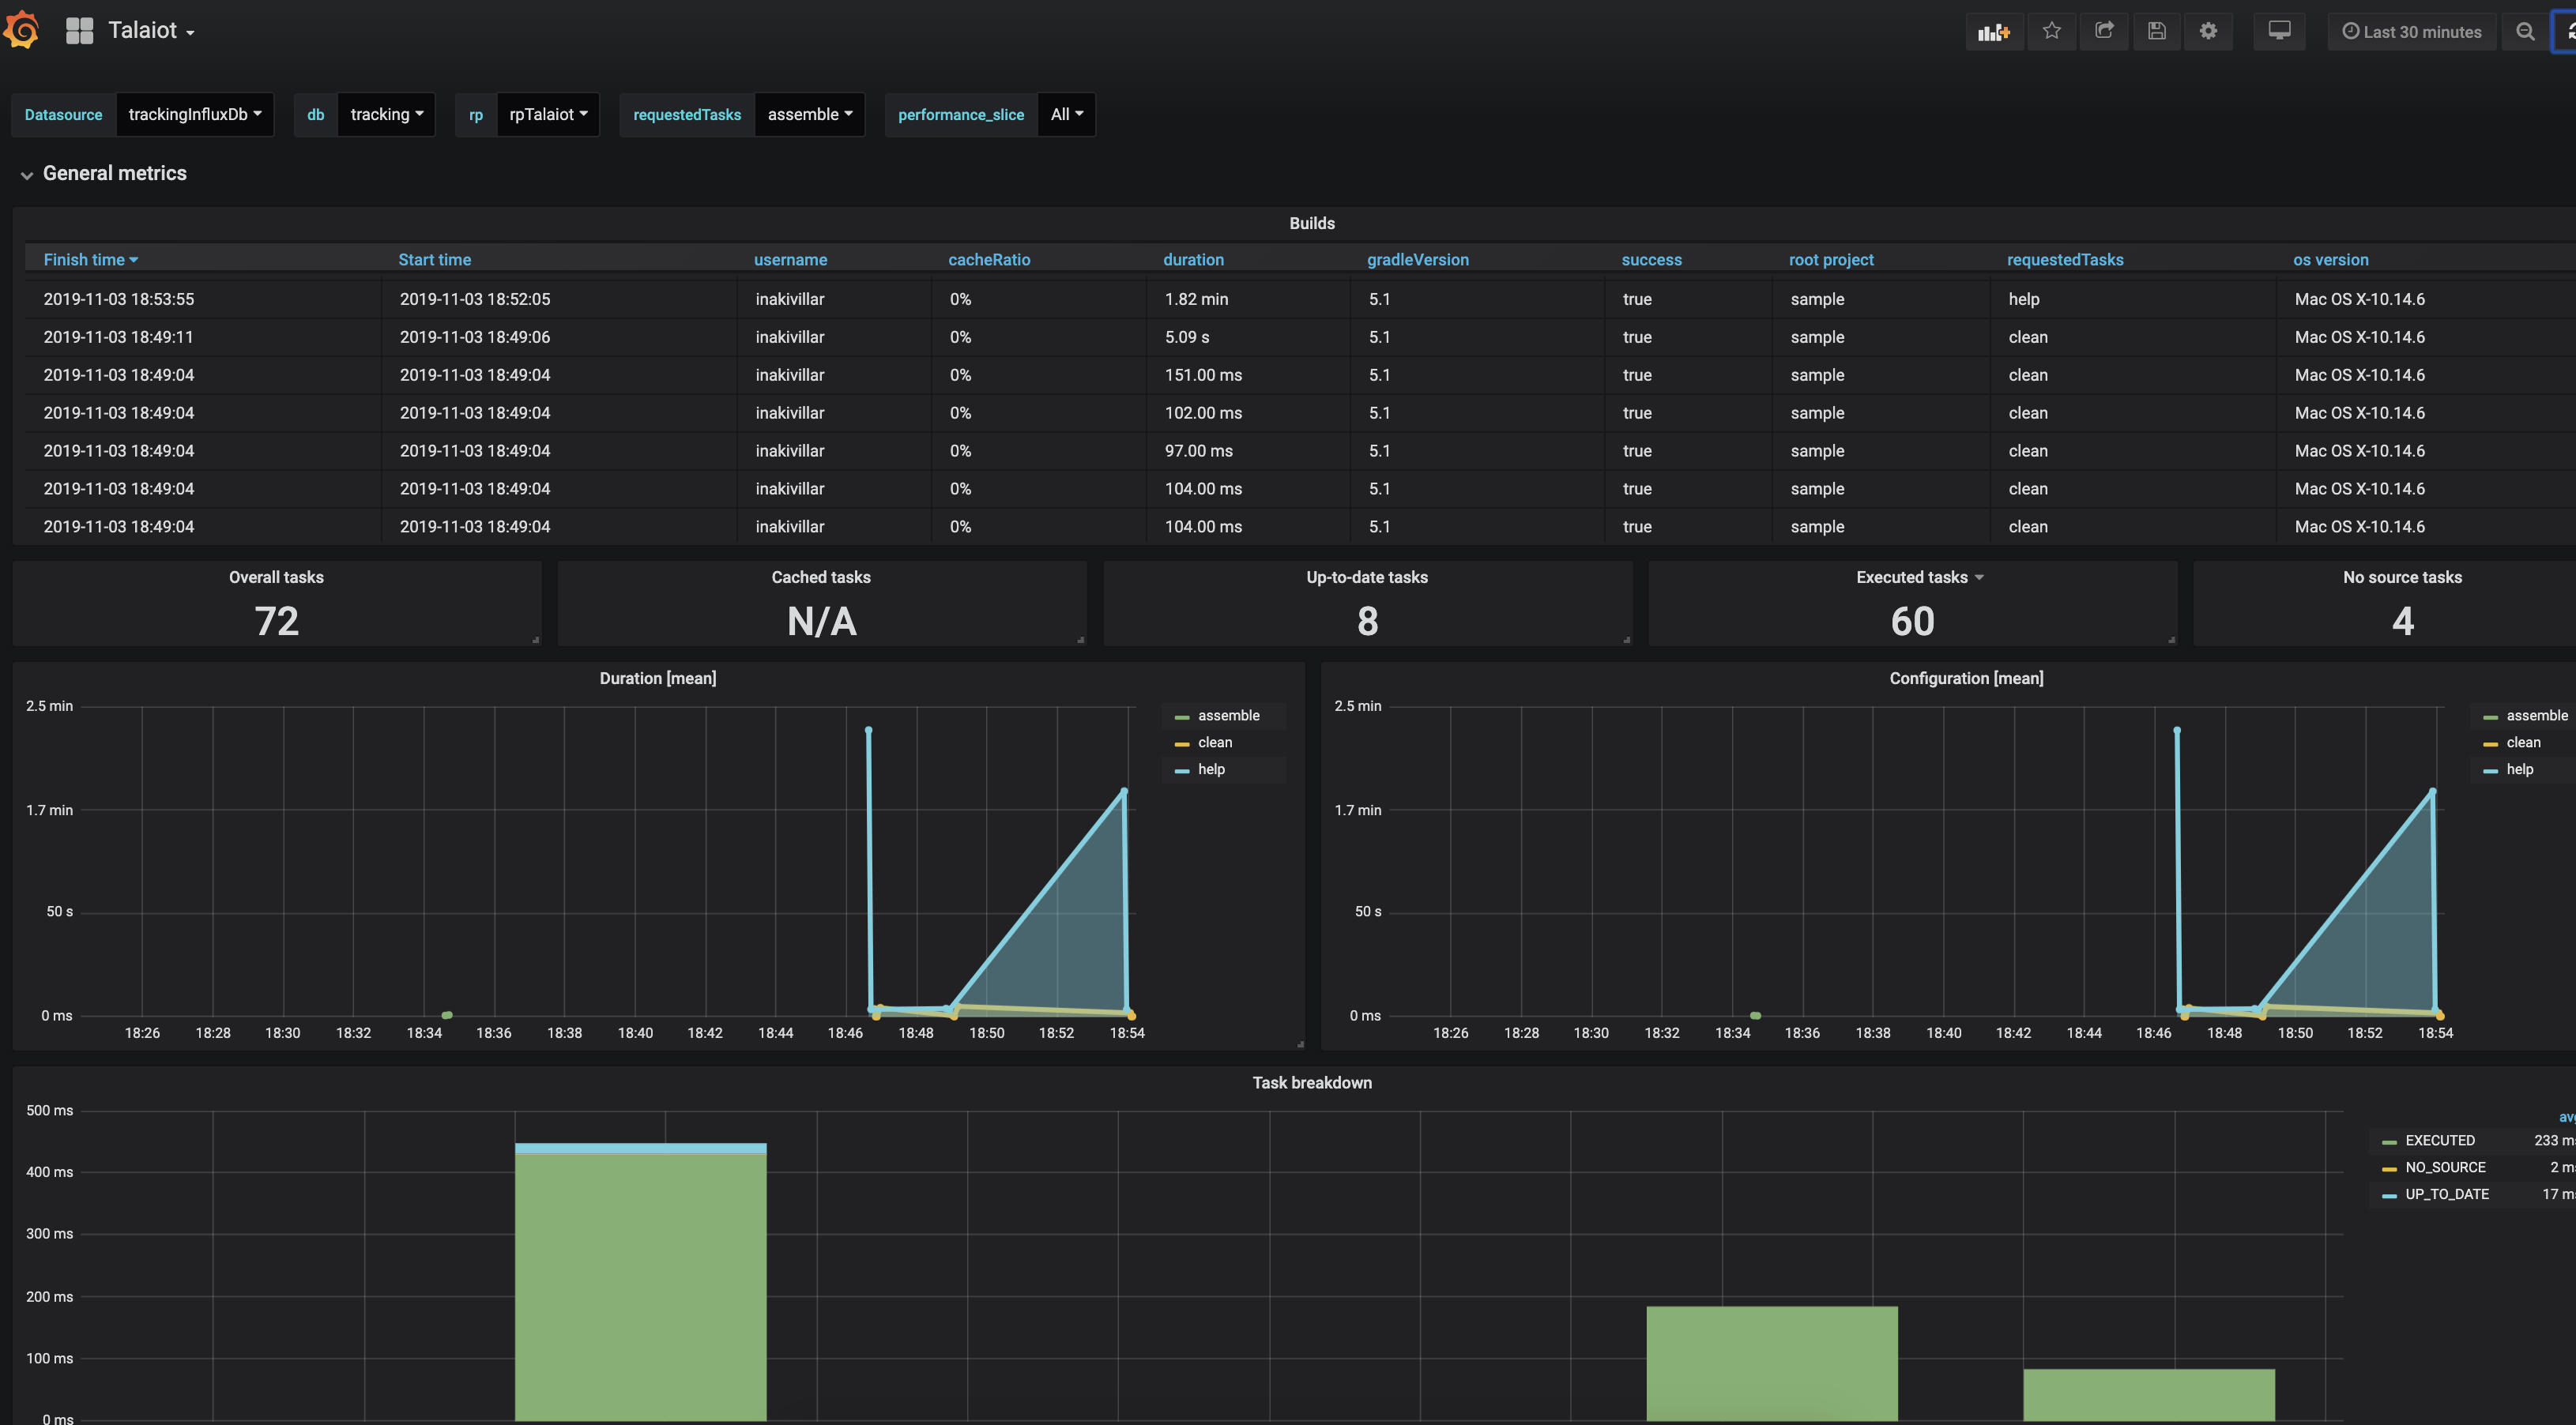
Once is finished you can check the results on the Grafana Dashboard http://localhost:3003/d/F9jppxQiz/android-task-tracking?orgId=1:
Talaiot is not a new idea. There are multiple awesome plugins to use to achieve same results:
-
Gradle Enterprise: If you are using Gradle Enterprise Talaiot is useless because the aggregation is great and you have the support from Gradle :)
-
Build Time Tracker by Pascal Hartig(@passy).
-
Kuronometer Plugin developed with Scala and FP concepts by Pedro Vicente Gómez Sánchez(@pedrovgs)
Metrics Configuration by Svyatoslav Chatchenko
Exploring the InfluxDbPublisher in Talaiot
Talaiot is Open Source and accepts contributions of new Publishers, Metrics and Dashboards that we can include as provisioned ones in the Docker image.
-
Anton Malinskiy: New format metrics, rework InfluxdbPublisher and new Publishers Json and Timeline.
Pascal Hartig, Build Time Tracker it was an inspiration to build this plugin.
Bintray release plugin plugin by Novoda
