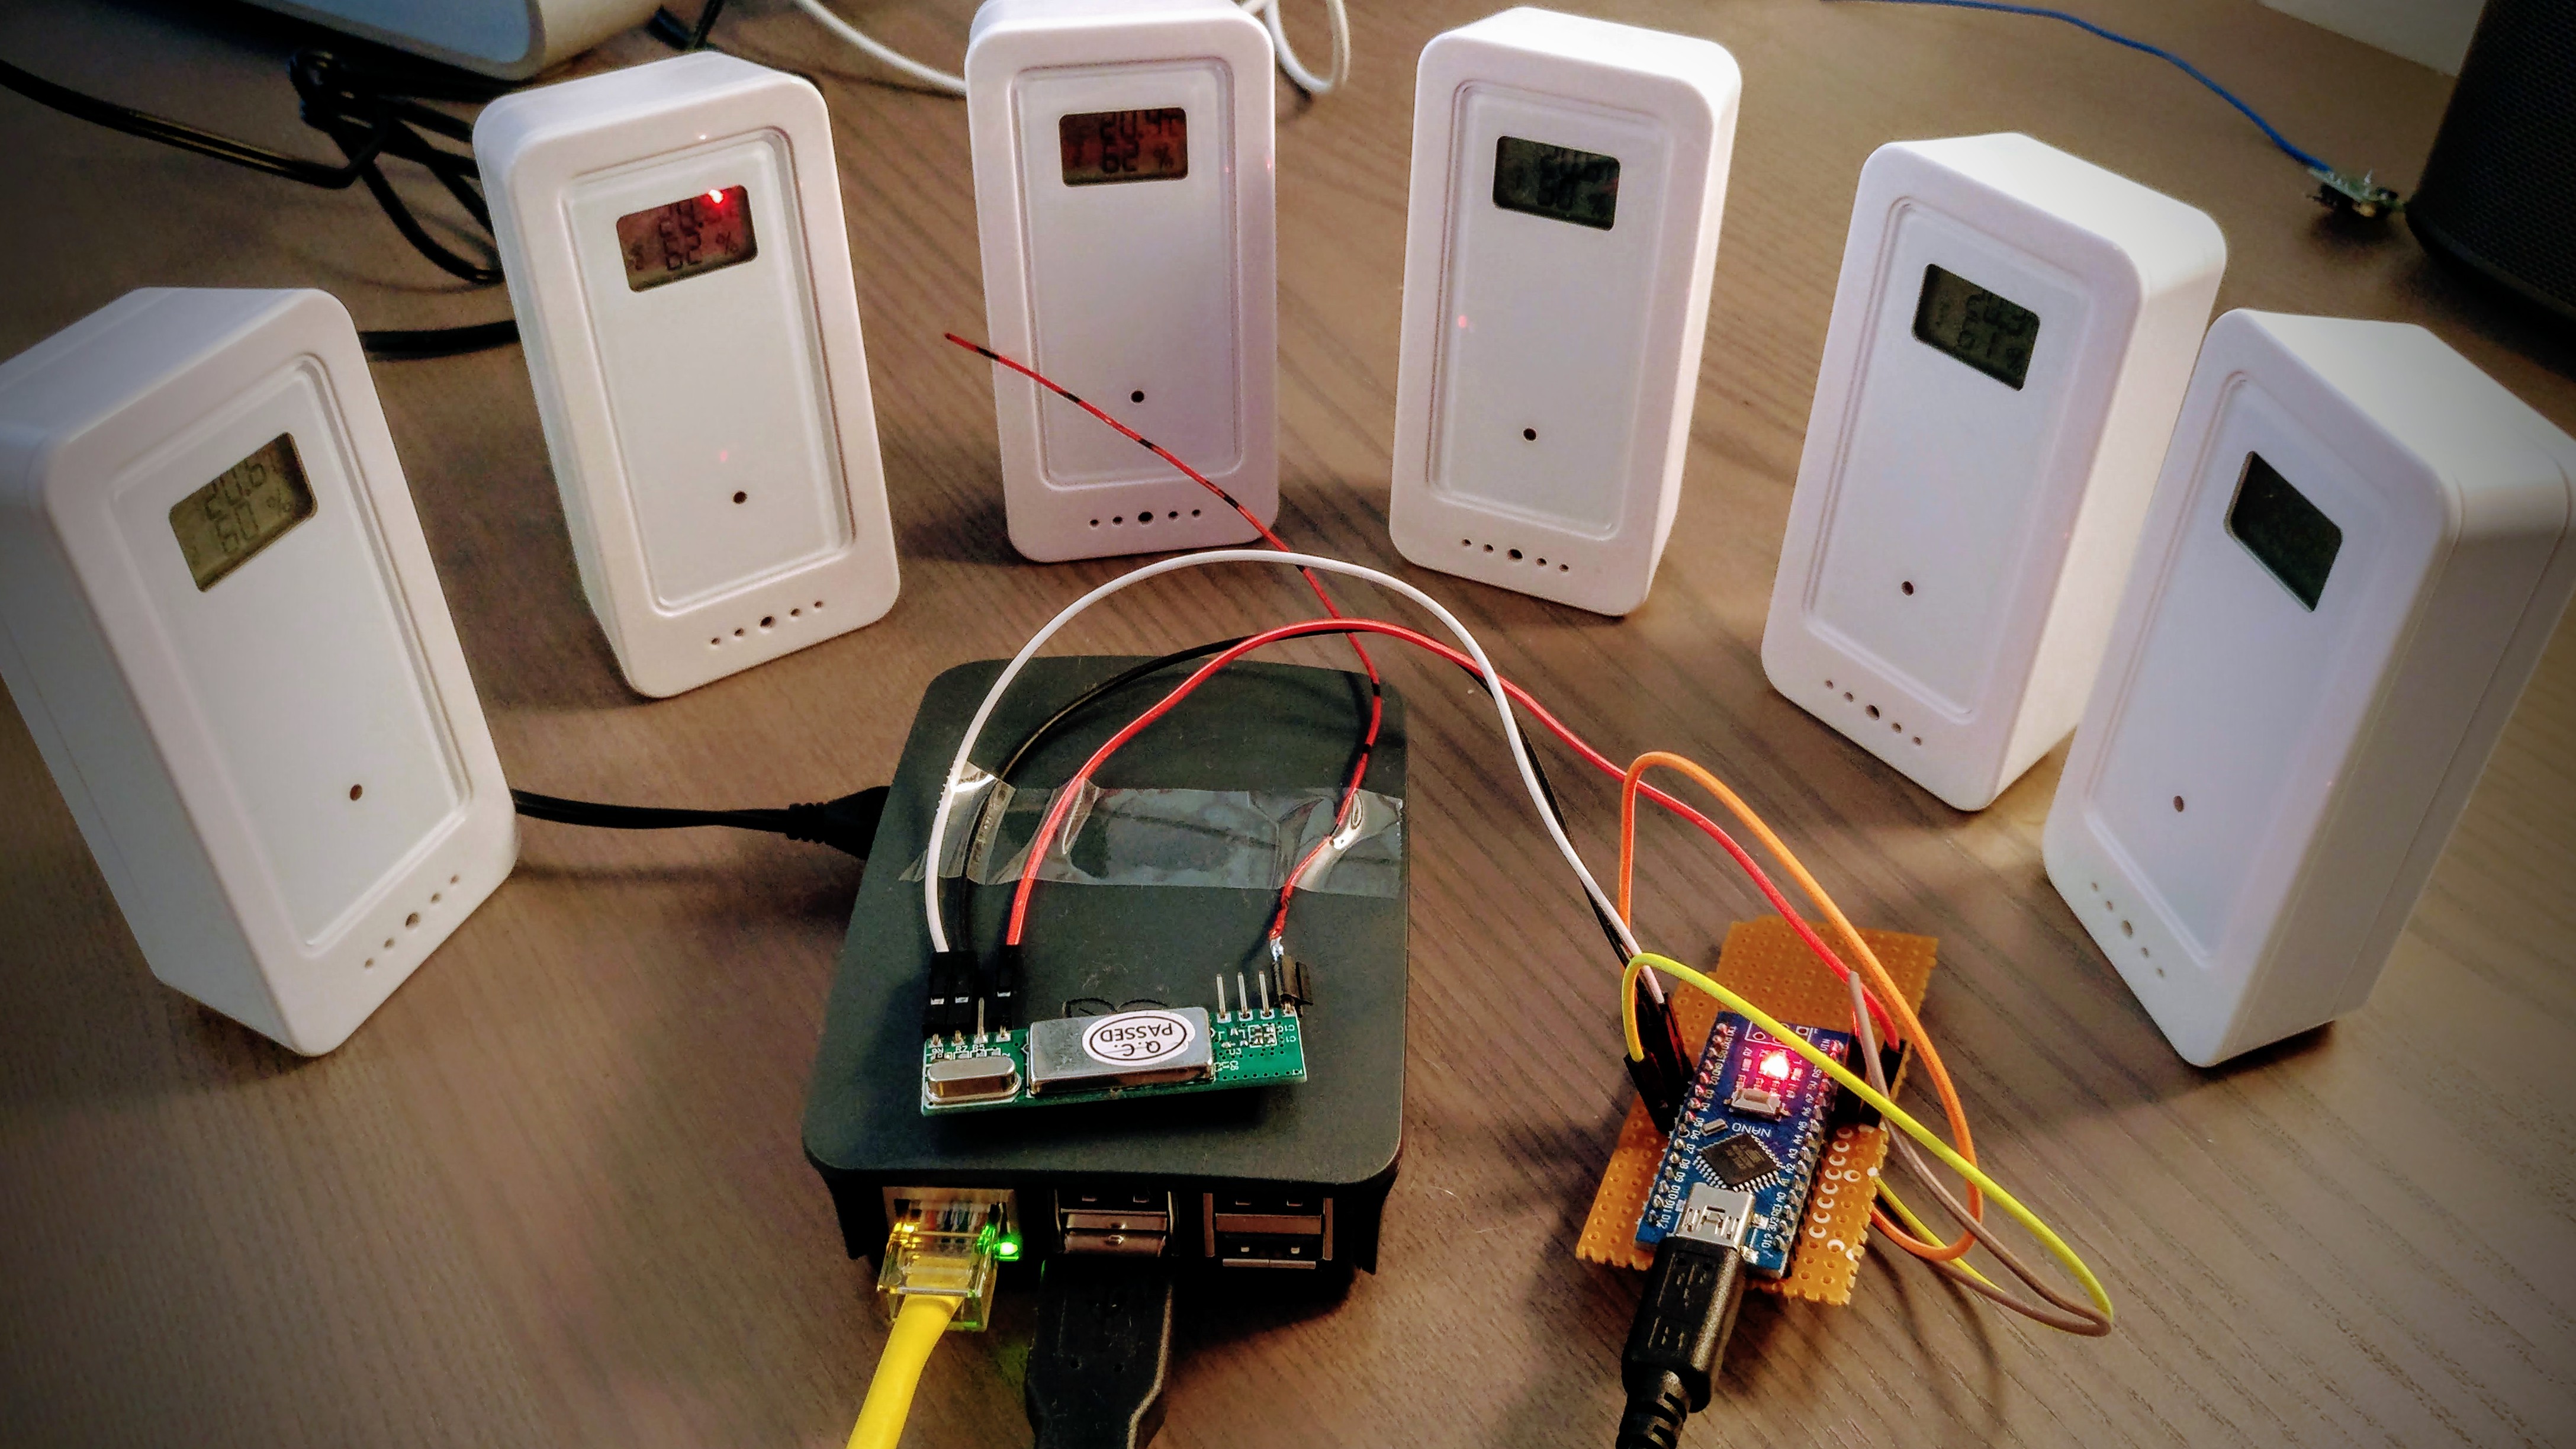
 Figure 1: Hardware in use: Raspberry Pi, Arduino Nano, RXB6 433Mhz receiver,
and as many GT-WT-01 temperature/humidity sensors as you like.
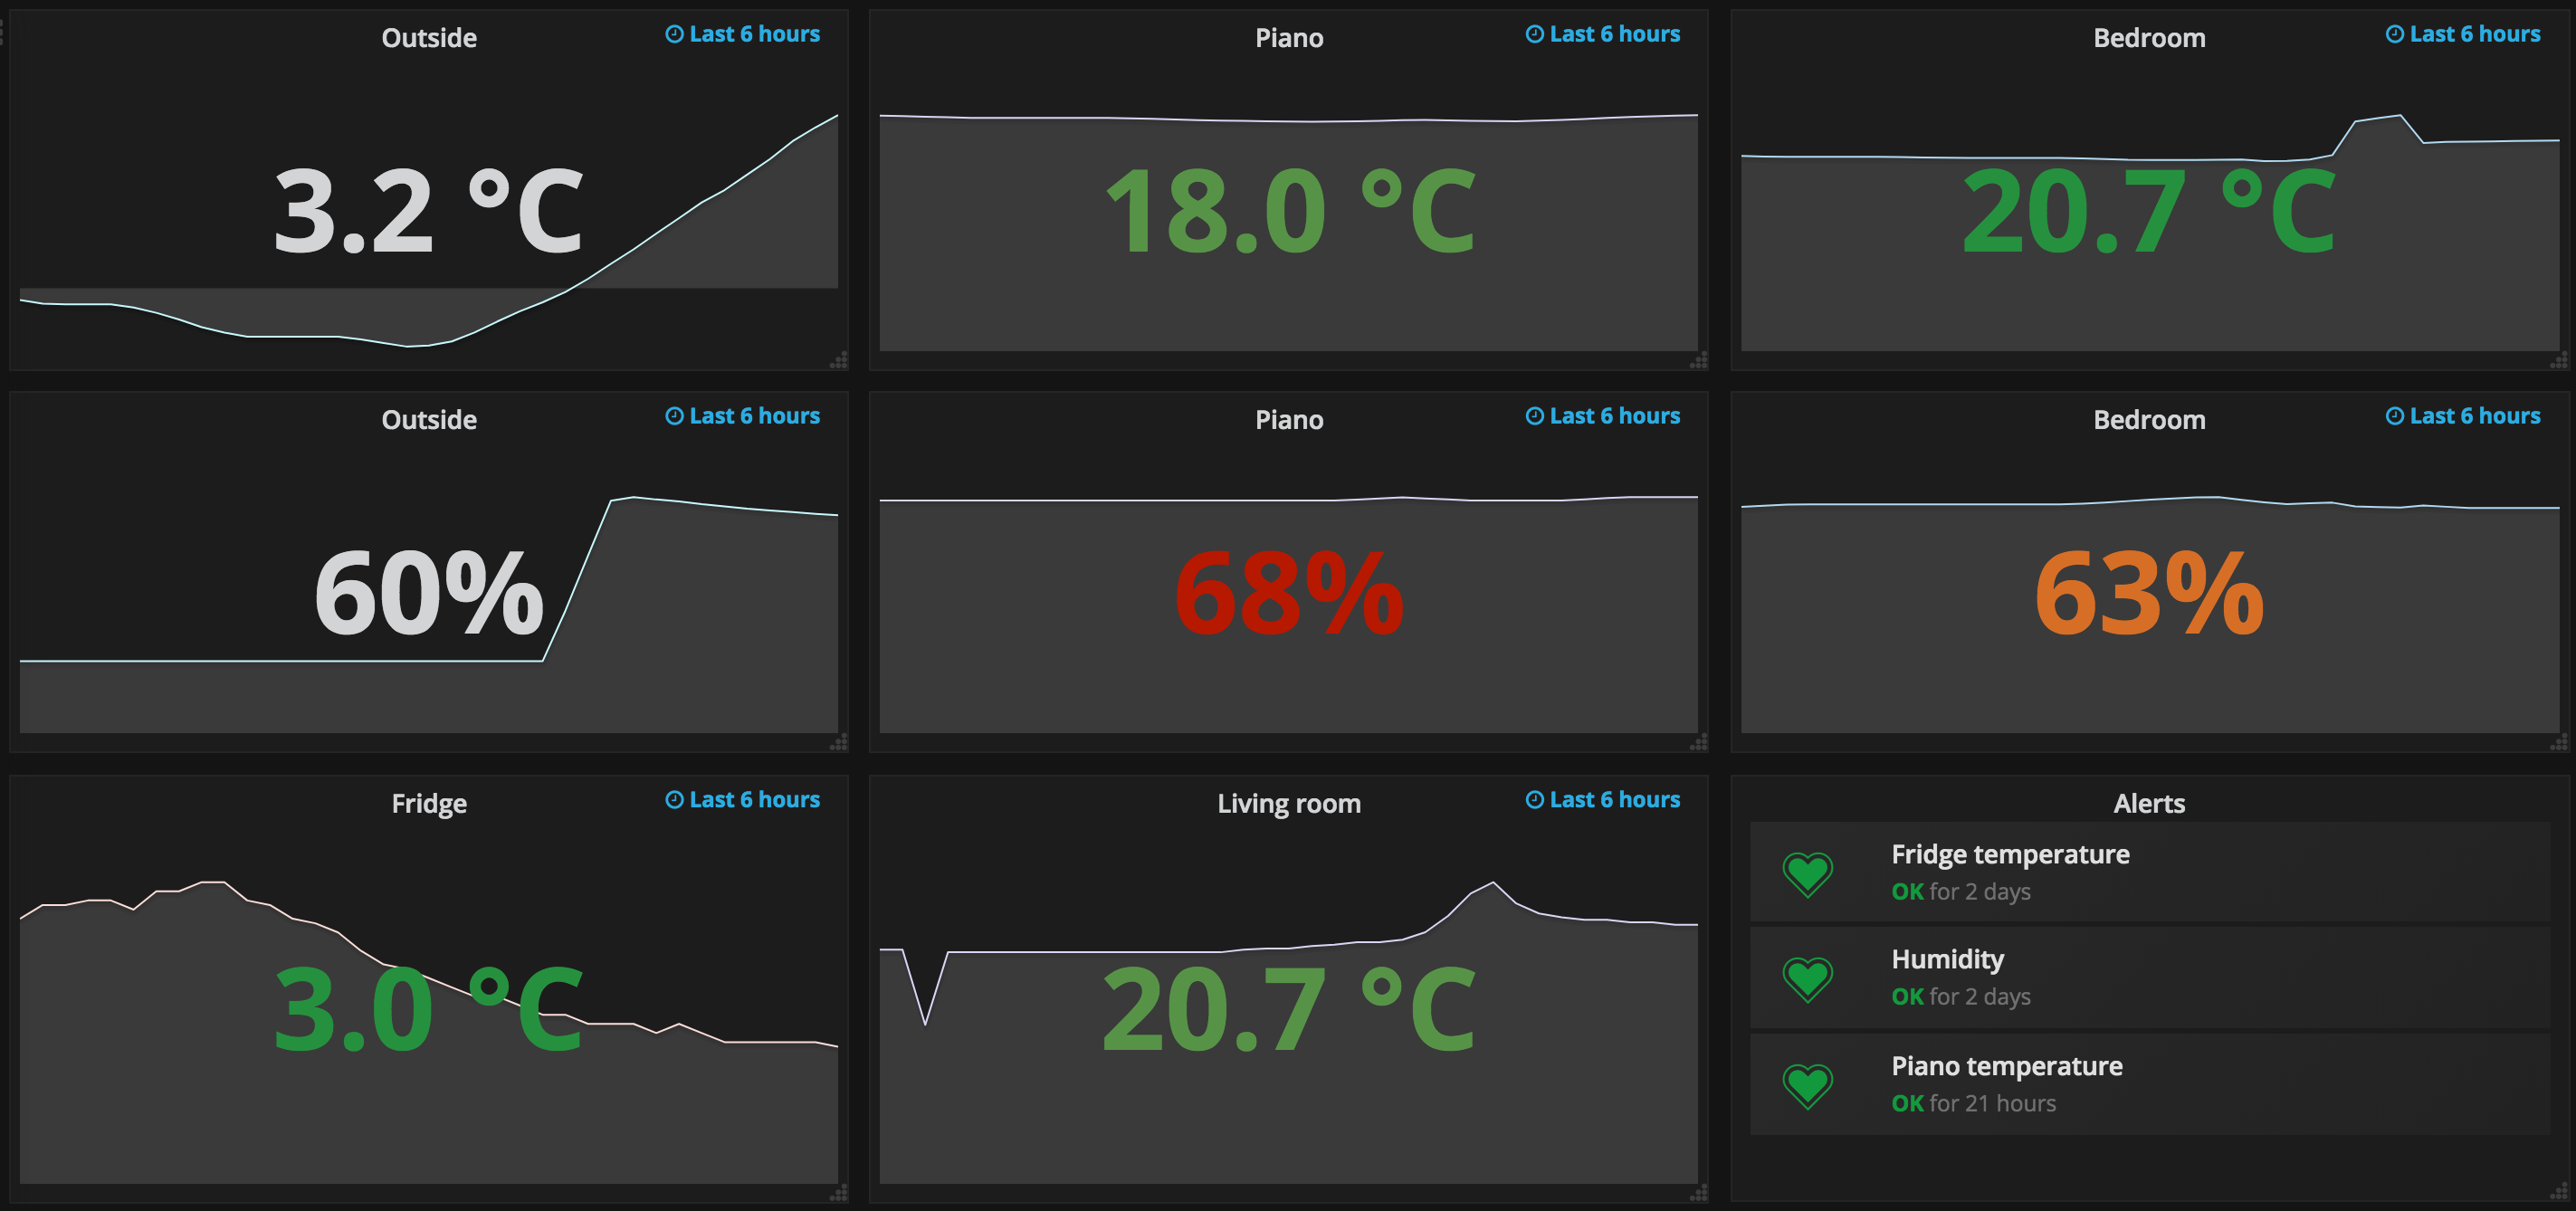
 Figure 2: Grafana dashboard showing an overview of current
temperatures and humidities around the house as well as the status of alerts
(e.g., I want to get notified whether my piano is too cold or humid, so I can assure it stays longer tuned).
 Figure 3: Temperature and humidity of the fridge within the last 24h (the upper red line defines a threshold of
9° Celsius; so if the fridge gets too warm I get notified in Slack).
 Figure 4: Humidity inside rooms and piano.
This is an opinionated (and affordable) setup to measure and log temperature and humidity around the house. Opinionated because I like Go, Prometheus, and Grafana. Affordable because each sensor costs around 10 Euros.
So, in a nutshell, this repo offers you a prometheus exporter for 433 MHz temperature/humidity sensors, where signals are received via an Arduino (with this software flashed to it) connected to a Raspberry Pi.
Happy measuring!
You see it all in Figure 1:
- Raspberry Pi
- Arduino Nano
- RF unit for the Arduino (don't try to save a few dollars by buying a cheap one; it has a very tiny range)
- GT-WT-01 temperature/humidity sensors (get as many as you like; I bought six on eBay: one for outside, one for every room, one for the fridge, one for inside my piano, etc.)
Update
I realised that the GT-WT-01 sensors seem to be purchasable only in the EU and UK. However, protocols for other sensors can easily be added to the supported protocols of this project, too.
- Prometheus
- Grafana (you can download the newest Deb packages for the Pi here)
- Flash Arduino to recieve signals
- Slack (if you want to get notified about alerts)
Get the binary for the Raspberry Pi (ARM) or other platforms here.
To see options available run $ ./weather-station --help:
usage: weather-station [<flags>] [<ids>...]

Flags:
  --help                    Show context-sensitive help (also try --help-long and --help-man).
  --device="/dev/ttyUSB0"   Arduino connected to USB.
  --listen-address=":8080"  The address to listen on for HTTP requests.

Args:
  [<ids>]  Sensor IDs that will be exported.
Starting the exporter:
-
At first, simply start the exporter without any IDs. The logs will show all signals that the exporter is able to decode, but nothing is exported yet.
$ ./weather-station 2018/02/22 13:49:58 Serving metrics at ':8080/metrics' 2018/02/22 13:49:58 Device '/dev/ttyUSB0' opened 2018/02/22 13:49:59 ready 2018/02/22 13:49:59 Wrote command 'RF receive 0' to '/dev/ttyUSB0' (13 bytes) 2018/02/22 13:49:59 ACK 2018/02/16 19:51:05 RF receive 544 4124 2088 9080 0 0 0 0 0102020101020202020101010202020102020202010201010102020102010202020101020103 2018/02/16 19:51:05 {Id:2439 Channel:2 Temperature:18.5 Humidity:70 LowBattery:false} 2018/02/22 13:46:02 RF receive 540 4124 2092 9080 0 0 0 0 0102020102020201020202020202020202020202020201020101020102020102010101010103 2018/02/22 13:46:02 {Id:2320 Channel:1 Temperature:4.5 Humidity:47 LowBattery:false} ... -
Write down all the IDs of sensors you'd like export to Prometheus.
-
Restart the weather station with those IDs (e.g.,
./weather-station 2439 2320)
Here is my version of the Grafana dashboard that you see above. Feel free to use it as a starting point for customizing yours (of course, sensor IDs need to be adapted accordingly).
-
Idea and code of this CO2 Prometheus exporter has been an inspiration and starting point for this project.
-
All that hard work of reverse engineering the protocols and finding the correct decodings has been already done by the Pimatic project.


