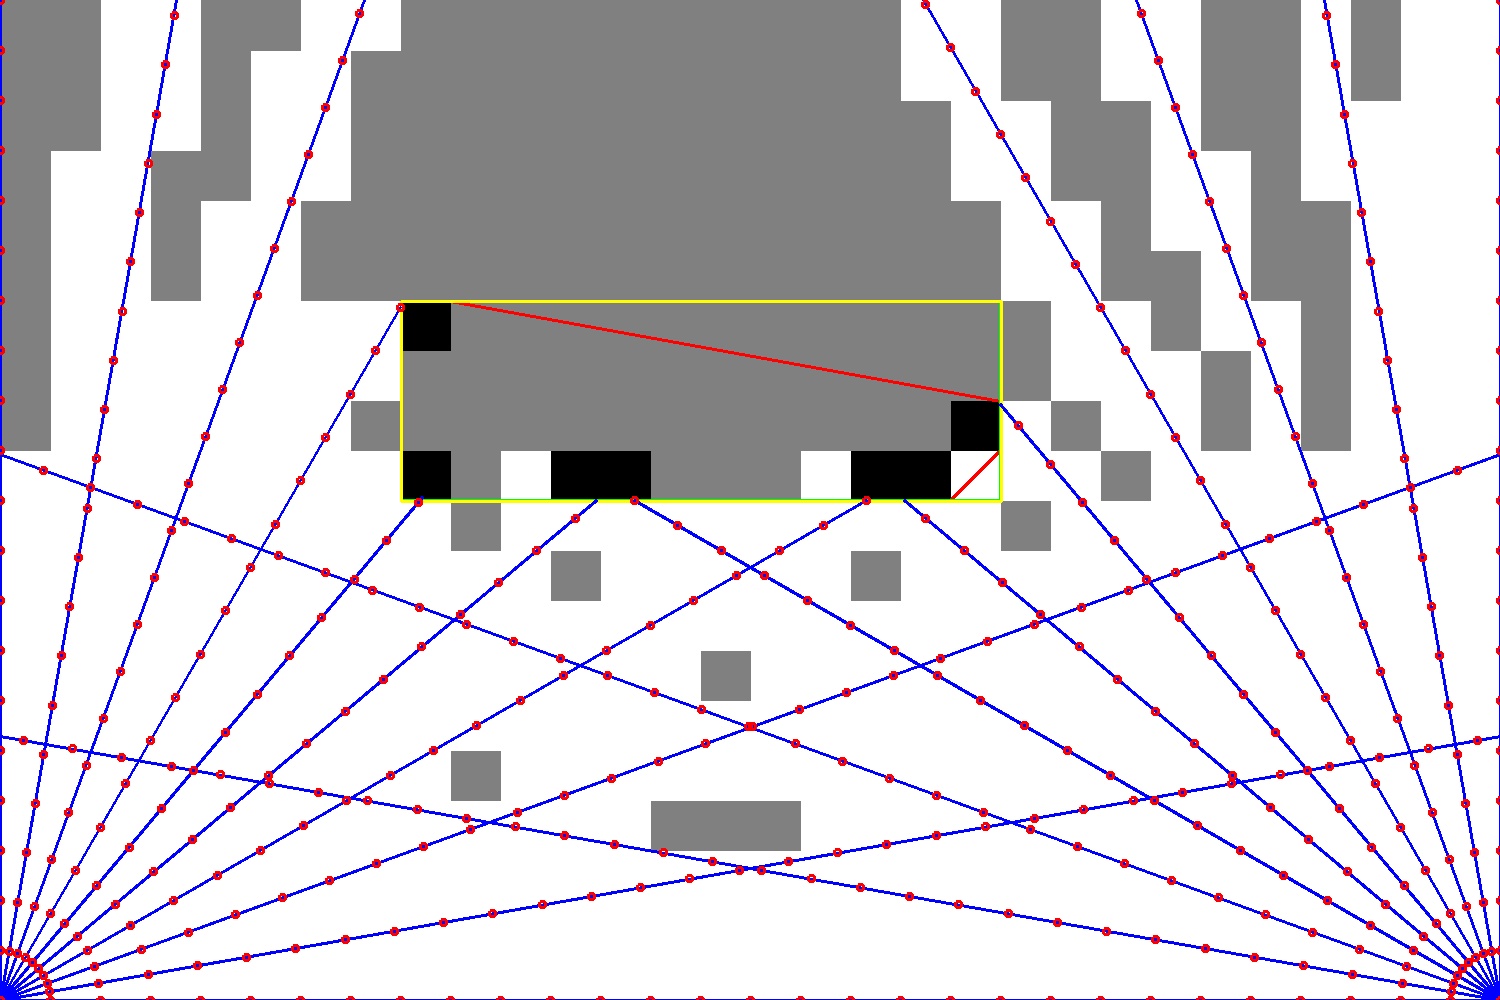
It creates an occupancy grid map from planar laser data and detects a rotated box See https://github.com/paolof91/SensorMapping/blob/main/2021-09-10_Q-Bot-SensorMappingCodingChallenge.pdf for further explanation of the code.
DELIVERABLES
I am detecting both a straight rectangle (the sides are parallel to the walls) and a rotated rectangle (the sides may not be parallel to the walls).
In ./output/ you will find 3 files:
- occupancyGridMap.jpg containing the occupancy grid map
- occupancyGridMap__debug.jpg containing the occupancy grid map plus interesting debug informations such as laser points, enclosing rectangles
- rectangles.txt where there will be all informations about the detected enclosing straight rectangle and enclosing rotated rectangles.
I am copying rectangles.txt in this ReadMe as requested.
Straight rectangle: bottom left corner (x,y)=(4.01,4.99) size (w,h)=(6,2)
Rotated rectangle: centre (x,y)=(7.005,5.995) size (w,h)=(1.99,5.99) orientation [deg] angle=90
You can delete these 3 files and generate them again by my main target: ./SensorMapping
MORE COMPLEX SCENARIOS
Let's talk about the concave shaped work area, e.g. the inverse of a hill, e.g. a valley scenario where the lasers are on the peak of mountains and point downwards to the valley).
In this case, the laser rays will hit the ground. Therefore, each laser ray, instead of hitting the maximum detection distance (as per laser specs), will hit the ground. This translates into a map that has a background wall. In many industrial scenarios there are fences around the field where mobile robots work. In a valley scenario, our occupancy grid will likely discover a fence.
To deal with a fence, I would implement a laser filter that distinguishes non-fence data from fence data. An example of such filter is the following:
-
Step 1. laser data is noisy. First, I would implement a low pass filter that smoothens the collected laser data. This is necessary because in Step 2 I will the spatial derivative of this signal and I want as little noise as possible when computing a spatial derivative.
-
Step 2. Compute a spatial derivative. This can be done in complex ways. A simple way would be to take the low-pass filter of x and y data, and/or a low-pass filter of the laser distance data. I am considering x,y, and laser distance as a signal not in time but in space (e.g. wrt laser angle). I would be using an appropriate time constant.
-
Step 3. Complex conditions can be found to infer that the laser is not reading the fence anymore. A simple condition would be the following. When the absolute value of the x,y, or distance derivative is higher then a threshold, then I know that the laser is not reading the fence anymore but instead is reading an actual object, and viceversa.
-
Step 4. Discard fence data and detect objects only on non-fence data.
Let' talk about unstructured environment. In a similar way as done for the concave-shaped work area, I could write a filter to tackle the different possible scenarios. More complex approaches are possible, such as particle filters (see Probabilistic robotics). ROS implements a number of SLAM algorithms in unstructured environments.
BUILDING AND RUNNING MAIN AND TESTS
Make sure you have the opencv library installed. I built my project in Ubuntu 20.04.3 LTS using opencv version 4.5.4 . To build, execute the following steps in a Linux terminal: cmake . make
To run the main target: ./SensorMapping
To run the unit tests: ./__unit_tests__SensorMapping
The main target generates some output on the command line and generates the 3 files that I mentioned under the section Deliverables (occupancy grid map, debug map, and detected rectangles) You can also change the input laser data by modifying the file input_L1_L2.txt . You can modify the resolution and the position/angle of the lasers from within the code in SensorMapping.cpp which is the main source for the main target. It could be wise to change the resolution to something that is a common divisor of 15 and 10 (I have not checked whether non-common divisors of 15 and 10 generate segmentation faults).
UNIT TESTS explanation
- unit test 1 (see image in folder ./additionalImages/) checks the computeOccupancyGrid function. In particular, it checks the case where the laser hits a point exactly on the corner of a grid cell.
- unit test 2 checks the generateOccupancyGridImage function. In particular, it checks that, given a grid, the computed dimensions and position of the straight and rotated rectangles are correct. Here it is assumed that the straight and rotated rectangle are the same
- unit test 3 (see image in folder ./additionalImages/) is the same as unit test 2 but the input is provided so that the straight and rotated rectangle do not coincide.
ERROR conditions
There are many parts in the code that I have written to be robust against numerical uncertainties when computing the map, especially the edge conditions as tested by unit test 1.
ADDITIONAL images Please check the folder ./additionalImages/ for additional occupancy grids relative to different resolutions and unit tests 1 and 3.
