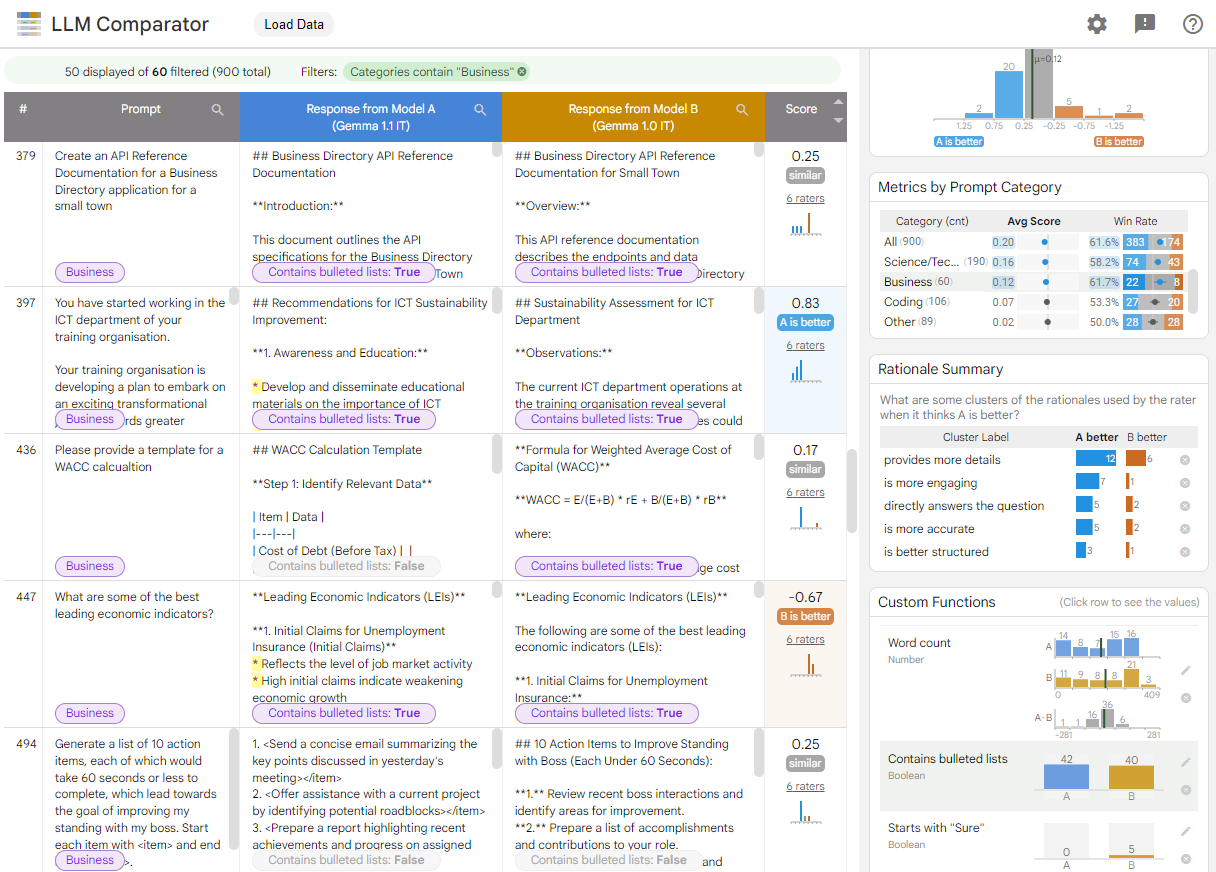
LLM Comparator is an interactive visualization tool with a python library, for analyzing side-by-side LLM evaluation results. It is designed to help people qualitatively analyze how responses from two models differ at example- and slice-levels. Users can interactively discover insights like "Model A's responses are better than B's on email rewriting tasks because Model A tends to generate bulleted lists more often."
You can play with LLM Comparator at https://pair-code.github.io/llm-comparator/.
You can either select one of the example files we provide, or you can upload your own JSON file (e.g., minimal example file) that follows our format which we describe below.
We provide an example file for comparing the model responses between Gemma 1.1 and 1.0 for prompts obtained from the Chatbot Arena Conversations dataset. You can click the link below to play with it: https://pair-code.github.io/llm-comparator/?results_path=https://pair-code.github.io/llm-comparator/data/example_arena.json
The tool helps you analyze when and why Gemma 1.1 is better or worse than 1.0 and how responses from two models differ.
- When: The Score Distribution and Metrics by Prompt Category panels show that the quality of responses from Model A (Gemma 1.1) is considered better than that from Model B (Gemma 1.0) (larger blue area than orange; >50% win rate), according to the LLM-based evaluation method (LLM-as-a-judge). This holds true for most prompt categories (e.g., Humanities, Math).
- Why: The Rationale Summary panel dives into the reasons behind these score differences. In this case, the LLM judge focused mostly on the amount of details. It also considered factors like conciseness, engagement, structures, etc.
- How: The Custom Functions panel lets you discover interesting specific differences. For instance, Gemma 1.1 (Model A) is more structured in a sense that it uses bulleted lists more frequently. Also, Gemma 1.1 is less chatty. While there are many responses starting with "Sure" for Gemma 1.0, no response from Gemma 1.1 starts with it.
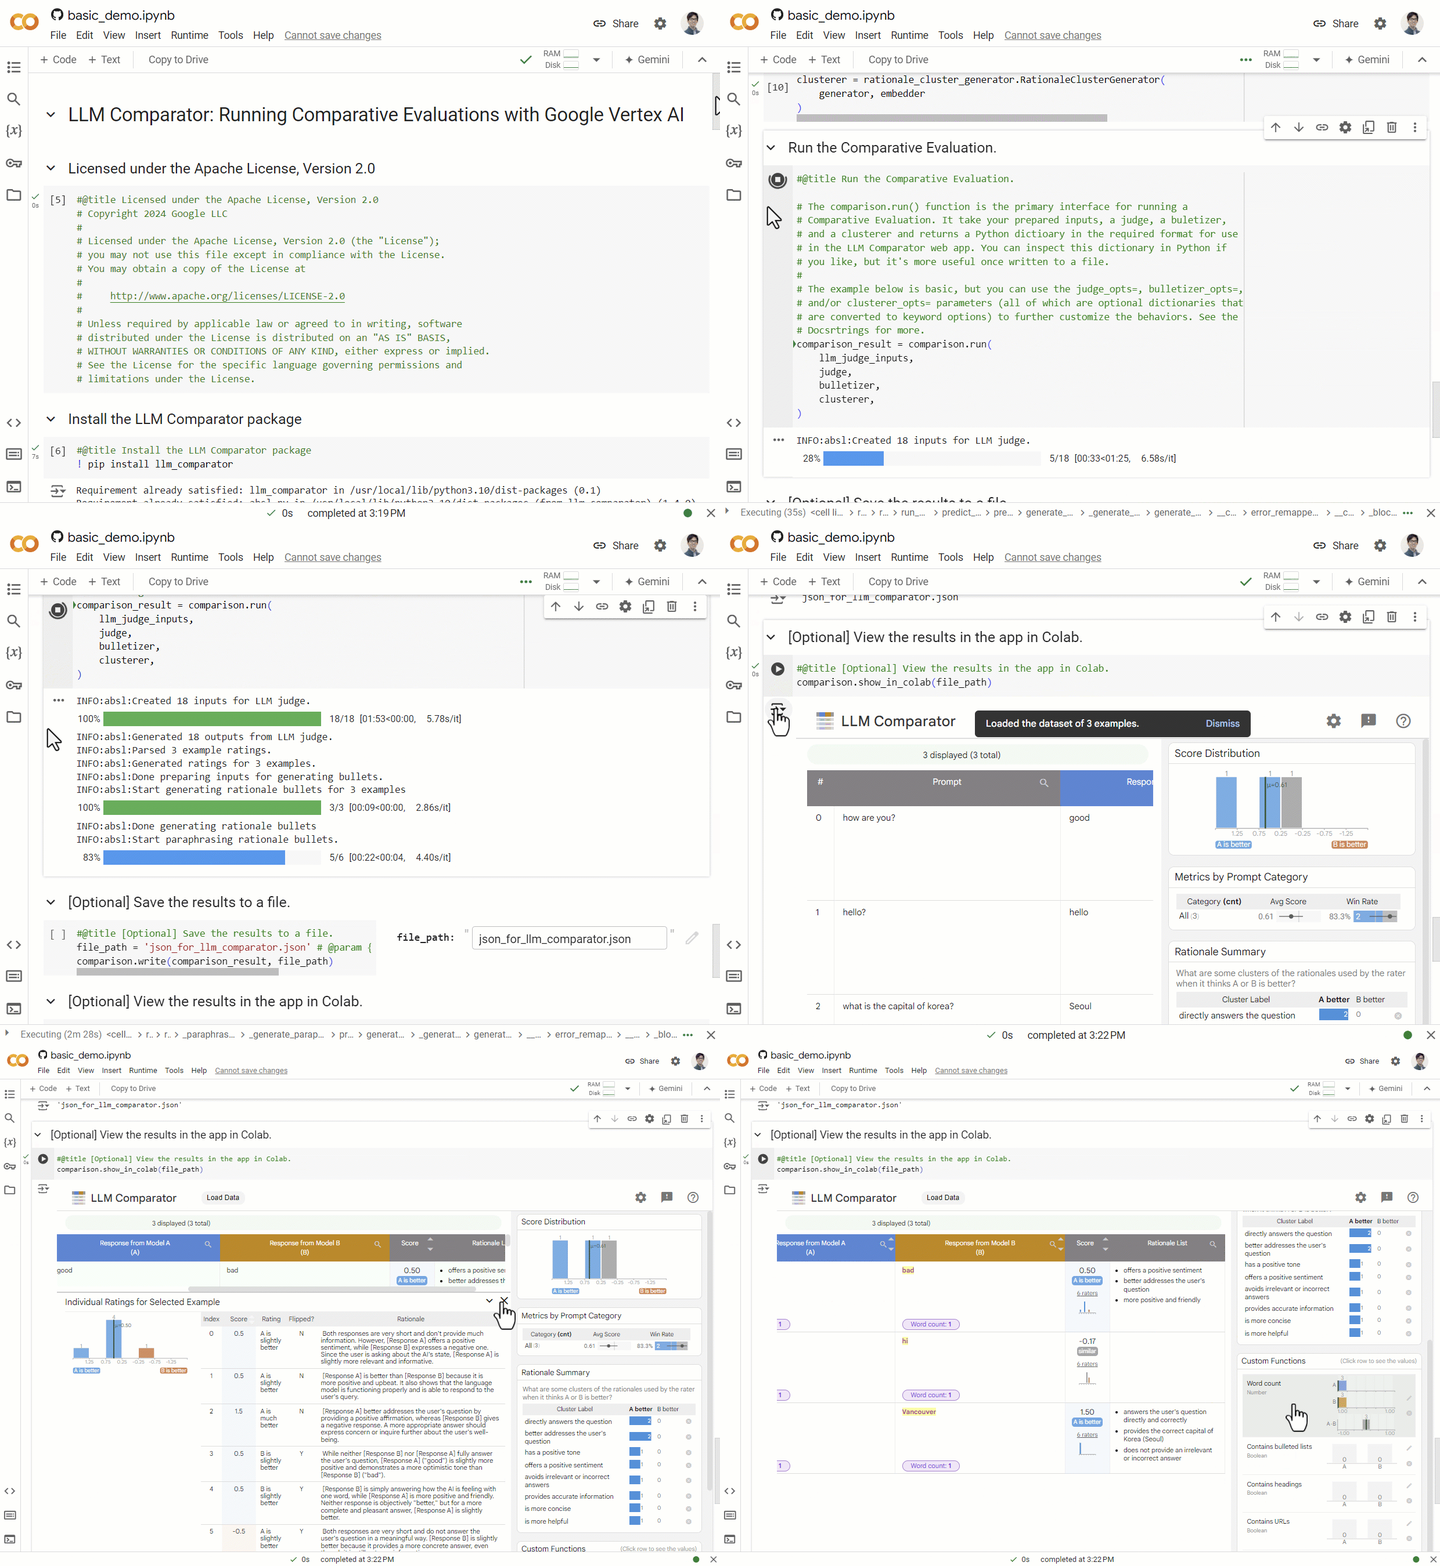
This project provides the llm-comparator package on PyPI, which create JSON
files for use with the LLM Comparator visualization. This package can create the
entire JSON file, including side-by-side LLM-based evaluation and rationale
clusters, given a set of input prompts to run and models to run them on. Or, if
a user already has prompts and an existing set of model outputs, it can perform
just the rationale clustering steps. You can simply run a notebook to create a
JSON file and see the results at
basic_demo.ipynb.
For more details, see the
Python library README.
The LLM Comparator tool takes a JSON file and visualizes its content. The file must follow the schema described below.
We assume that a user has a set of input prompts to test. For each prompt, they need to prepare the responses to the prompt from two LLMs (i.e., Model A, Model B), and a numerical score obtained from side-by-side evaluation (e.g., LLM-as-a-judge, AutoSxS). A positive score represents that A's response is better than B's; a negative score indicates B is better; and zero meaning a tie. We assume that the scores are in the range of 1.5 to -1.5.
The data file should be formatted like below. All the fields presented below are required.
{
    "metadata": [
        "source_path": "Any string for your records (e.g., run id)",
        "custom_fields_schema": []
    ],
    "models": [
        {"name": "Short name of your first model"},
        {"name": "Short name of your second model"}
    ],
    "examples": [
        {
            "input_text": "This is a prompt.",
            "tags": ["Math"],  # A list of keywords for categorizing prompts
            "output_text_a": "Response to the prompt from the first model (A)",
            "output_text_b": "Response to the prompt from the other model (B)",
            "score": -1.25,  # Score from the judge LLM
            "individual_rater_scores": [],
            "custom_fields": {}
        },
        {
            "input_text": "This is a next prompt.",
            ...
        }
    ]
}
You can optionally provide additional information to be analyzed in LLM Comparator.
If you have additional information about each prompt, it can be displayed as columns in the table and aggregated information is visualized as charts on the right side of the interface. It supports various data types, such as:
number: Numeric data, visualized as histograms (e.g., word count for prompt, safety score computed from an external API).category: Categorical data in string, visualized as bar charts (e.g., name of data sources for prompt).text: For long text (rendered with scrollable holders).string: Generic string (can be used for ID key).image_path: For image url.image_byte: Raw image byte string in base64 encoding of jpeg.
The tool also supports cases when you have values obtained from each of the two
model responses. We call these as per_model types, including:
per_model_boolean: Boolean value applied to each response (e.g., whether containing bulleted lists).per_model_number: Numeric value from each response (e.g., word count).per_model_category: Categorical strings applied to each response (e.g., tone of text).
This information can be formatted like this:
{
	"metadata": {
		"source_path": "...",
		"custom_fields_schema": [
			{"name": "prompt_word_count", "type": "number"},
			{"name": "word_overlap_rate_between_a_b", "type": "number"},
			{"name": "data_source", "type": "category"},
			{"name": "unique_id", "type": "string"},
			{"name": "is_over_max_token", "type": "per_model_boolean"},
			{"name": "TF-IDF_between_prompt_and_response", "type": "per_model_number"},
			{"name": "writing_style", "type": "per_model_category"},
		]
	},
	"models": [{...}, {...}],
	"examples": [
		{
			"input_text": "Which city should I visit in South Korea?",
			"tags": ["Travel"],
			"output_text_a": "You can visit Seoul, the capital of South Korea.",
			"output_text_b": "You can visit Seoul, Busan, and Jeju.",
			"score": 0.5,
			"individual_rater_scores": [],
			"custom_fields": {
				"prompt_word_count": 8,
				"word_overlap_rate_between_a_b": 0.61,
				"data_source": "XYZ",
				"unique_id": "abc000",
				"is_over_max_token": [true, false],
				"TF-IDF_between_prompt_and_response": [0.31, 0.15],
				"writing_style": ["Verbose", "Neutral"]
			}
		},
		{
            "input_text": "How to draw bar charts using Python?",
            ...
LLM-based automatic side-by-side evaluation is often repeated multiple times. It is due to two factors: position bias, where the order of two model responses can influence results, and non-deterministic sampling, where varying model responses occur with non-zero temperature settings.
LLM Comparator can display the detailed information on individual runs. This allows users to analyze score distribution and rationales used by the LLM judge.
This information can be embedded in the individual_rater_scores property like
below:
{
    "metadata": [
        "source_path": "...",
        "custom_fields_schema": [],
    ]
    "models": [
        {"name": "Gemma 1.1"},
        {"name": "Gemma 1.0"},
    ],
    "examples": [
        {
            "input_text": "Which city should I visit in South Korea?",
			"tags": ["Travel"],
			"output_text_a": "You can visit Seoul, the capital of South Korea.",
			"output_text_b": "You can visit Seoul, Busan, and Jeju.",
			"score": 0.5,
            "individual_rater_scores": [
                {
                    "is_flipped": false,
                    "score": 1.5,
                    "rationale": "A describes more information about ...",
                },
                {
                    "is_flipped": false,
                    "score": -0.5,
                    "rationale": "While A provides one option, B gives ...",                }
            ],
            "custom_fields": {},
        },
        {
            "input_text": "How to draw bar charts using Python?",
            ...
        }
    ]
}
git clone https://github.com/PAIR-code/llm-comparator.git
cd llm-comparator
npm install
npm run build
npm run serveIf you use LLM Comparator as part of your work, please cite our research paper at https://arxiv.org/abs/2402.10524.
@inproceedings{kahng2024comparator,
    title={{LLM Comparator}: Visual Analytics for Side-by-Side Evaluation of Large Language Models},
    author={Kahng, Minsuk and Tenney, Ian and Pushkarna, Mahima and Liu, Michael Xieyang and Wexler, James and Reif, Emily and Kallarackal, Krystal and Chang, Minsuk and Terry, Michael and Dixon, Lucas},
    booktitle={Extended Abstracts of the CHI Conference on Human Factors in Computing Systems},
    year={2024},
    publisher={ACM},
    doi={10.1145/3613905.3650755},
    url={https://arxiv.org/abs/2402.10524}
}
This is not an official Google product.
LLM Comparator is a research project under active development by a small team. There will be some bugs, but we are releasing at an early stage because we think it is pretty useful already.

