Make Linked Booster benchmarking less painful
This helps:
- Capture screen at specific regions with interval
- Read texts from screenshots with OCR
- Extract benchmark values from OCR-ed text
Built with:
- Tesseract.js: OCR module using AI
- sharp: Used for image processing to help Tesseract read image with higher accuracy
Quick Demo
Demo.OCR.mp4
- Node 14+
- Python 3.8
- Windows OS
Open Terminal, run:
npm install -g node-gyp
npm install -g windows-build-tools
Open project root folder, run:
yarn install* mean required
node screen-capture.js| Params | Description | Value |
|---|---|---|
| dashboard * | Coordinates of Dashboard region | [left]-[top]-[width]-[height] |
| task-manager * | Coordinates of Task Manager region | [left]-[top]-[width]-[height] |
| namespace * | Name of the capture | Differentiate different captures |
| interval | Interval between captures in milliseconds | A number. Default: 1000 |
node screen-capture.js --dashboard 627-592-309-88 --task-manager 1032-76-859-283 --namespace snapshots_1node extract-texts.js| Params | Description | Value |
|---|---|---|
| namespace * | Name of the capture do you want to analyze | Capture name: Ex: capture_1 |
| batch-size * | The tool process images in batches. Higher batch size will slightly reduce processing time (about 5 - 10%) but more chance of unexpected error while running | A number. Default: 3 |
node extract-texts.js --batch-size 4 --namespace snapshots_1node benchmark.js| Params | Description | Value |
|---|---|---|
| namespace * | Name of the capture do you want to analyze | Capture name: Ex: capture_1 |
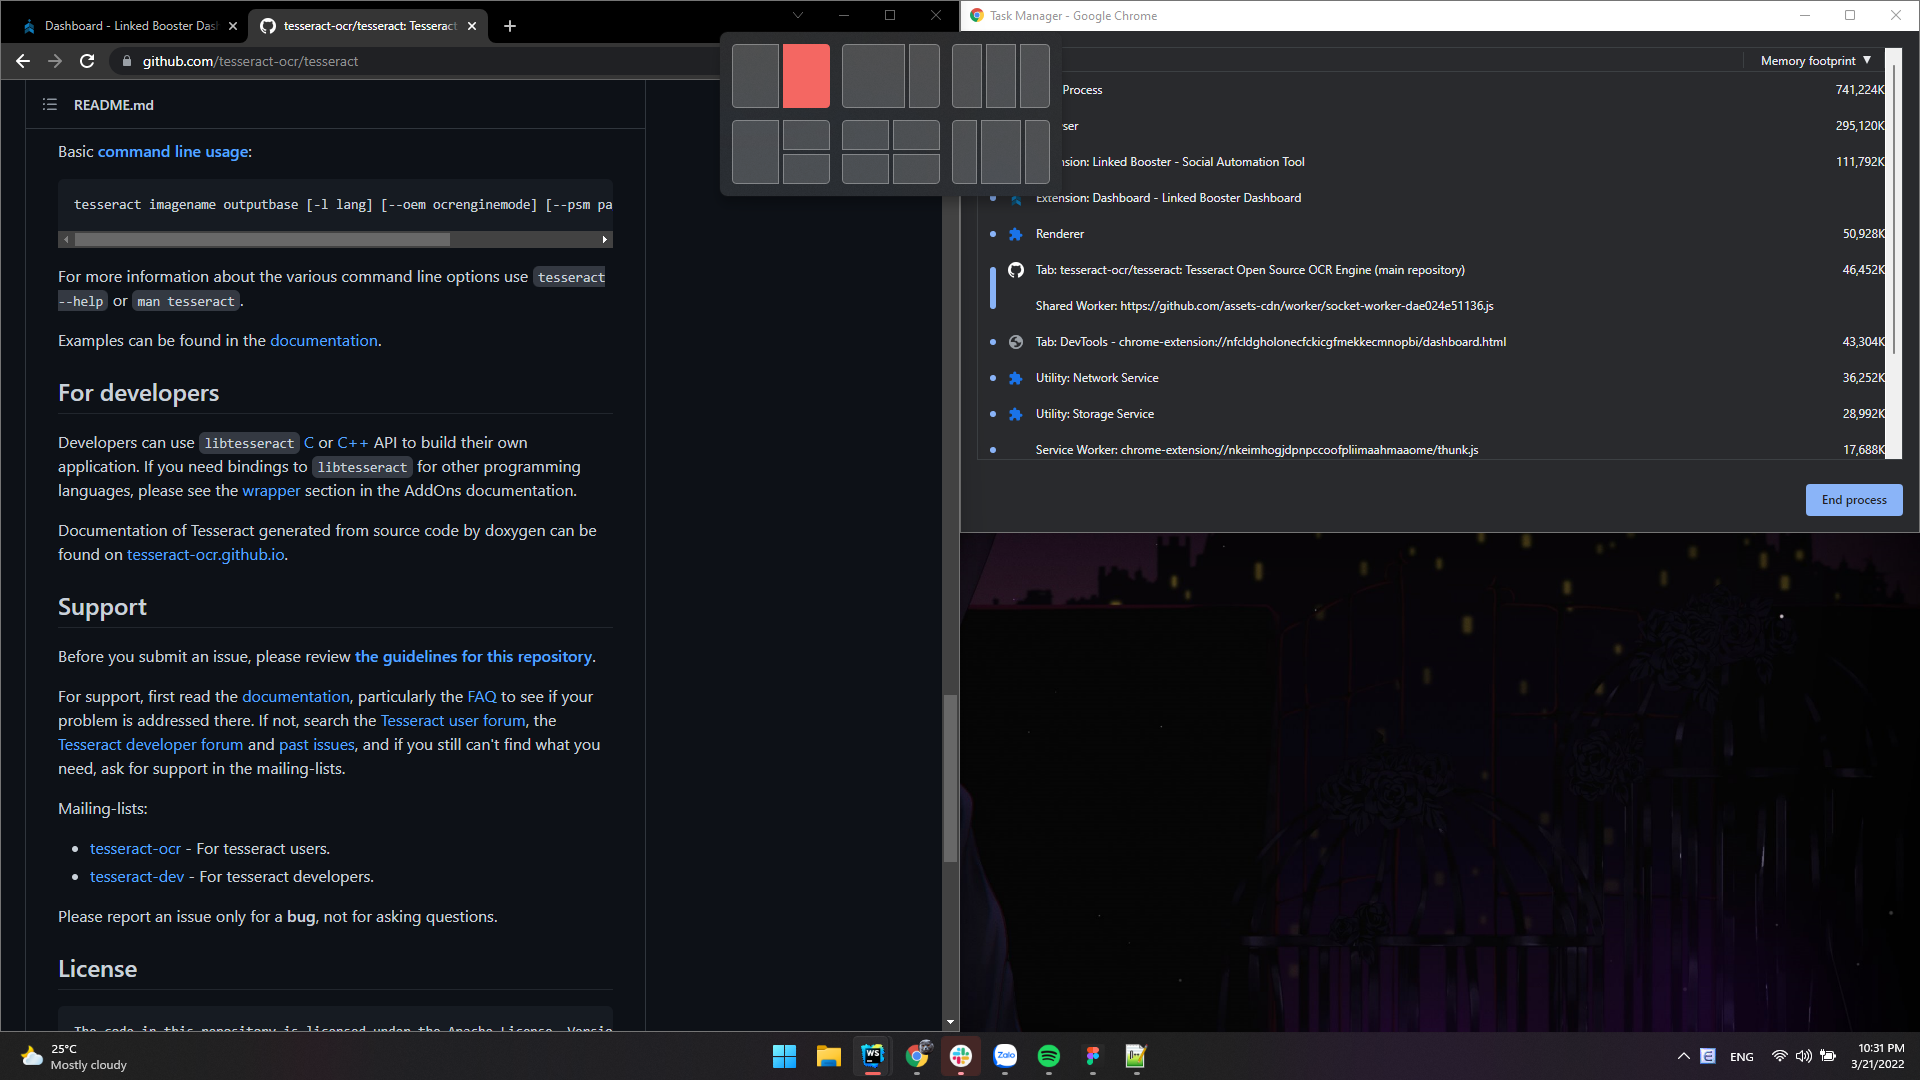
node benchmark.js --namespace snapshots_1- Open Chrome and Chrome Task Manager on your Primary Display, put them to equal grids like this
- Use some image editing tools to find coordinates of the regions you want to capture. For example.
- Dashboard region:
left: 620,top: 613,width: 309,height: 88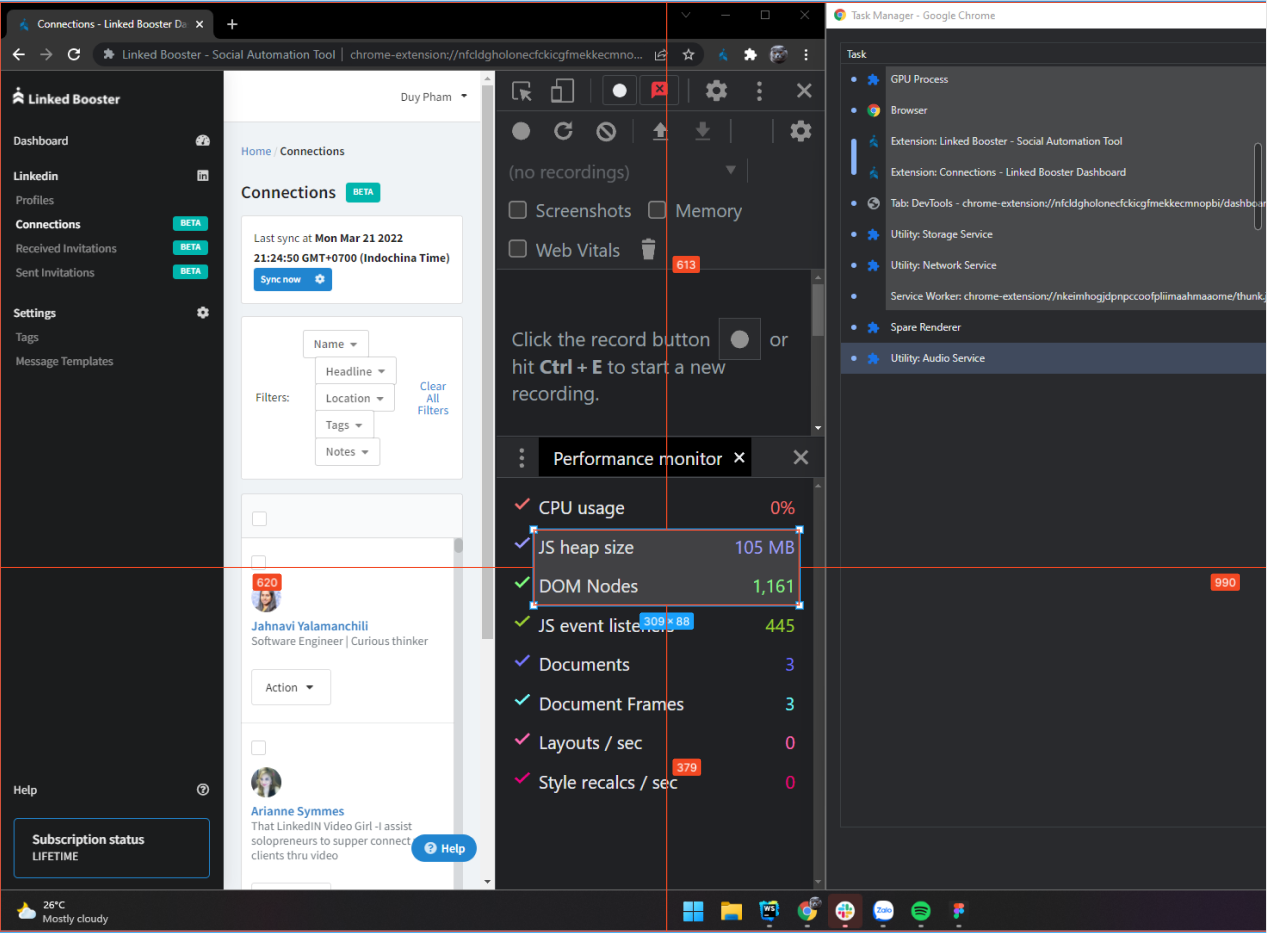
- Task manager region:
left: 1029,top: 75,width: 859,height: 283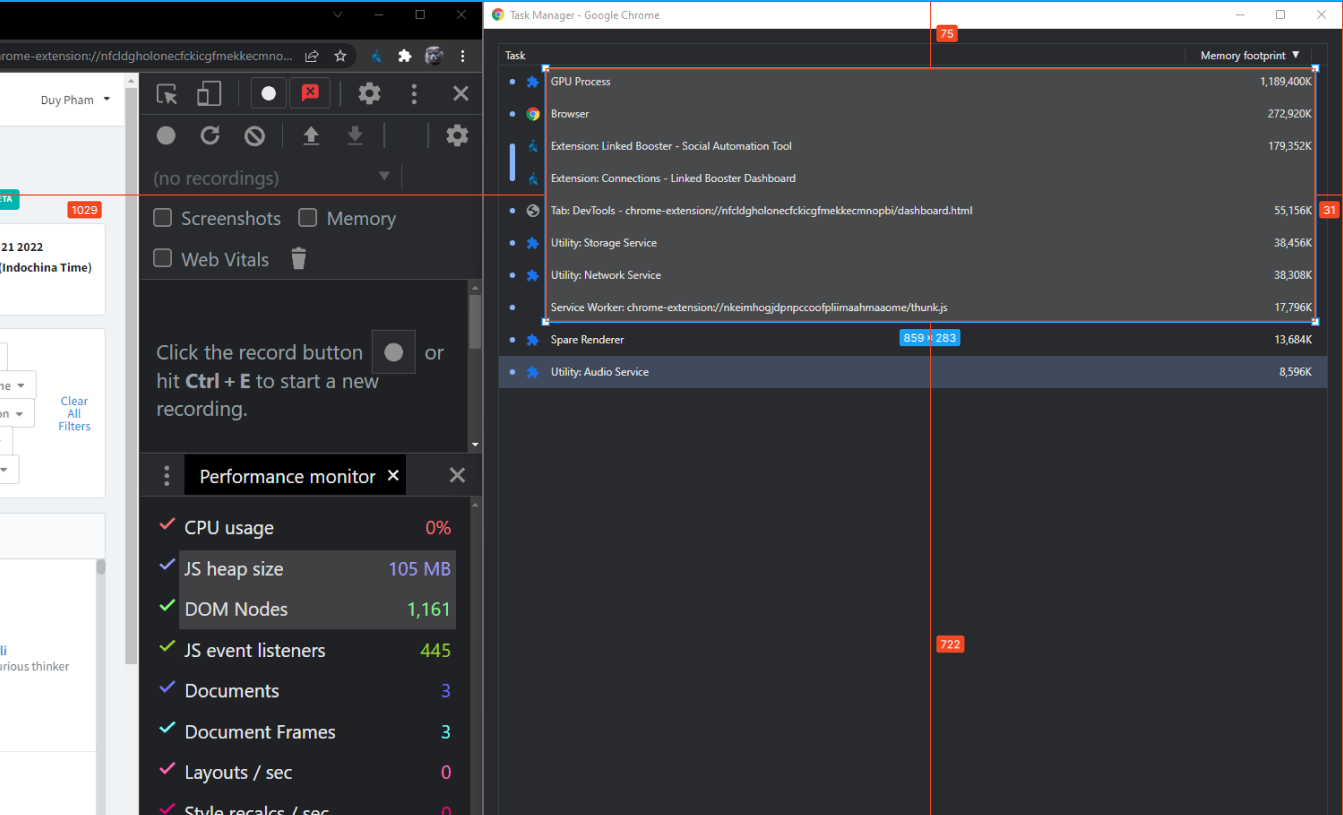
- Open Extensions page and disable others extensions
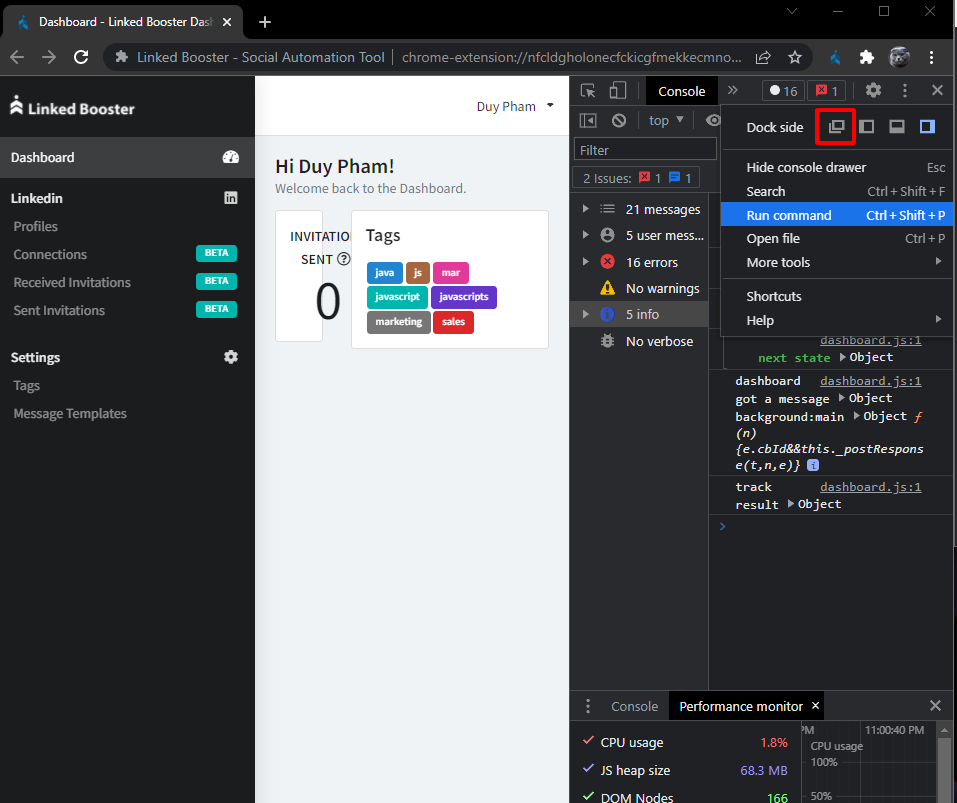
- Open Dashboard Devtools. Select display mode as floating windows
- Focus on the floating Devtools and press Ctrl + Shift + I to open the root Devtools
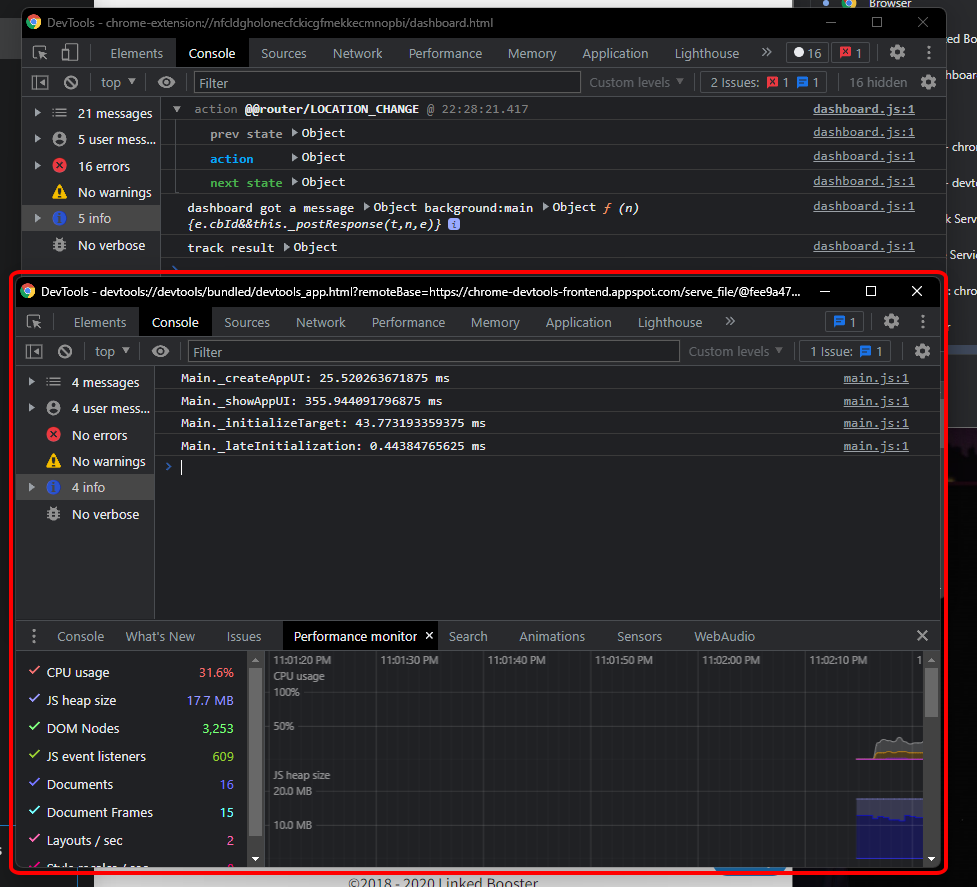
- Paste in this code into the Console and Enter. It will throttle CPU in half. Can customize throttling rate with the
rateoptions
let Main = await import('./devtools-frontend/front_end/entrypoints/main/main.js');
await Main.MainImpl.sendOverProtocol('Emulation.setCPUThrottlingRate', { rate: 2 });- After arranging windows and identify capturing regions coordinates
- Start terminal at root folder
- Run Command I to capture. Ctrl + C to stop capturing
- Run command Command II with
--namespacesame as step 3 - Run command Command III with
--namespacesame as step 3 - The benchmark values will be logged to Terminal
Find the file with name: eng.traineddata in the root folder and delete it, then run the command again
