NOTE: Exercises were either proposed or designed by the course instructores, Gergely Neu and Hrvoje Stojic.
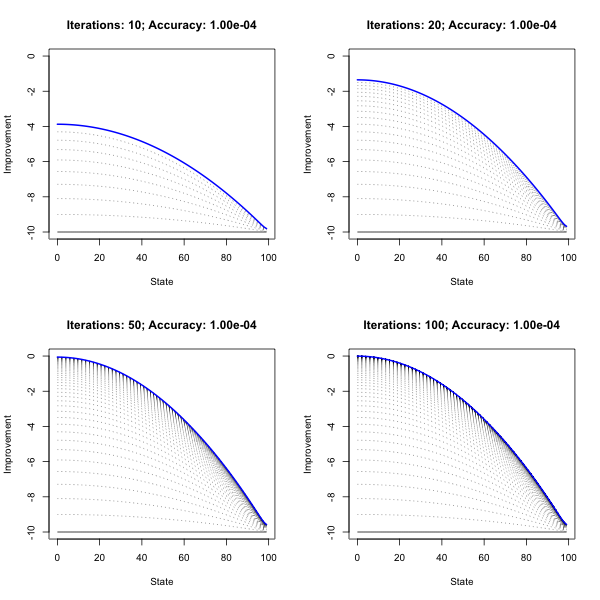
Problem Set 1 is about implementing policy evaluation and iteration methods for a simple Markov Decision Process. Implementation in R closely follows Sutton and Barto (2018). The chart below demonstrates how the optimal policy and value function is gradually learned through value iteration.
knitr::include_graphics("www/value_iteration.png")Problem Set 2 replicates an empirical evaluation of
Thompson Sampling (Chapelle and Li 2011). Code for this problem has been
implemented in R and performance-enhanced through Rcpp (C++).
To run the simulation from the command line, simply execute the command
below. This will clone the git repo to your device and run the
simulation with parameters specified in run_simulation.
git clone https://github.com/pat-alt/reinforcement_learning.git
cd reinforcement_learning
Rscript -e 'source("requirements.R"); run_simulation(n_sim=5,horizon=1e6,update_every = 100)'
open 'www/user_sim.png'
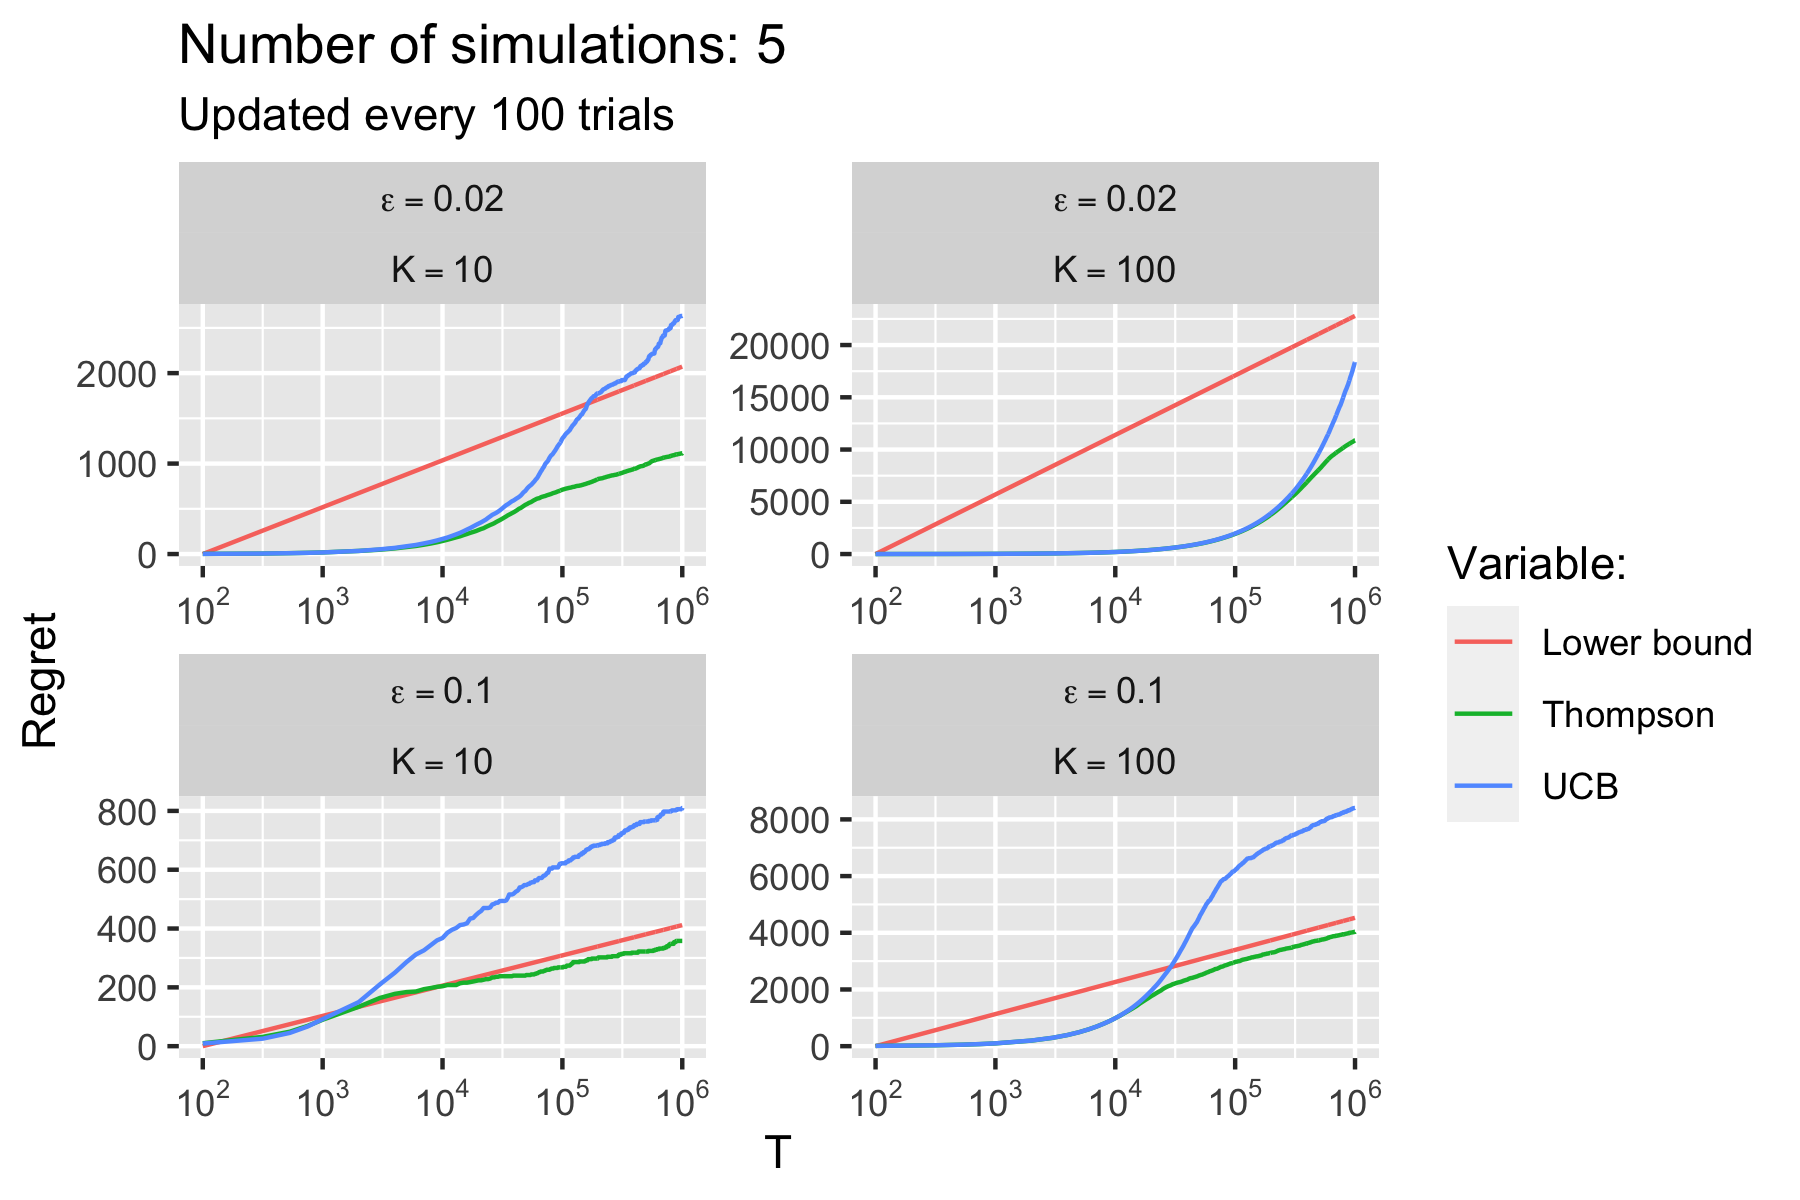
With the given set of parameters the computations should only take a few minutes and the resulting chart should looks something like this:
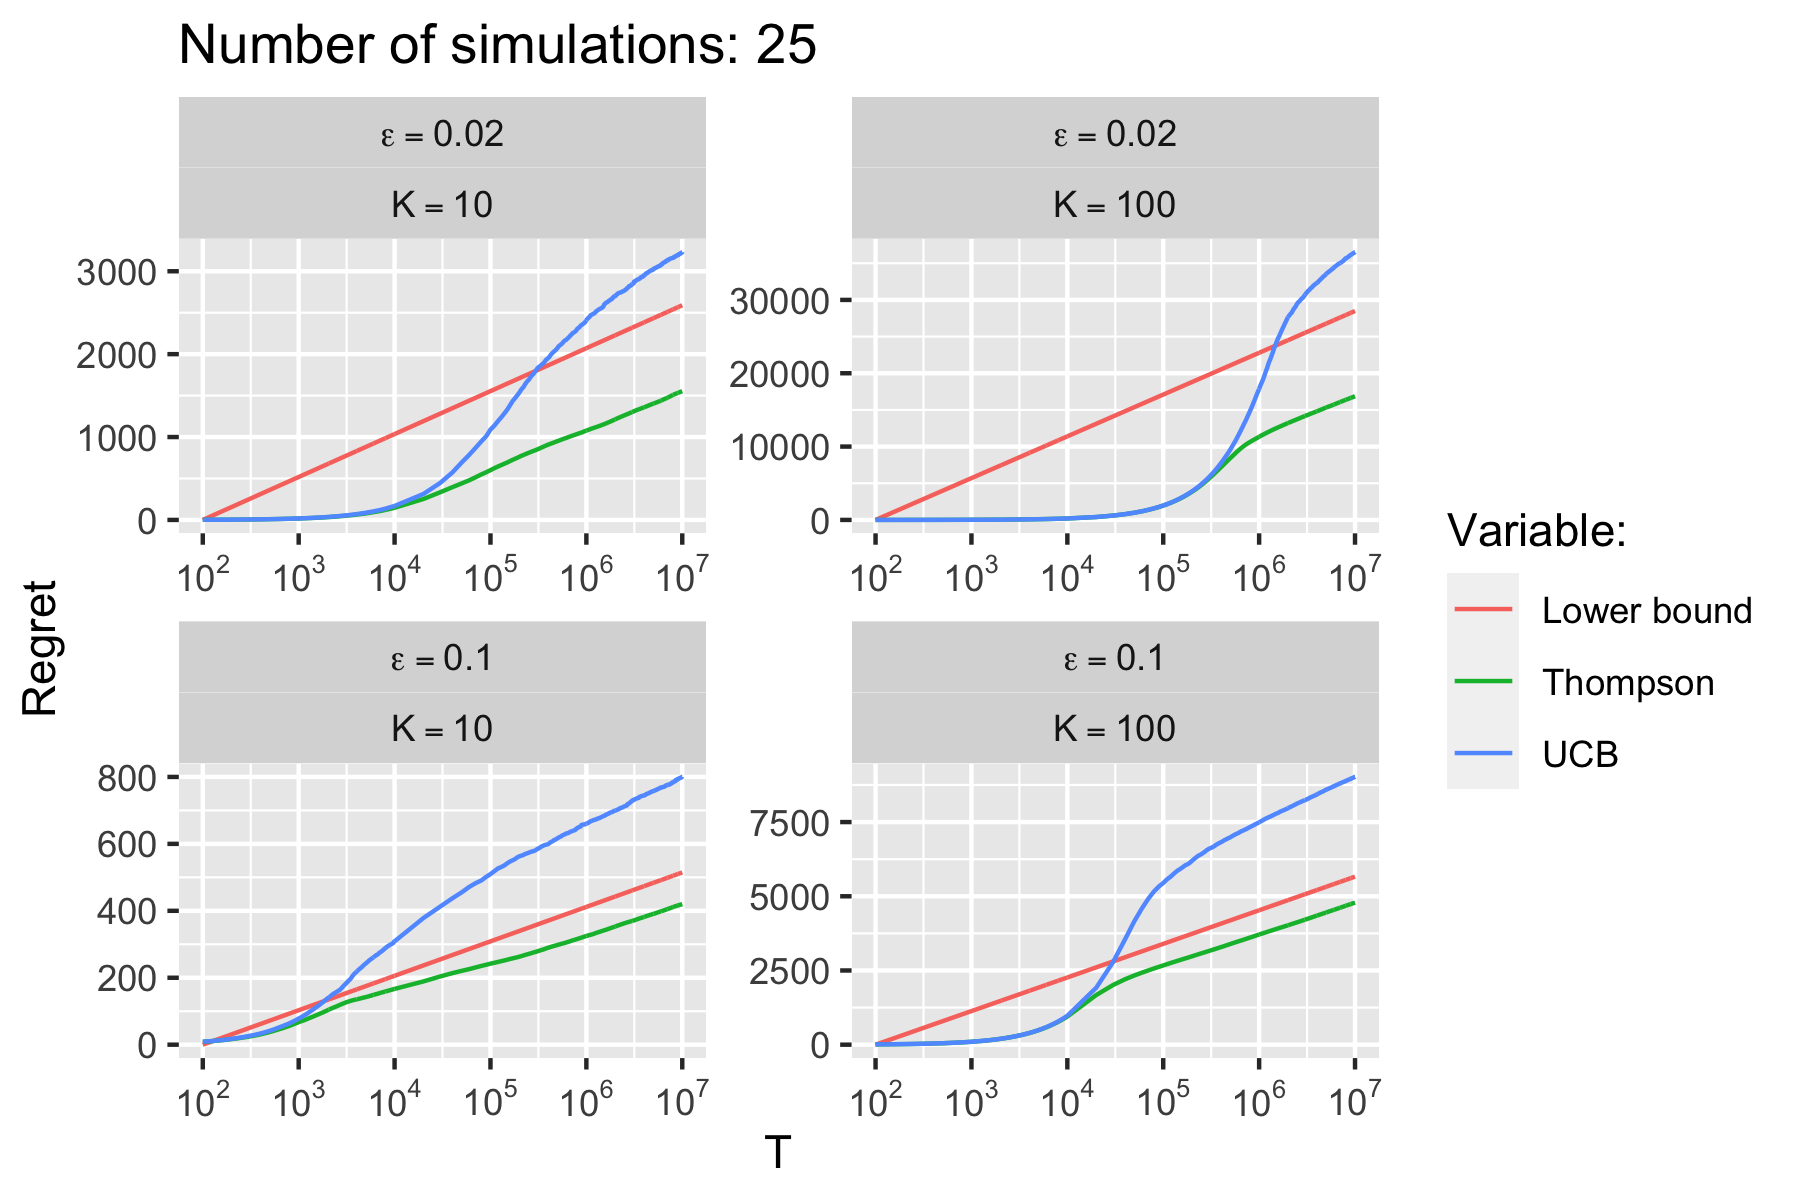
knitr::include_graphics("www/user_sim.png")The results from the full simulation are shown below. All details and documentation can be found in the HTML document.
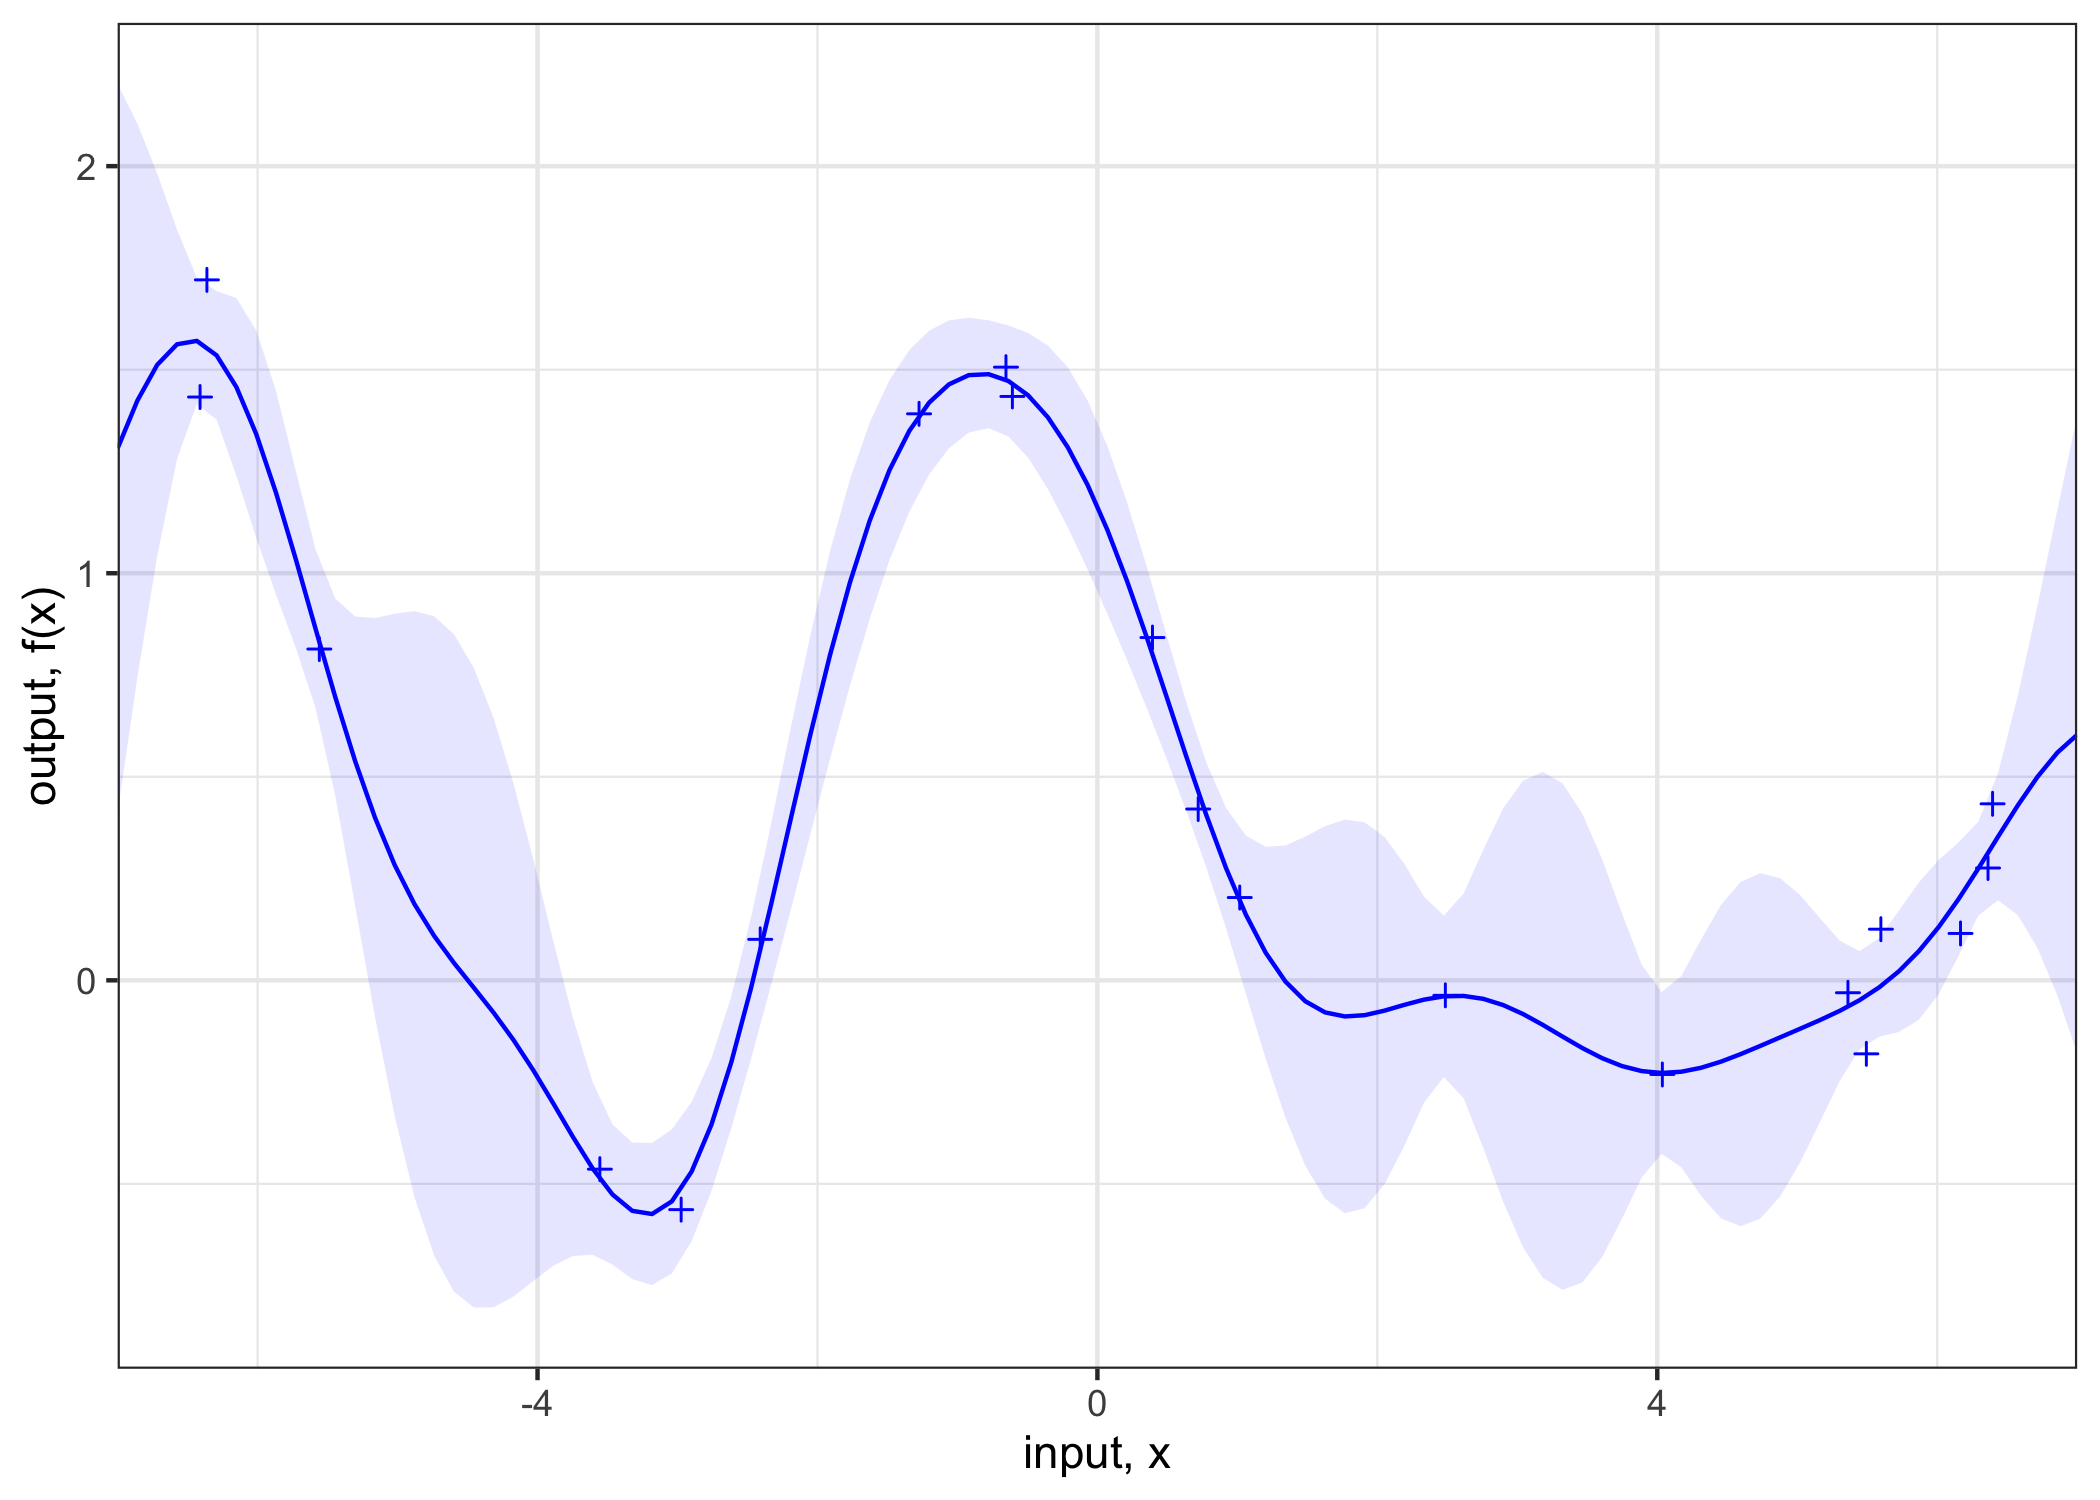
knitr::include_graphics("www/ps1_sim.png")The first part of Problem Set 3 is about Gaussian Process Regression. The plot below shows the output from a Gaussian Process Regression with 20 training points.
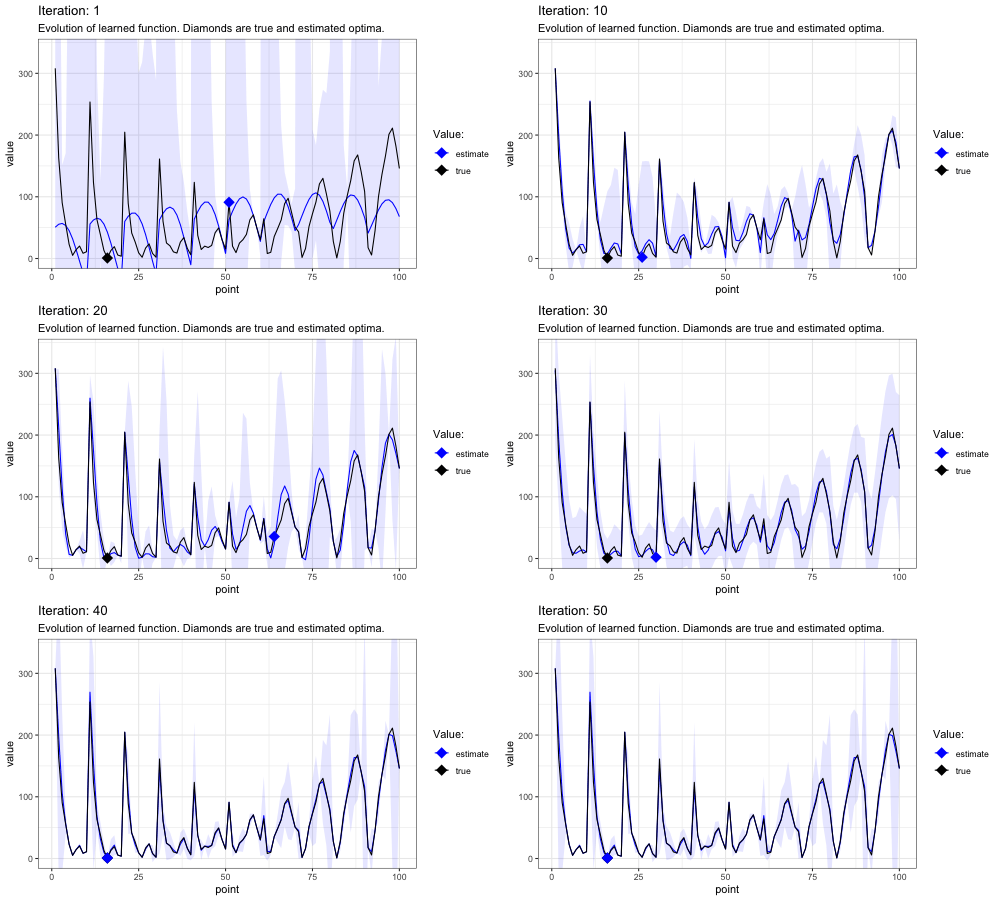
knitr::include_graphics("www/gp_reg.png")The Bayes Optimizer gradually gets better at estimated the true function values. As it explores different points on the test grid uncertainty around these points shrinks. Sometimes the overall magnitude of the confidence interval suddenly appears to change which corresponds to occasions when the estimates of optimal hyperparameters change significantly. Eventually the learned function values are very close to true function values and the proposed optimum corresponds to the true optimum (among the test points).
knitr::include_graphics("www/bayes_opt.gif")The Figure below shows the loss evolution with different acquisition functions for varying exploration parameters (by row). For UCB and EI the results are intuitive with the former performing better overall: as the exploration rate increases they are more likely to explore and hence at times commit errors. For PI the results are poor across the board. The choices of the eploration rate may be too high for PI. Another explanation may be that due to computational constraints, I have run the multi-started hyperparameter optimization only every five iterations.
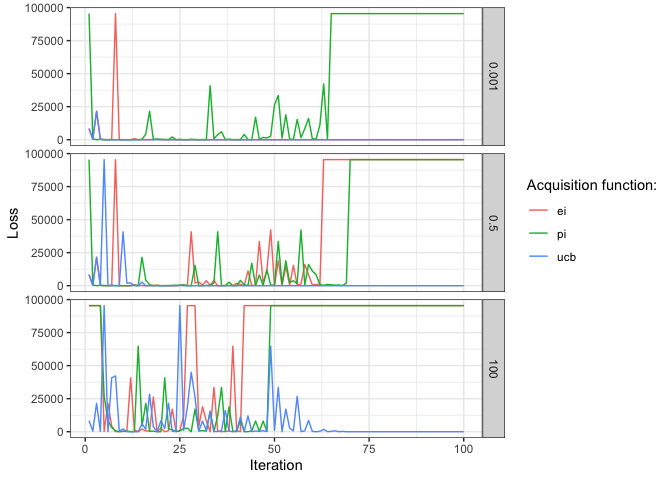
Comparison of loss evolution with different acquisition functions for varying exploration parameters (by row).
There are two fundamental challenges of reinforcement learning (RL):
- Reward and transition functions are unknown.
- The state and action space are large.
Approximate Dynamic Programming deals with both challenges.
The chart below shows the approximate evaluations of the two deterministic policies for different numbers of sample transitions (across columns) and different feature maps (across rows). Broadly speaking the estimates tend to be less noisy as the number of sample transitions increases.
Approximate policy iteration is noisy for high states. Nonetheless the proposed policies are close two optimal:
Chapelle, Olivier, and Lihong Li. 2011. “An Empirical Evaluation of Thompson Sampling.” Advances in Neural Information Processing Systems 24: 2249–57.
Sutton, Richard S, and Andrew G Barto. 2018. Reinforcement Learning: An Introduction. MIT press.
utils::sessionInfo()## R version 4.0.3 (2020-10-10)
## Platform: x86_64-apple-darwin17.0 (64-bit)
## Running under: macOS High Sierra 10.13.6
##
## Matrix products: default
## BLAS: /Library/Frameworks/R.framework/Versions/4.0/Resources/lib/libRblas.dylib
## LAPACK: /Library/Frameworks/R.framework/Versions/4.0/Resources/lib/libRlapack.dylib
##
## locale:
## [1] en_US.UTF-8/en_US.UTF-8/en_US.UTF-8/C/en_US.UTF-8/en_US.UTF-8
##
## attached base packages:
## [1] stats graphics grDevices utils datasets methods base
##
## other attached packages:
## [1] ggplot2_3.3.3 data.table_1.14.0
##
## loaded via a namespace (and not attached):
## [1] knitr_1.30 magrittr_2.0.1 tidyselect_1.1.0 munsell_0.5.0
## [5] colorspace_2.0-1 R6_2.5.0 rlang_0.4.11 fansi_0.5.0
## [9] highr_0.8 dplyr_1.0.2 stringr_1.4.0 tools_4.0.3
## [13] grid_4.0.3 gtable_0.3.0 xfun_0.23 utf8_1.2.1
## [17] withr_2.4.2 htmltools_0.5.1.1 ellipsis_0.3.2 yaml_2.2.1
## [21] digest_0.6.27 tibble_3.1.2 lifecycle_1.0.0 crayon_1.4.1
## [25] farver_2.1.0 purrr_0.3.4 vctrs_0.3.8 glue_1.4.2
## [29] evaluate_0.14 rmarkdown_2.6 labeling_0.4.2 stringi_1.5.3
## [33] compiler_4.0.3 pillar_1.6.1 generics_0.1.0 scales_1.1.1
## [37] pkgconfig_2.0.3
