A project to get metrics from a simple power meter (with pulse output) over WiFi into InfluxDB/Grafana.
PRs welcome!
There is a client (ESP32) and server (Node.JS) part to this project. Communication is through MQTT, so a MQTT broker the server and client can connect to is required.
Development hardware consisted of:
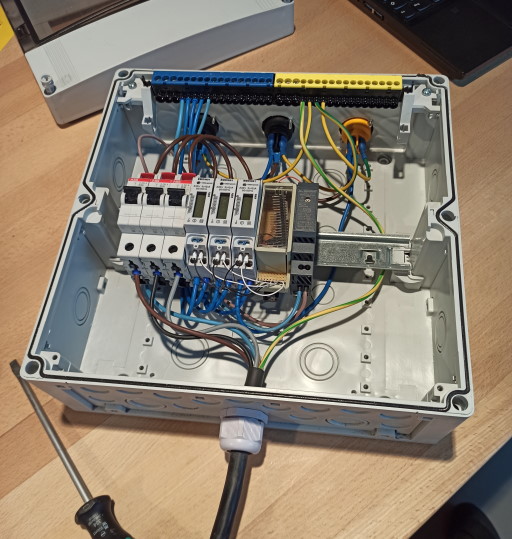
- Housing with DIN-rail
- 16A GFCI/circuit breaker combination
- MeanWell 5V 2.4A PSU
- cheap single-phase power meter with pulse output (1000 pulses per kWh)
- DIN-Rail housing for the ESP32
- Neutrik powerCON TRUE1 power in and out connectors
- misc. installation material (spade connectors, wire, ferrules, ...)
I also added a quite low (1k) pullup in addition to the internal pullup on the pulse input of the ESP32 because it was triggering when there was a power spike (EMF). A bit of debouncing had to be added to the code because even then the ESP still triggered so this might work without the additional resistor.
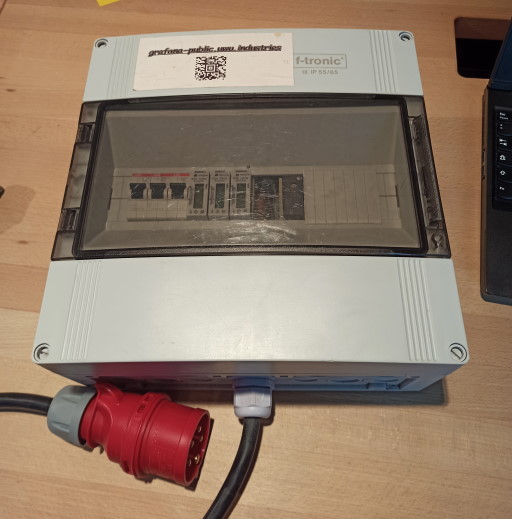
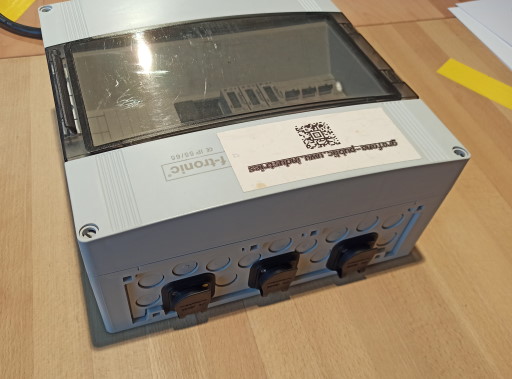
The powerCON TRUE1 power in was replaced by a CEE 16A three-phase plug and two breakers and power meters were added, so it can also can be used for power distribution and each phase is individually monitored and protected against over-current.
(full res pictures under hardware/)
The client sends its data to an MQTT Server for the server to subscribe to. Currently the exported metrics are:
- total watt-hours measured
- current power usage calculated
- internal ESP32 temperature (offset can be ±10°C, also it is not terribly accurate)
The client tries to subscribe to nearby Freifunk WiFi Networks, but you can also configure a private WiFi network.
config.cpp / config.h:
There are a few variables to set here (see config.example.h):
METER_NAME: client ID of this client (used for the MQTT topic)STATS_SEND_INTERVAL: temperature and uptime will be sent in this intervalmeterConfigs: multiple meters can be configured by increasingMETER_COUNTand adding array entriesmeterPulsePin: pin where the pulse output of the power meter is connected tominPulseLength: minimum pulse high/low time for debouncing (pulse is counted when the pulse has been high and then low for this amount of time)pulsesPerKilowattHour
The server subscribes to the MQTT topics of all power meters and collects the metrics. A few environment variables have to be set for this to work, the names should be self-explanatory. There is also a Dockerfile for the adapter, so the example configuration below is a docker-compose.yml file:
Sends the metrics to an InfluxDB Server.
version: "3"

services:
  powermeter-influxdb:
    restart: unless-stopped
    image: powermeter-influxdb
    build: ./esp32-power-monitor/server_influxdb # clone this git repo to ./esp32-power-monitor
    environment:
      - "MQTT_SERVER=mqtt://mqtt.example.com"
      - "MQTT_USER=powermeter"
      - "MQTT_PASSWORD=secretsecretsecret"
      - "INFLUX_SERVER=https://powermeter:secretsecretsecret@influxdb.example.com"
      - "INFLUX_INFLUX_DATABASE=powermeter"
- client-side
- support for multiple power meters per esp32 (e.g. three-phase)
- MQTTS


