Weather Data Dashboard
This repository houses the source code for a responsive Weather Data Visualizations Dashboard created to display global weather data for March 28, 2020.
The project was a basic dashboarding exercise using only HTML and CSS to demonstrate how to quickly and easily deploy data analyzed through Pandas and Matplotlib libraries for Python. The original dataset and graphs displayed in this dashboard are the product of an earlier python-API exercise found here.
Dashboard Contents
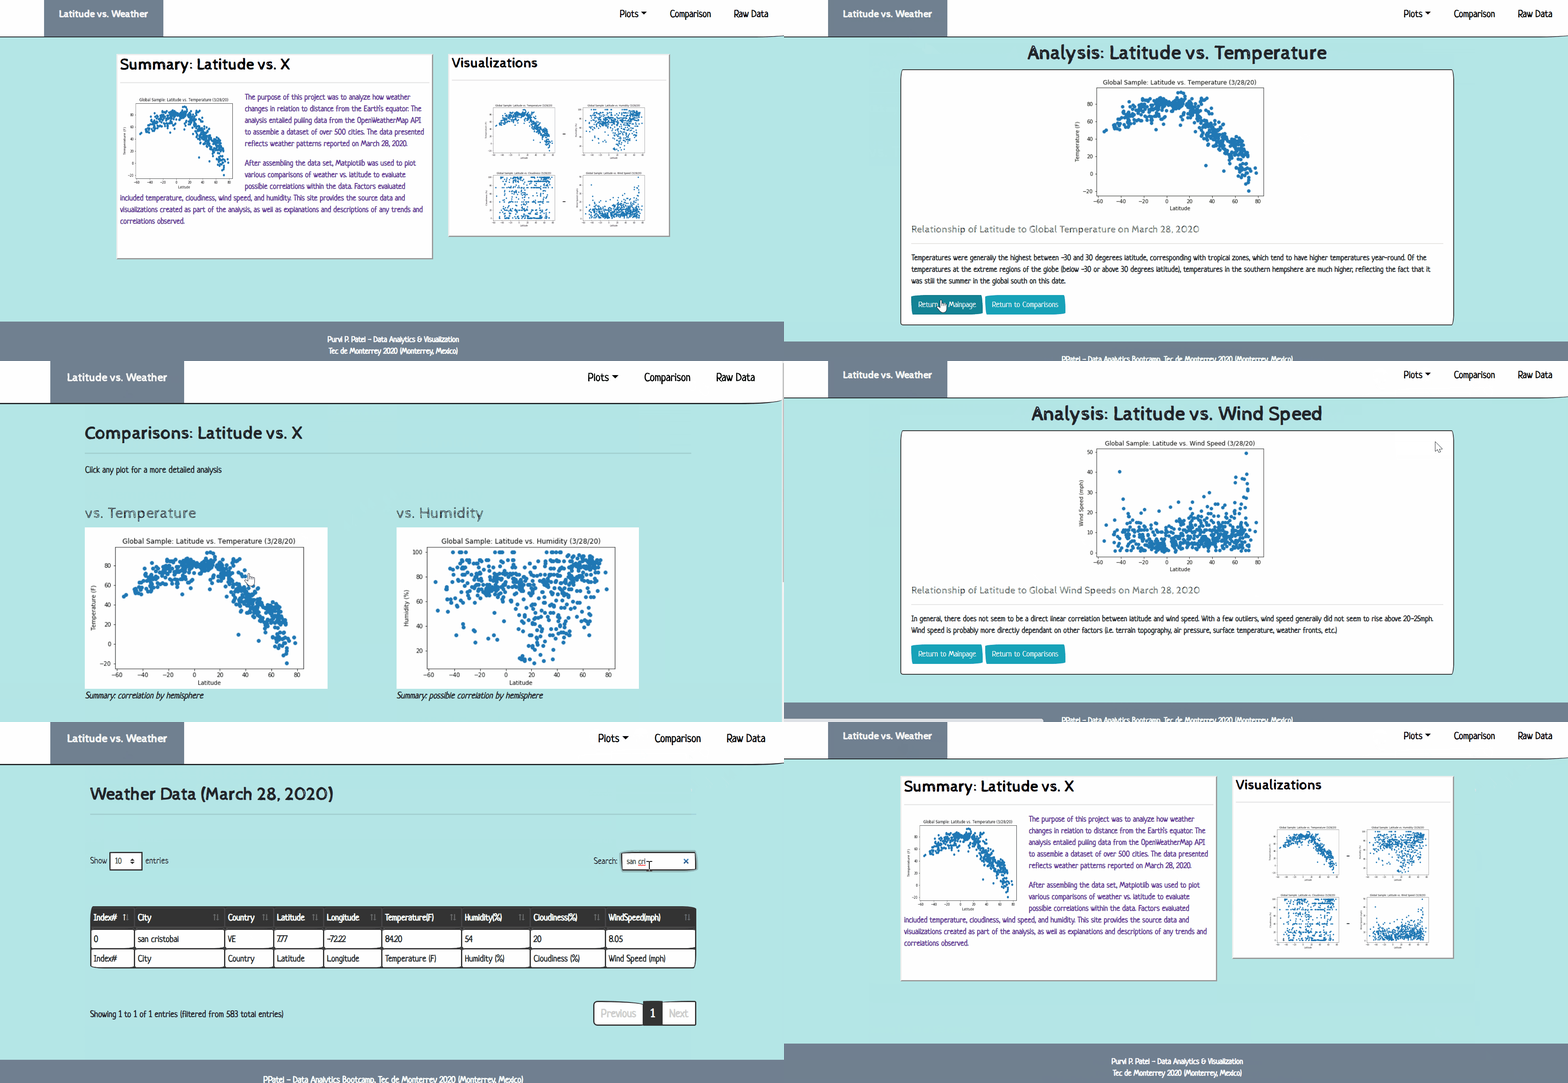
- A landing page containing:
- An explanation of the project.
- Links to each visualizations page.
- Four visualization pages (example: "Latitude vs. Temperature), each with:
- A descriptive title and heading tag.
- The plot/visualization itself for the selected comparison.
- A paragraph describing the plot and its significance.
- A "Comparisons" page that:
- Contains all of the visualizations on the same page for easy visual comparison.
- Uses a bootstrap grid for the visualizations.
- A "Data" page that:
- Displays a responsive bootstrap table containing the data used in the visualizations.
- The data comes from converting the
weatherdata-28.03.20.csvfile (located in the Resources folder) to HTML in pandas, and the copying to the Data page html file.
At the top of every page there is a navigation menu that:
- Has the name of the site on the left of the nav which allows users to return to the landing page from any page.
- Contains a dropdown on the right of the navbar named "Plots" which provides links to each individual visualization page.
- Provides two more links on the right: "Comparisons" which links to the comparisons page, and "Data" which links to the data page.
- Is responsive to changes in screen size.

