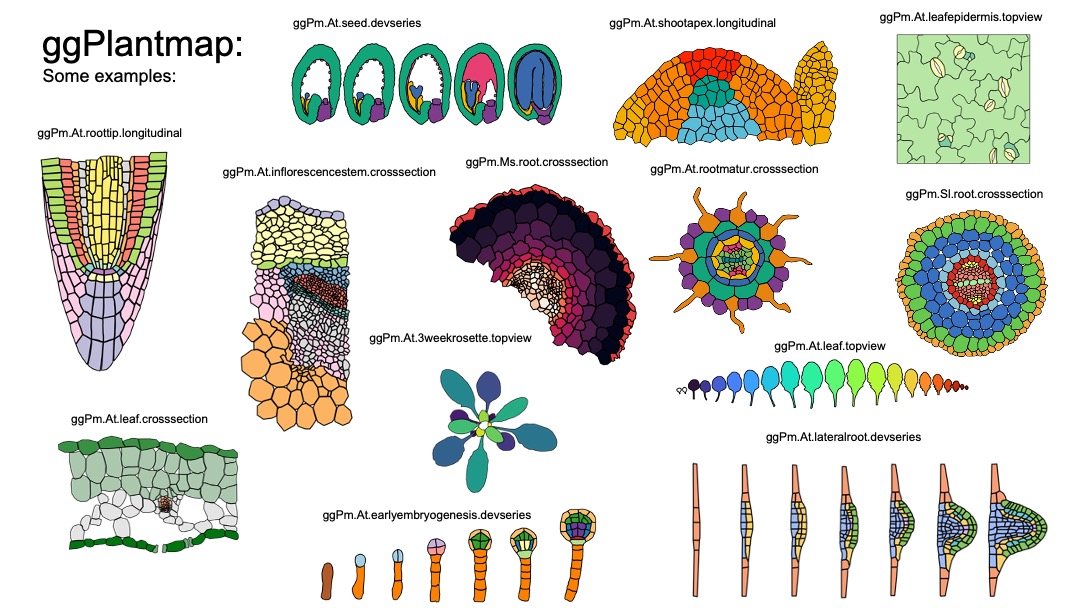
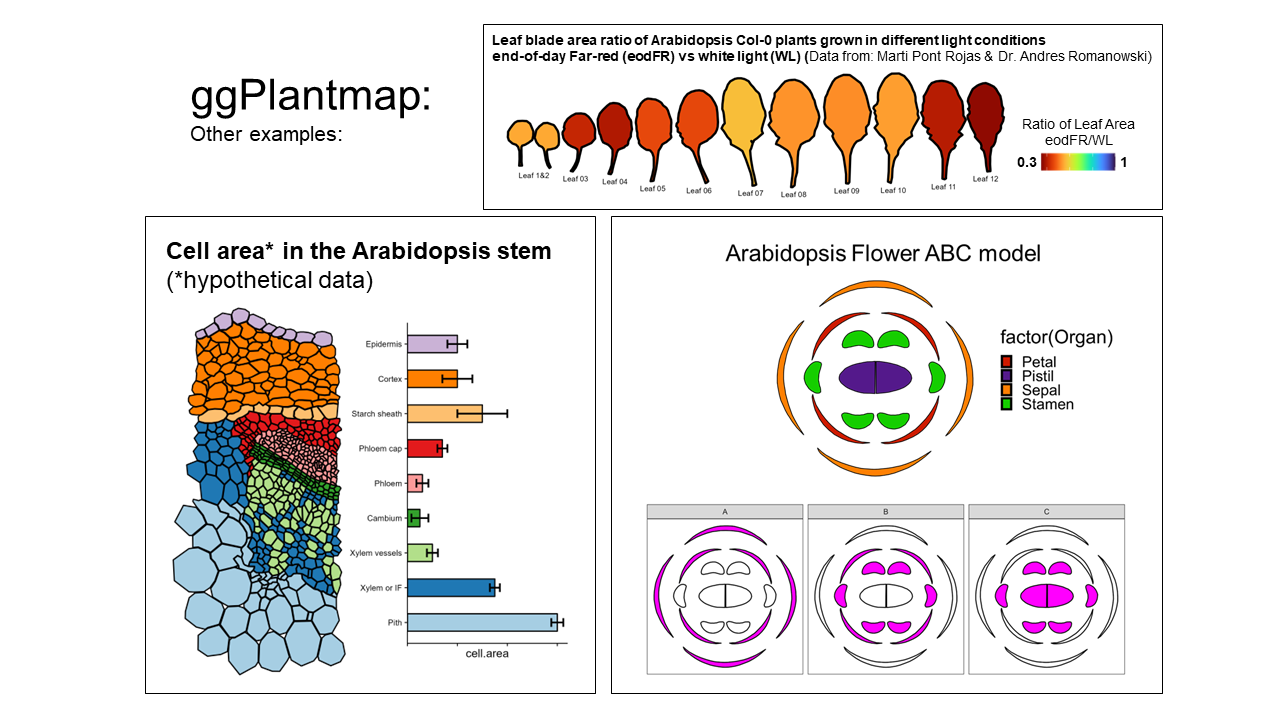
ggPlantmap is a R tidyverse based package with a series of plant images
to be mapped in a ggplot enviroment. We also provide a series of
functions and instructions to easily create your own personal
ggPlantmap. These ggPlantmap objects can be added into R pipelines for
the visual representation of quantitative data in distinct plant cells
and/or structures.

library(tidyverse)
library(XML)##install devtools (if you haven't already)
install.packages("devtools")
library(devtools)
## Installing from a github respository
install_github("leonardojo/ggPlantmap")Each unique ggPlantmap is a table (tibble) object with points coordinates (x,y) of specific polygons extracted from plant images.
library(ggPlantmap)
head(ggPm.At.roottip.longitudinal)
#> # A tibble: 6 × 7
#>   ROI.name    Level1   Level2 ROI.id point     x     y
#>   <chr>       <chr>    <chr>   <int> <int> <dbl> <dbl>
#> 1 Meristem.QC Meristem QC          1     1  121. -323.
#> 2 Meristem.QC Meristem QC          1     2  127. -315.
#> 3 Meristem.QC Meristem QC          1     3  134. -315.
#> 4 Meristem.QC Meristem QC          1     4  149. -318.
#> 5 Meristem.QC Meristem QC          1     5  149. -329.
#> 6 Meristem.QC Meristem QC 1 6 134. -327.The whole list of pre-loaded ggPlantmap objects can be found in the
table ggPm.summary. You can find the description of ggPlantmaps, as well
as information of its creator. Because most ggPlantmaps are based on
previously published plant images, the references for each specific
image can also be found in the summary table. We hope to keep updating
the ggPlantmap catalog, with the help of the plant research community.

head(ggPm.summary)
#> # A tibble: 6 × 9
#> ggPlantmap.name Species Tissue Type Descr…¹ Layers Image…² Made.by Conta…³
#> <chr> <chr> <chr> <chr> <chr> <chr> <chr> <chr> <chr>
#> 1 ggPm.At.roottip.c… Arabid… root cros… Cross-… Cells https:… Leonar… jo.leo…
#> 2 ggPm.At.roottip.l… Arabid… root long… Longit… Cells https:… Leonar… jo.leo…
#> 3 ggPm.At.3weekrose… Arabid… roset… top … Top vi… Leaves https:… Leonar… jo.leo…
#> 4 ggPm.At.leafepide… Arabid… leaf … top … Top vi… Cells https:… Leonar… jo.leo…
#> 5 ggPm.At.leaf.cros… Arabid… leaves cros… Cross-… Cells https:… Leonar… jo.leo…
#> 6 ggPm.At.seed.devs… Arabid… seed deve… Diagra… Cells… https:… Leonar… jo.leo…
#> # … with abbreviated variable names ¹Description, ²Image.Reference,
#> # ³Contact.Info
##Listing all the ggPlantmap objects
ggPm.summary$ggPlantmap.name
#> [1] "ggPm.At.roottip.crosssection"
#> [2] "ggPm.At.roottip.longitudinal"
#> [3] "ggPm.At.3weekrosette.topview"
#> [4] "ggPm.At.leafepidermis.topview"
#> [5] "ggPm.At.leaf.crosssection"
#> [6] "ggPm.At.seed.devseries"
#> [7] "ggPm.At.earlyembryogenesis.devseries"
#> [8] "ggPm.At.shootapex.longitudinal"
#> [9] "ggPm.At.inflorescencestem.crossection"
#> [10] "ggPm.Sl.root.crossection"
#> [11] "ggPm.At.leaf.topview"
#> [12] "ggPm.At.rootelong.longitudinal"
#> [13] "ggPm.At.rootmatur.crosssection"
#> [14] "ggPm.At.flower.diagram"
#> [15] "ggPm.At.lateralroot.devseries"
#> [16] "ggPm.Ms.root.crosssection"All ggPlantmaps are pre-loaded in the package, you can call them directly in your R environment by typing their name.
library(ggPlantmap)
##examples
ggPm.At.roottip.longitudinal
#> # A tibble: 1,541 × 7
#>    ROI.name    Level1   Level2 ROI.id point     x     y
#>    <chr>       <chr>    <chr>   <int> <int> <dbl> <dbl>
#>  1 Meristem.QC Meristem QC          1     1  121. -323.
#>  2 Meristem.QC Meristem QC          1     2  127. -315.
#>  3 Meristem.QC Meristem QC          1     3  134. -315.
#>  4 Meristem.QC Meristem QC          1     4  149. -318.
#>  5 Meristem.QC Meristem QC          1     5  149. -329.
#>  6 Meristem.QC Meristem QC          1     6  134. -327.
#>  7 Meristem.QC Meristem QC          2     1  150. -330.
#>  8 Meristem.QC Meristem QC          2     2  150. -318.
#>  9 Meristem.QC Meristem QC          2     3  156. -317.
#> 10 Meristem.QC Meristem QC          2     4  164. -316.
#> # … with 1,531 more rows
ggPm.At.roottip.crosssection
#> # A tibble: 1,408 × 5
#>    ROI.name  ROI.id point     x     y
#>    <chr>      <int> <int> <dbl> <dbl>
#>  1 Epidermis      1     1  156. -333.
#>  2 Epidermis      1     2  167. -332.
#>  3 Epidermis      1     3  177. -340.
#>  4 Epidermis      1     4  176. -380.
#>  5 Epidermis      1     5  173. -384.
#>  6 Epidermis      1     6  165. -387.
#>  7 Epidermis      1     7  157. -387.
#>  8 Epidermis      1     8  145. -381.
#>  9 Epidermis      1     9  142. -377.
#> 10 Epidermis      1    10  138. -371.
#> # … with 1,398 more rows
ggPm.Ms.root.crosssection
#> # A tibble: 2,441 × 5
#>    ROI.name ROI.id point     x     y
#>    <chr>     <int> <int> <dbl> <dbl>
#>  1 C1            1     1  270. -308.
#>  2 C1            1     2  234. -287.
#>  3 C1            1     3  241. -257.
#>  4 C1            1     4  271. -238.
#>  5 C1            1     5  285. -243.
#>  6 C1            1     6  307. -270.
#>  7 C1            1     7  298. -289.
#>  8 C1            1     8  284. -302.
#>  9 C1            2     1  285. -242.
#> 10 C1            2     2  308. -270.
#> # … with 2,431 more rowsYou can use the ggPlantmap.plot() function to quickly visualize your ggPlantmap.
##ggPlantmap.plot(data,layer,linewidth=0.5,show.legend=T)
ggPlantmap.plot(ggPm.At.roottip.longitudinal,ROI.id,linewidth = 1,show.legend = F)
If you have experience with ggplot, you can feed your a ggPlantmap object into a ggplot with the geom_polygon() function.
library(ggplot2)
ggplot(ggPm.At.roottip.longitudinal,aes(x,y)) +
  geom_polygon(aes(group=ROI.id,fill=factor(ROI.id)),show.legend = F,colour="black",linewidth=1) +
coord_fixed() ## important to keep the aspect ratio of the plotBecause each polygon on ggPlantmap is characterized by specific levels (examples: Region,Stage,Part), you can color map them individually. Just specify the column you want to colormap in the layer option of the function. ggPlantmap.plot() is based on ggplot so you can add specific modifications to it using ggplot coding logic.
library(ggplot2)
library(cowplot)

head(ggPm.At.seed.devseries)
#> # A tibble: 6 × 8
#>   ROI.name                           Stage Part  Region ROI.id point     x     y
#>   <chr>                              <chr> <chr> <chr>   <int> <int> <dbl> <dbl>
#> 1 Preglobular.seedcoat.Distal Seed … Preg… seed… Dista…      1     1  277. -693.
#> 2 Preglobular.seedcoat.Distal Seed … Preg… seed… Dista…      1     2  280. -689.
#> 3 Preglobular.seedcoat.Distal Seed … Preg… seed… Dista…      1     3  280. -685.
#> 4 Preglobular.seedcoat.Distal Seed … Preg… seed… Dista…      1     4  285. -681.
#> 5 Preglobular.seedcoat.Distal Seed … Preg… seed… Dista…      1     5  286. -675.
#> 6 Preglobular.seedcoat.Distal Seed … Preg… seed… Dista…      1     6  286. -669.

## Stage: Seed development stage
## Part: Distinct parts of a seed (Seed coat, Endosperm and Embryo)
## Region: Specific regions of each part of the Arabidopsis seed
## Reference: Belmonte, Mark F., et al. "Comprehensive developmental profiles of gene activity in regions and subregions of the Arabidopsis seed." Proceedings of the National Academy of Sciences 110.5 (2013): E435-E444.

a <- ggPlantmap.plot(ggPm.At.seed.devseries,Region,linewidth = 0.5) +
  scale_fill_brewer(palette="Set3") +
  ggtitle("Regions of Arabidopsis seed development") +
   theme(legend.key.height= unit(0.25, 'cm'),
        legend.key.width= unit(0.25, 'cm'))
b <- ggPlantmap.plot(ggPm.At.seed.devseries,Stage,linewidth = 0.5) +
  scale_fill_brewer(palette="Set1") +
  ggtitle("Stages of Arabidopsis seed development") +
   theme(legend.key.height= unit(0.25, 'cm'),
        legend.key.width= unit(0.25, 'cm'))
c <- ggPlantmap.plot(ggPm.At.seed.devseries,Part,linewidth = 0.5) +
  scale_fill_brewer(palette="Set1") +
  ggtitle("Parts of Arabidopsis seed development") +
   theme(legend.key.height= unit(0.25, 'cm'),
        legend.key.width= unit(0.25, 'cm'))
plot_grid(a,b,c,ncol=1,labels=c("a","b","c"),align = "v")
Each map will have their own classification. If you would like to adjust or create your own classification, you can save the ggPlantmap as a table and modify it on to mach the degree of separation you want to show.
The principle of creating a ggPlantmap is fairly simple. We generate a list of ROIs (region of interests) in the Icy open-source software (https://icy.bioimageanalysis.org/) from any image. These ROIs are saved as XML files and later be converted into ggPlantmaps by using the function XML.to.ggPlantmap() function. We created step-by-step tutorial on how to generate xml images from plant images, you can find the tutorial here.
##converting the sample file: ggPm.sample.xml into a ggPlantmap table
ggPm <- XML.to.ggPlantmap("data/ggPm.sample.xml")
head(ggPm)
#> # A tibble: 6 × 5
#>   ROI.name  ROI.id point     x     y
#>   <chr>      <int> <int> <dbl> <dbl>
#> 1 Epidermis      1     1  156. -333.
#> 2 Epidermis      1     2  167. -332.
#> 3 Epidermis      1     3  177. -340.
#> 4 Epidermis      1     4  176. -380.
#> 5 Epidermis      1     5  173. -384.
#> 6 Epidermis      1     6  165. -387.
##plotting the ggPm
ggPlantmap.plot(ggPm)Over the recent years, we are seeing a crescent interest on the characterization of molecular events that occur in specific cells/parts of the plant, such as single-cell sequencing approaches (ScRNA-seq,ScATAC-seq,TRAP-seq,LCM-RNAseq,etc) as well as high-resolution spatial profiling of RNAs in plant cells (PHYTOmap,In situ hybridization chain reaction (HCR), merFISH, Stereo-Seq,etc). These techniques offer powerful insights to understand cell-type specific events in a complex plant tissue. To better explore this type of data, it would be important to create tools that allow us to visualize and communicate the quantitative features of cells/parts the plant.
With ggPlantmap, we can overlay external quantitative data in the map as a form of a heatmap. You can combine the ggPlantmap with a external quantitative data using the ggPlantmap.merge() function. later, the heatmap can be generated using the ggPlantmap.heatmap() function.
This approach can be very helpful for R Shiny app developers to create web interactive tools to visualize gene expression gene profiles.
##Quantitative sample data, the expression of SCR in distinct cell-types of the Tomato root.
## Adapted data from: Kajala, Kaisa, et al. "Innovation, conservation, and repurposing of gene function in root cell type development." Cell 184.12 (2021): 3333-3348.
head(ggPm.tomatoatlas.expression.sample)
#> # A tibble: 6 × 2
#>   Cell.layer SCR.expression
#>   <chr>               <dbl>
#> 1 Epidermis            1.24
#> 2 Cortex               1.17
#> 3 Endodermis          75.8
#> 4 Phloem               0.44
#> 5 Procambium           0.95
#> 6 Pericycle            0.95
##important: Names in the quantitative data needs to match the ones found in the map.

##Merging both datasets
expression.sample2 <- ggPlantmap.merge(ggPm.Sl.root.crosssection,ggPm.tomatoatlas.expression.sample,id.x = "ROI.name",id.y="Cell.layer") ##Column names between tables are different, need to specify both identifiers in x and y.
head(expression.sample2)
#> # A tibble: 6 × 6
#>   ROI.name  ROI.id point     x     y SCR.expression
#>   <chr>      <int> <int> <dbl> <dbl>          <dbl>
#> 1 Exodermis      1     1  615. -370.             NA
#> 2 Exodermis      1     2  601. -349.             NA
#> 3 Exodermis      1     3  598. -327.             NA
#> 4 Exodermis      1     4  617. -312.             NA
#> 5 Exodermis      1     5  636. -307.             NA
#> 6 Exodermis      1     6  651. -310.             NA

##Ploting
ggPlantmap.heatmap(expression.sample2,SCR.expression) +
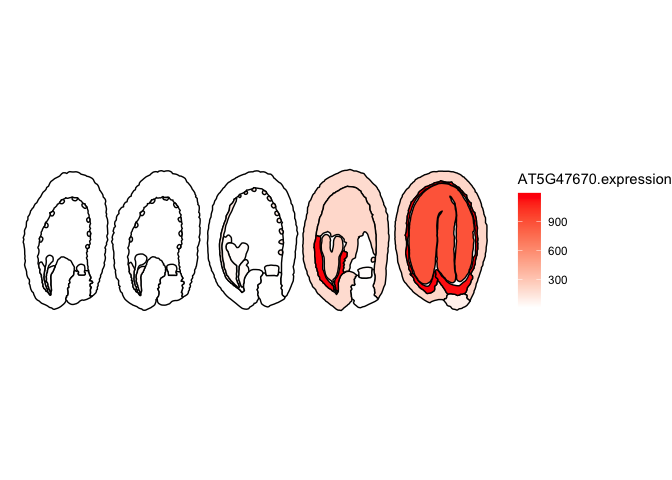
scale_fill_gradient(low="white",high="Red",na.value ="white")##Quantitative sample data, the expression of AT5G47670 (LEC1-like) in distinct stages and parts of the Arabidopsis seed
## Data from: Belmonte, Mark F., et al. "Comprehensive developmental profiles of gene activity in regions and subregions of the Arabidopsis seed." Proceedings of the National Academy of Sciences 110.5 (2013): E435-E444.
head(ggPm.At.seed.expression.sample)
#> # A tibble: 6 × 2
#> ROI.name AT5G47670.expression
#> <chr> <int>
#> 1 Globular.endosperm.Chalazal Endosperm 16
#> 2 Globular.seedcoat.Chalazal Seed Coat 8
#> 3 Globular.embryo.Embryo Proper 10
#> 4 Globular.endosperm.Micropylar Endosperm 48
#> 5 Globular.endosperm.Peripheral Endosperm 10
#> 6 Globular.seedcoat.Distal Seed Coat 10
##important: Names in the quantitative data needs to match the ones found in the map.
##Merging both datasets
expression.sample <- ggPlantmap.merge(ggPm.At.seed.devseries,ggPm.At.seed.expression.sample,"ROI.name")
head(expression.sample)
#> # A tibble: 6 × 9
#> ROI.name Stage Part Region ROI.id point x y AT5G4…¹
#> <chr> <chr> <chr> <chr> <int> <int> <dbl> <dbl> <int>
#> 1 Preglobular.seedcoat.Dist… Preg… seed… Dista… 1 1 277. -693. 8
#> 2 Preglobular.seedcoat.Dist… Preg… seed… Dista… 1 2 280. -689. 8
#> 3 Preglobular.seedcoat.Dist… Preg… seed… Dista… 1 3 280. -685. 8
#> 4 Preglobular.seedcoat.Dist… Preg… seed… Dista… 1 4 285. -681. 8
#> 5 Preglobular.seedcoat.Dist… Preg… seed… Dista… 1 5 286. -675. 8
#> 6 Preglobular.seedcoat.Dist… Preg… seed… Dista… 1 6 286. -669. 8
#> # … with abbreviated variable name ¹AT5G47670.expression
##Ploting
ggPlantmap.heatmap(expression.sample,AT5G47670.expression) +
scale_fill_gradient(low="white",high="Red")Not at all. ggPlantmap can also be used to produce many other type of plots. Essentially anything that you can trace, you can create! Be creative! We hope to build a community where people explore the usage of ggPlantmap for the communication of Plant science.
YES!!! Any Plant map can be included in the package. If you create one, please email me (l.jo@uu.nl) your ggPlantmap as tab-delimited table and I’ll make sure to include in the package. You will be credited and your information will be displayed in the summary file. I really hope this becomes an organic package with the contribution of the plant research community.
Soon


