Simulation protocol: Lysozyme in Water by J. Lemkul and Making it Rain by P. Arantes
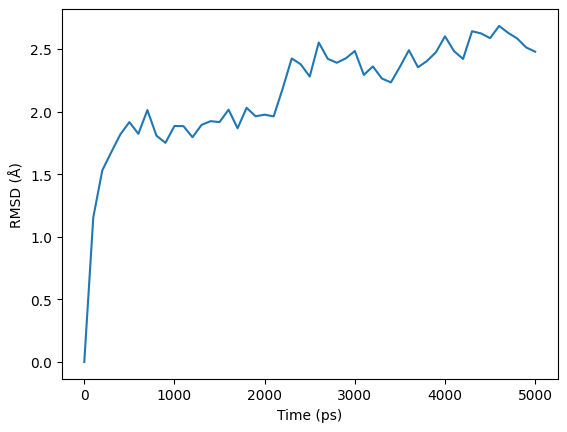
RMSD (Root Mean Square Deviation) plot displays the deviation of the protein's atomic positions from a reference structure over the course of the simulation. It shows the RMSD values as a function of simulation time. This plot is crucial in assessing the stability and conformational changes of the protein throughout the simulation.
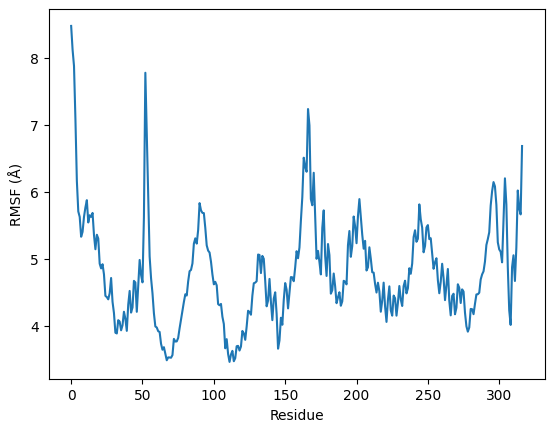
RMSF (Root Mean Square Fluctuation) plot provides insights into the local atomic fluctuations of the protein backbone or specific residues. Specifically, it focuses on the RMSF values of the protein's Cα atoms as a function of residue number. By analyzing this plot, researchers can identify flexible regions and areas that undergo significant fluctuations during the simulation.
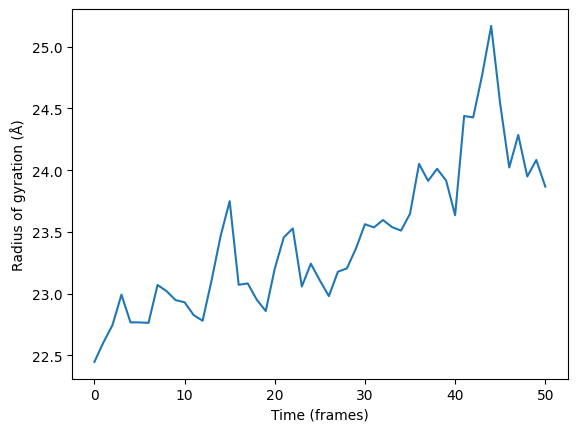
RG (Radius of Gyration) plot offers information about the protein's compactness or size throughout the simulation. It presents the RG values as a function of simulation time. This plot allows researchers to gain insights into the overall structural stability and folding/unfolding behavior of the protein.
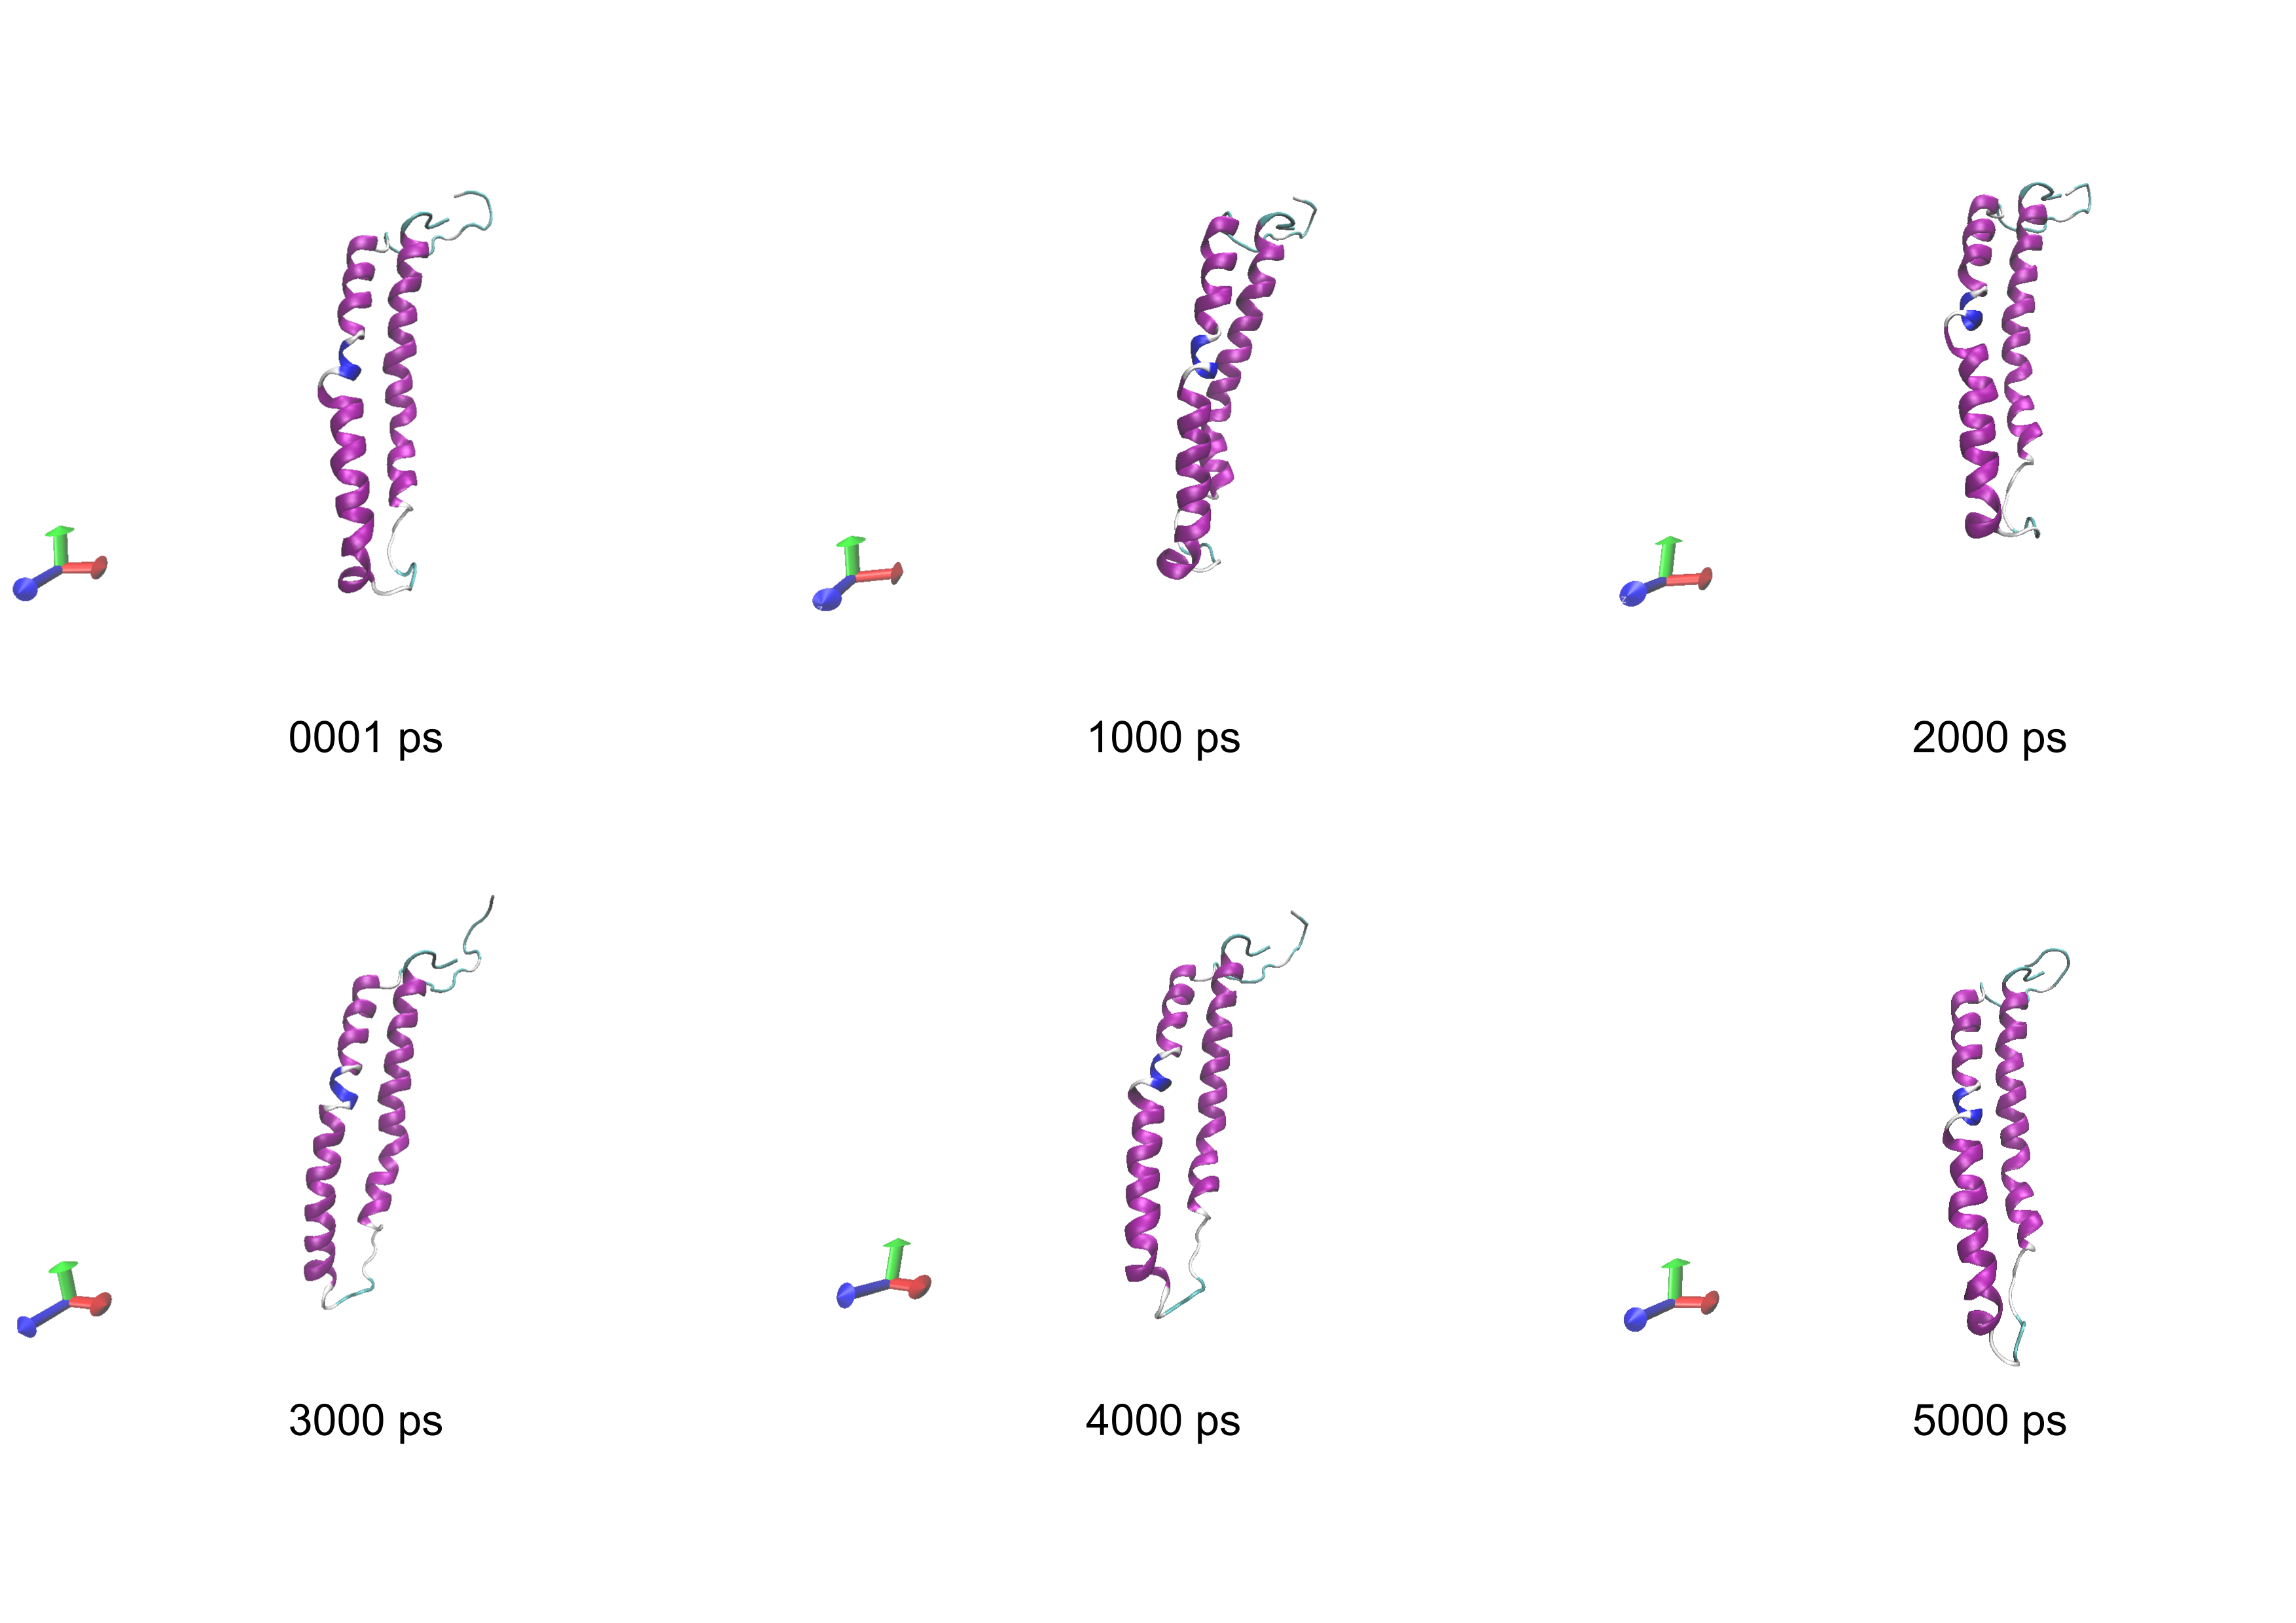
The STRUCTURAL SNAPSHOTS includes visual representations of the protein's conformation at different time points during the simulation. These snapshots typically depict the protein structure, water molecules, and other relevant components. They are valuable for observing changes in secondary structure, interactions, and solvent exposure, providing a visual understanding of the protein's behavior throughout the simulation.
The CONFORMATIONAL SNAPSHOTS showcases an animated GIF or video representing the protein's motion and dynamics over the simulation time. The trajectory allows researchers to visualize the protein's structural changes, movements, and interactions with water molecules dynamically. It provides valuable insights into the protein's folding, unfolding, and overall behavior throughout the MD simulation.
RMSD Average linkage hierarchical clustering: Average linkage hierarchical clustering of Root Mean Square Deviation (RMSD)
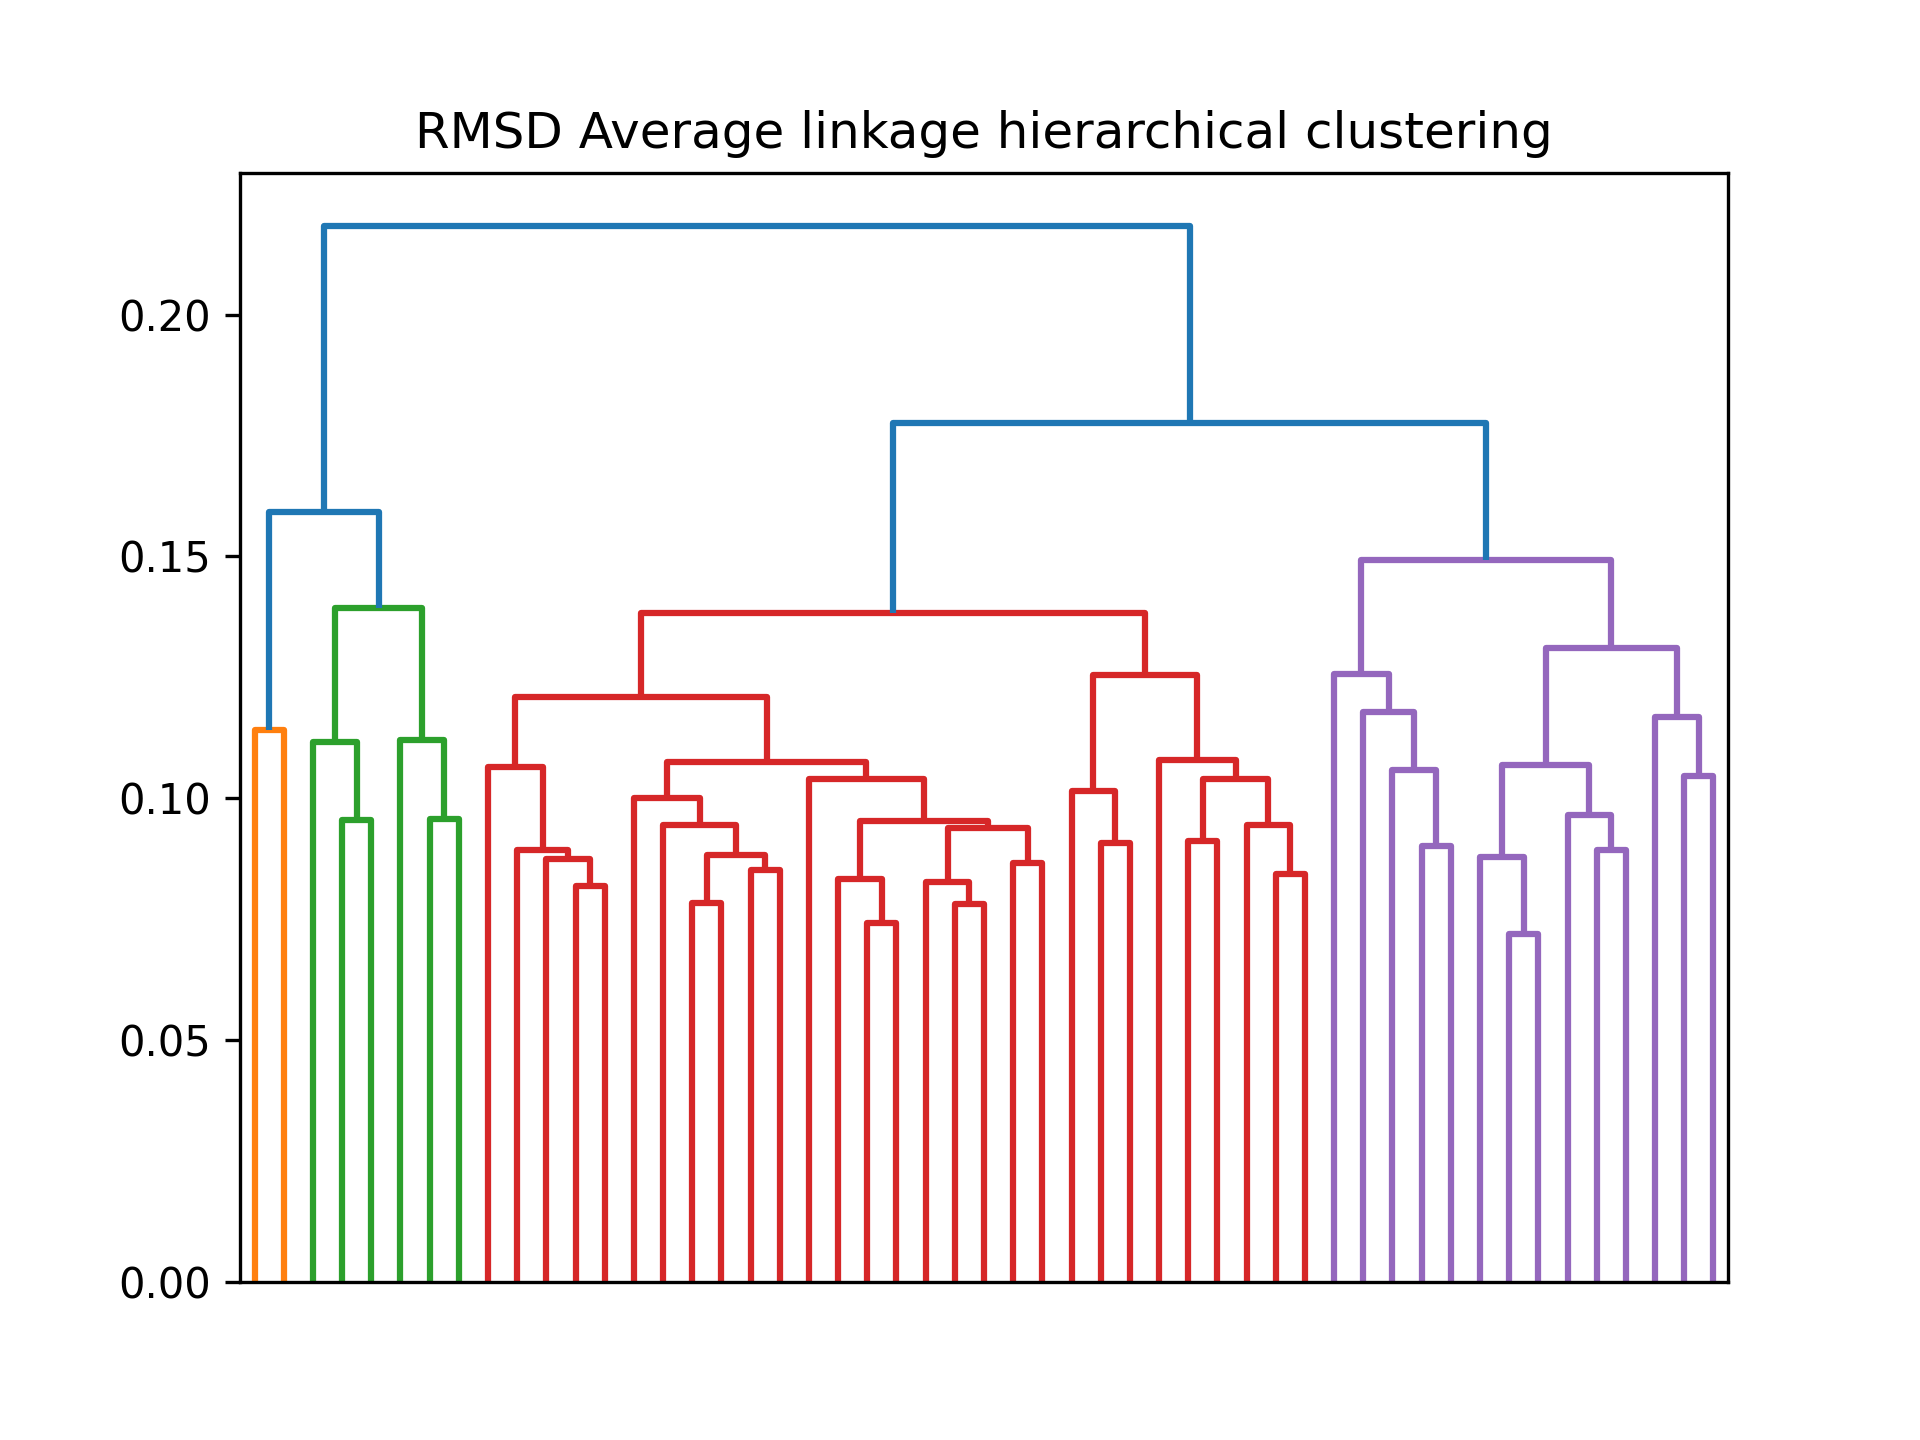
This dendrogram represents the results of average linkage hierarchical clustering based on the Root Mean Square Deviation (RMSD) values calculated from the protein structure's different conformations. Hierarchical clustering groups similar conformations together based on their structural similarity, creating a dendrogram that illustrates the hierarchical relationships and clusters of conformations. This analysis can help identify distinct conformational states or major structural transitions in the system, aiding in the characterization of its dynamic behavior.
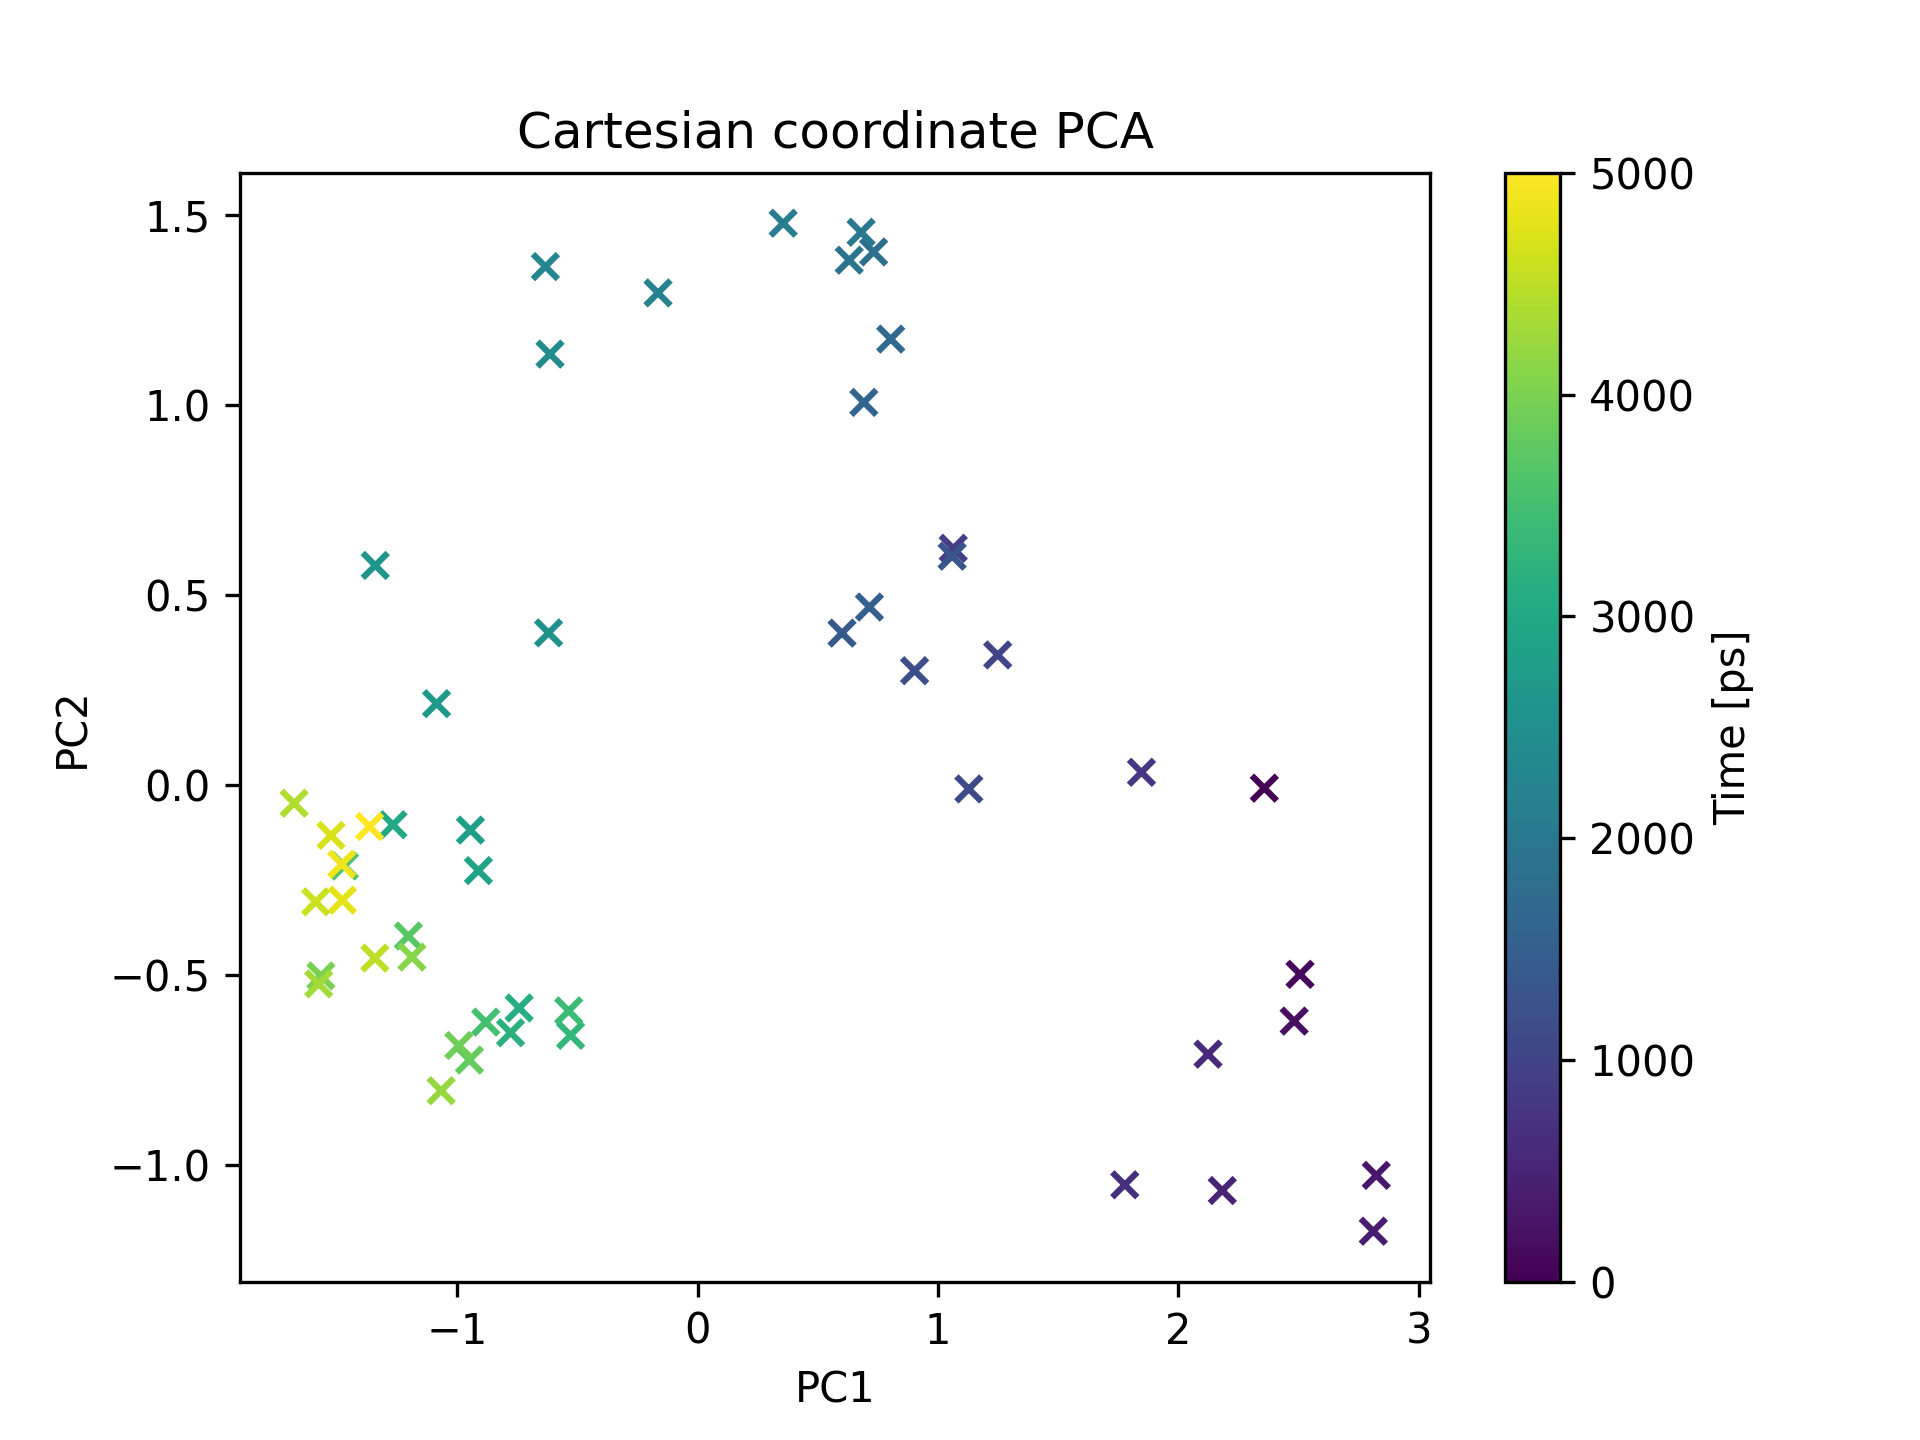
This scatter plot shows the results of Principal Component Analysis (PCA) performed on the Cartesian coordinates of the system. PCA is a dimensionality reduction technique that identifies the major sources of variation in the dataset. By projecting the data onto a lower-dimensional space, it reveals the dominant modes of motion and structural variability in the system. This plot visualizes the distribution of the data points in the reduced-dimensional space, providing insights into the relationships and clusters among different conformations or states of the system.
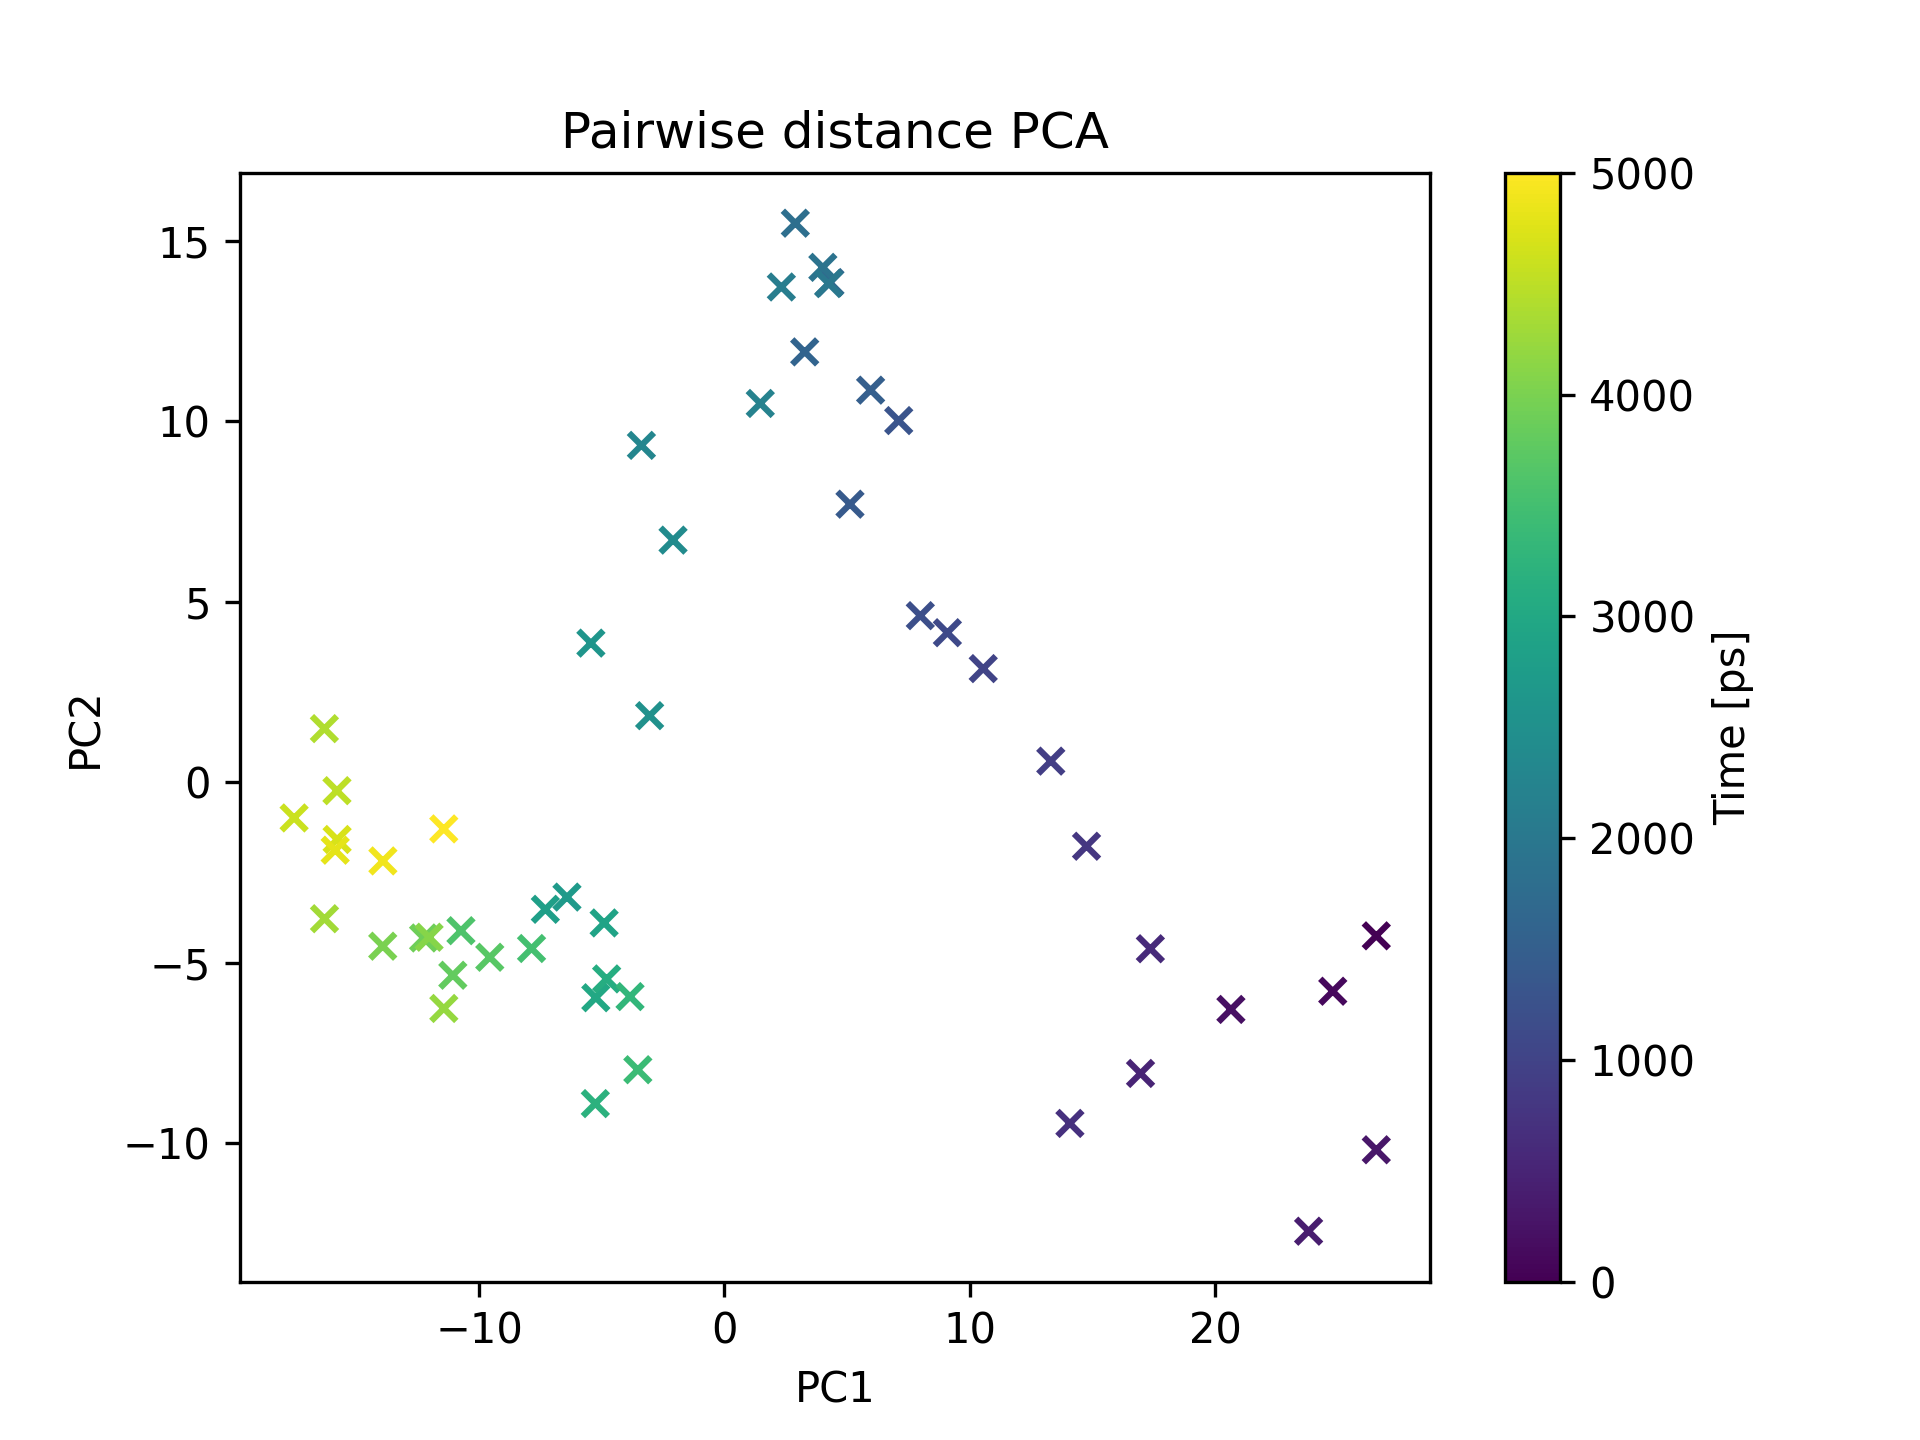
This scatter plot illustrates the results of Principal Component Analysis (PCA) conducted on pairwise distances between system components. By calculating the distances between pairs of atoms or residues, a pairwise distance matrix is constructed. PCA is then applied to this matrix to identify the dominant modes of motion and collective behavior of the system. The resulting plot reveals the clustering patterns and relationships between the data points in the reduced-dimensional space, shedding light on the conformational changes, domain motions, or other significant motions occurring during the simulation.
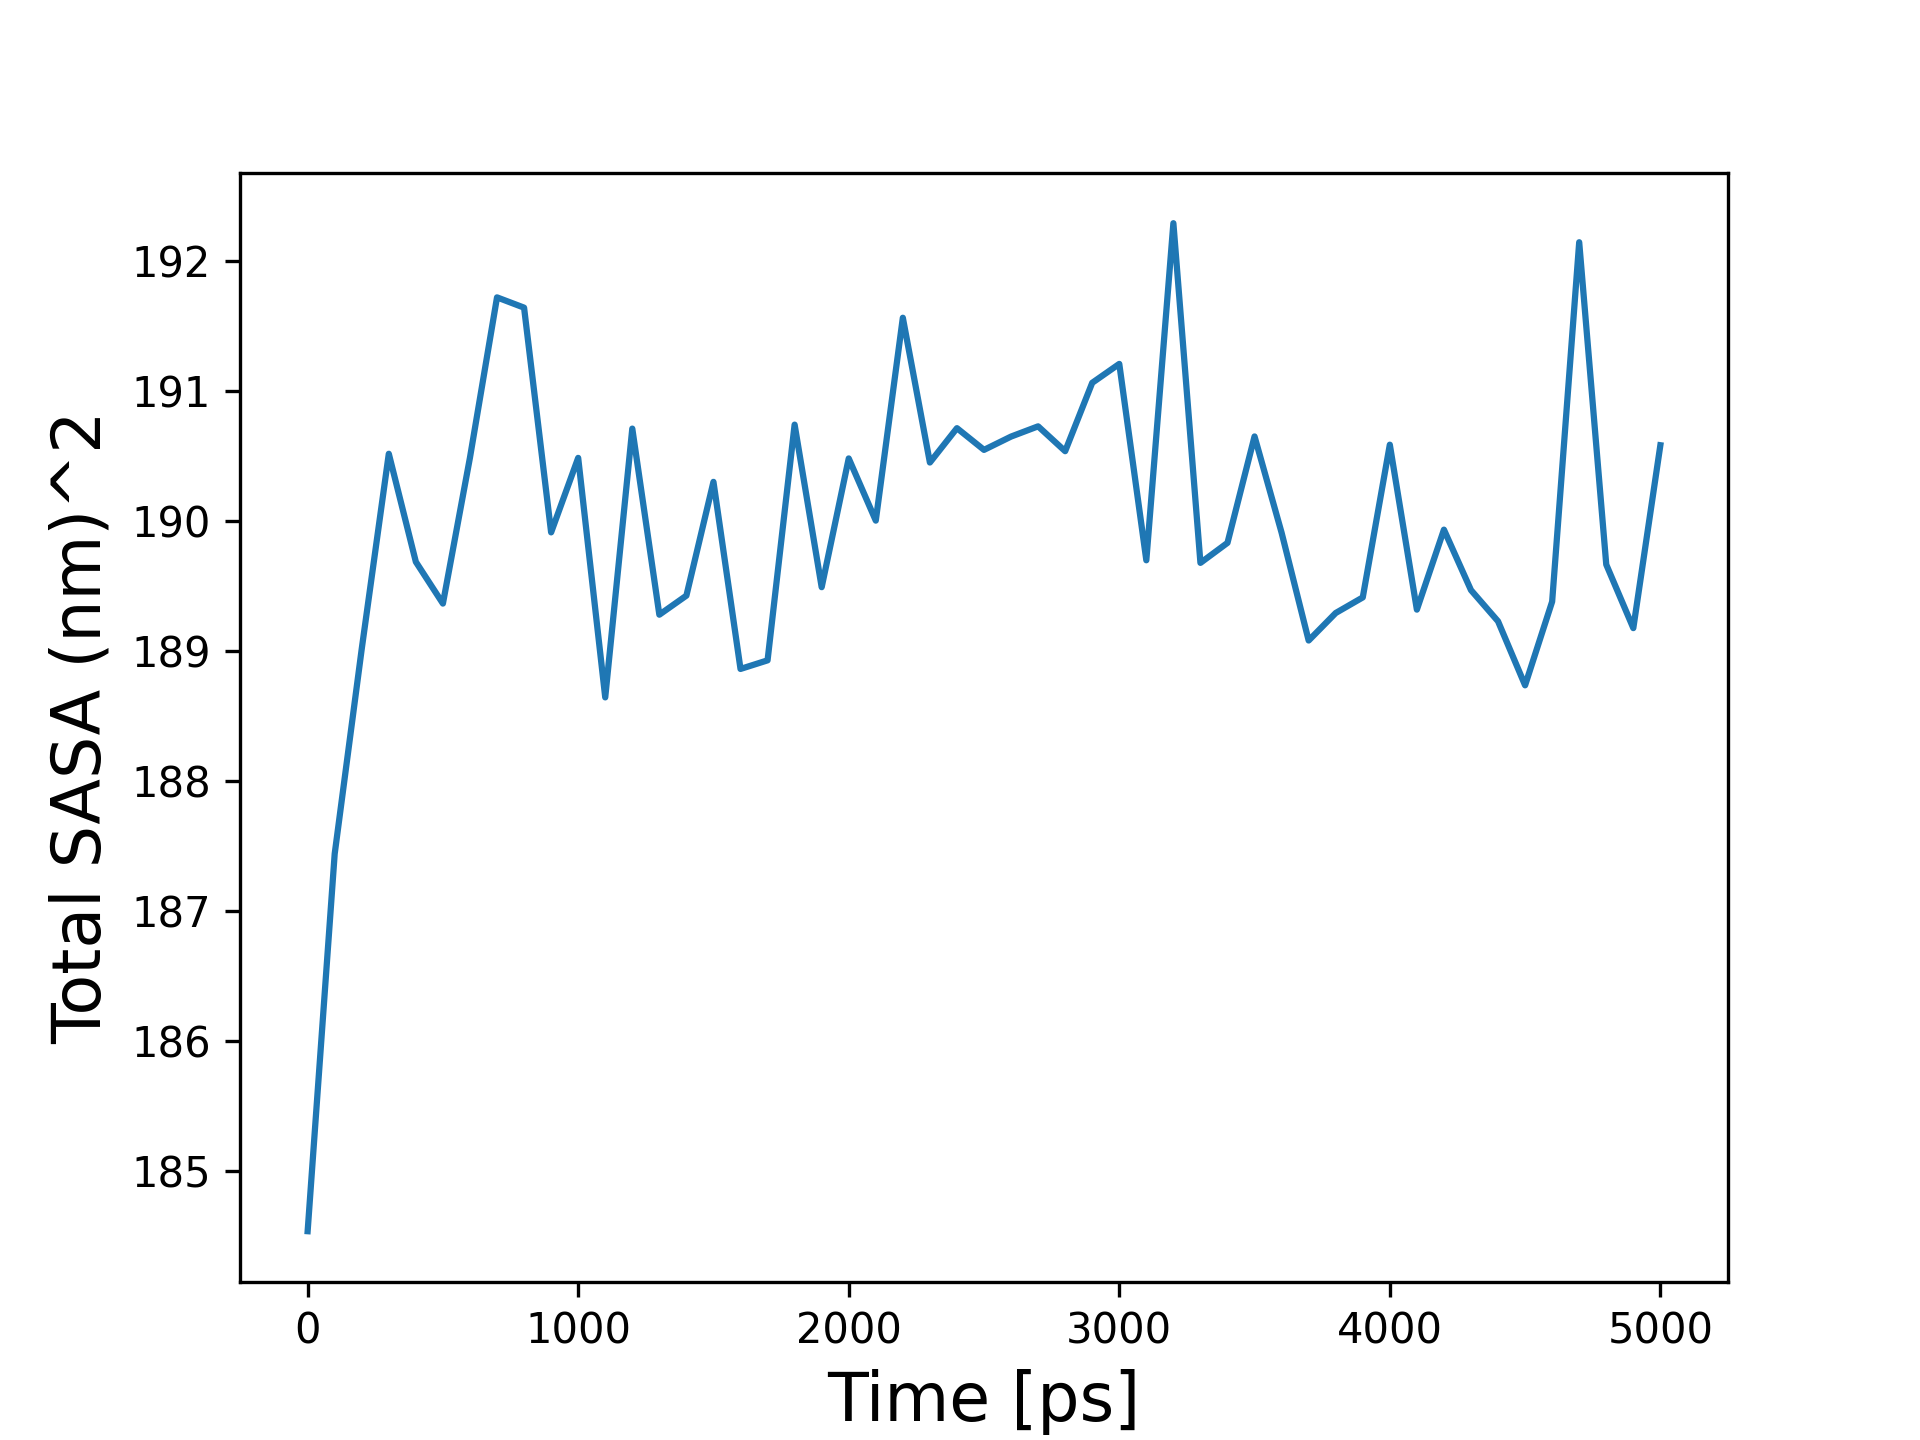
- Figure Caption: This bar plot displays the total Solvent-Accessible Surface Area (SASA) of the system. SASA quantifies the accessible surface area of a biomolecule to solvent molecules. It provides insights into the overall solvent exposure and accessibility of the protein surface, indicating the extent of interactions between the protein and its surrounding environment. Monitoring changes in SASA throughout the simulation can reveal dynamic events such as protein unfolding, binding to other molecules, or conformational changes that affect the protein's surface accessibility.
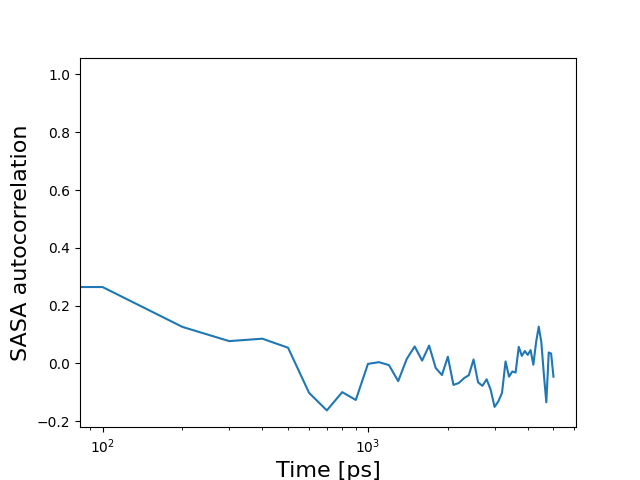
This line plot displays the autocorrelation of the Solvent-Accessible Surface Area (SASA) over time. Autocorrelation analysis measures the correlation between a variable (in this case, the SASA) at different time points in a time series. The plot reveals the temporal correlations in the exposure of the protein surface to the surrounding solvent. It provides insights into the timescale of solvent rearrangements and solvent-protein interactions. Autocorrelation analysis helps identify patterns or periodicities in the protein's solvation dynamics and the persistence of solvent effects on the protein's surface properties.