Background:
In this problem, we are given a list of users along with their demographics and their web session data. We will be predicting which country a new user's first booking destination will be. All the users in this dataset are from the USA.
There are 12 possible outcomes of the destination country: 'US', 'FR', 'CA', 'GB', 'ES', 'IT', 'PT', 'NL','DE', 'AU', 'NDF' (no destination found), and 'other'. Please note that 'NDF' is different from 'other' because 'other' means there was a booking, but is to a country not included in the list, while 'NDF' means there wasn't a booking.
Approach :
Libraries Used: "gains","e1071","xgboost","tidyverse","ggplot2","mltools","data.table","nnet","caret","FNN","gmodels","MASS","randomForest","DiscriMiner"
Data Visualization:
Tools used: Tableau,ggplot2
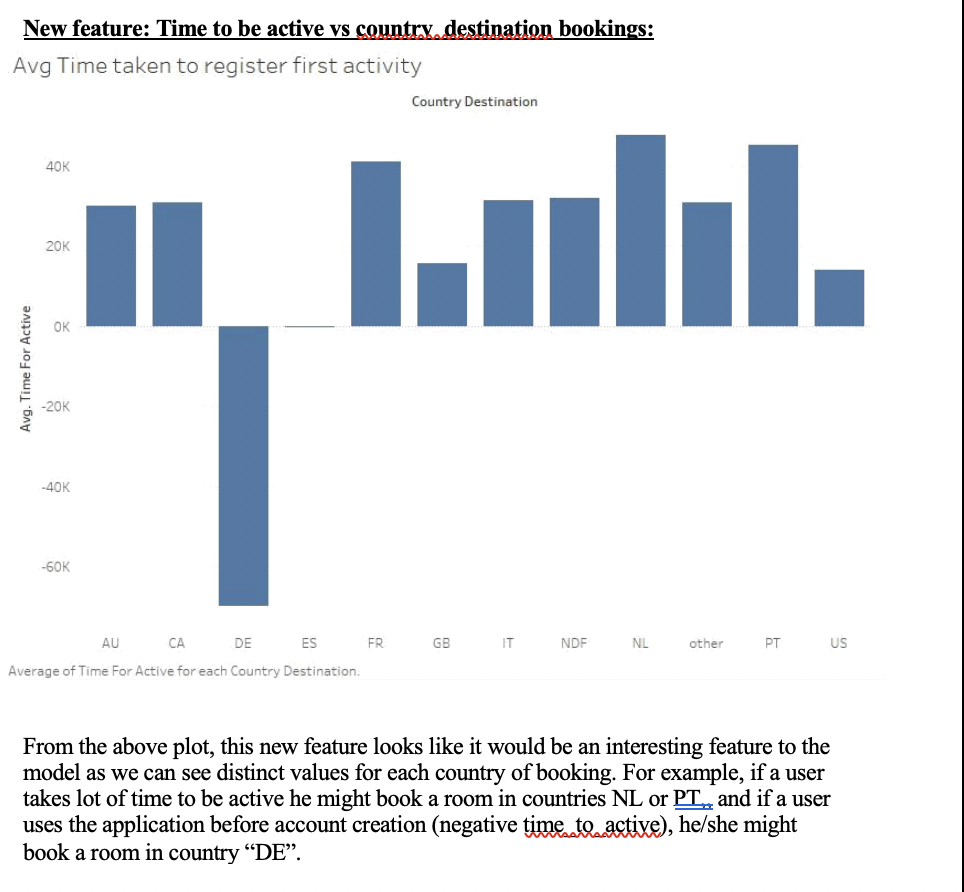
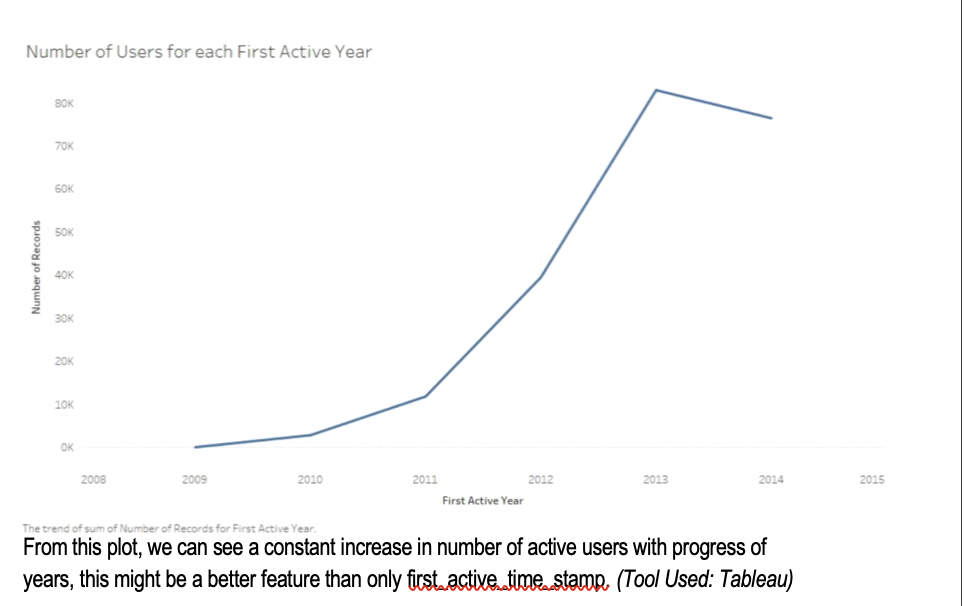
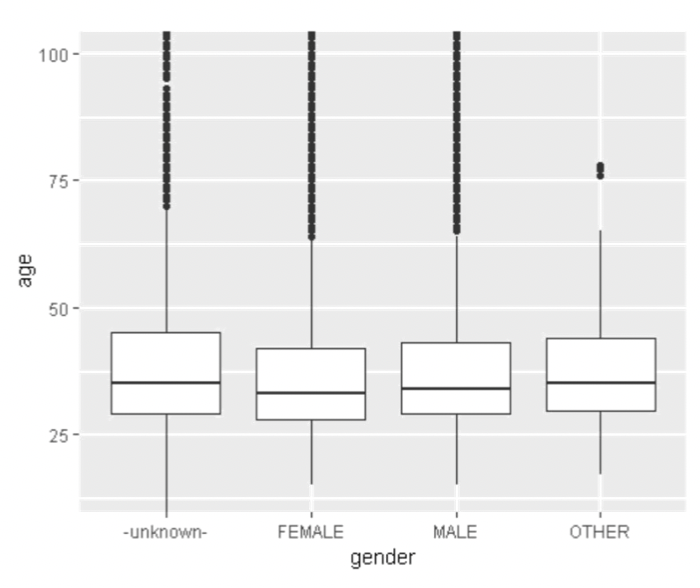
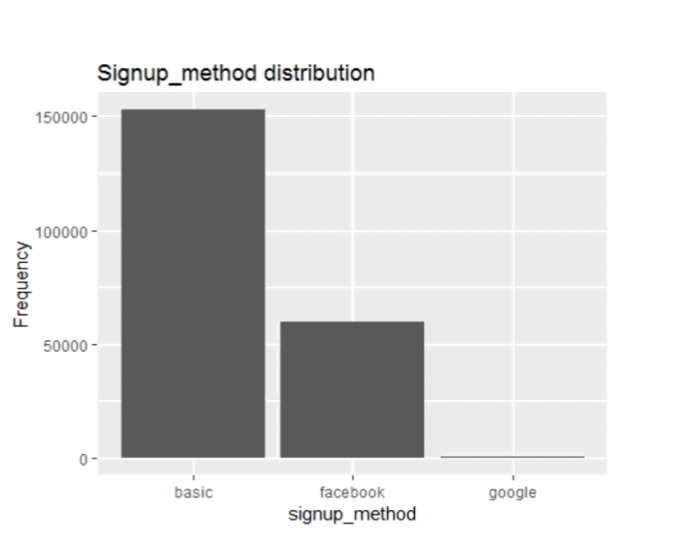
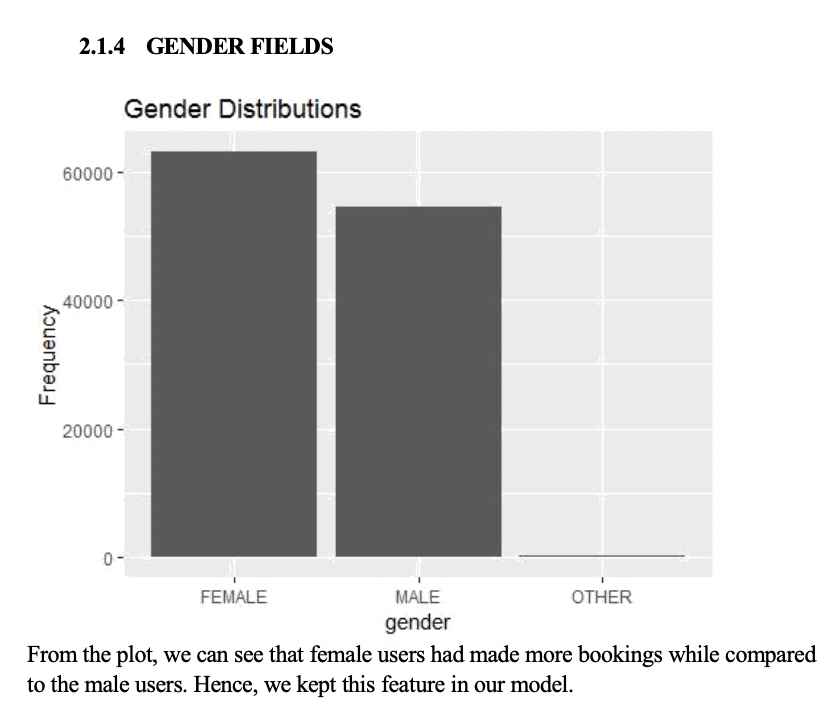
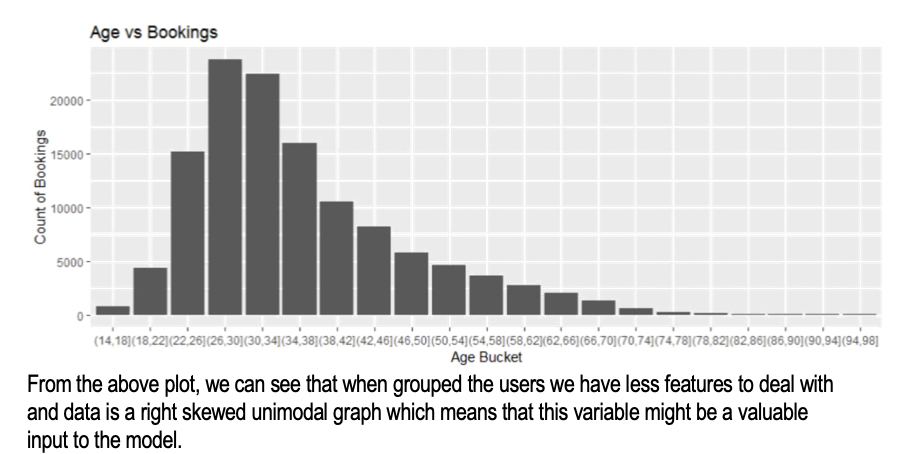
Following are some of the plots that helped selecting features:
Data Cleaning:
Tools used: dplyr, lubridate
- Removed fields first_active_time, and data_account_created and created new feature time_for_active
- Modified Age column into Age_Bucket columns by adding age into buckets of 5 years based on plots.
Algorithms:
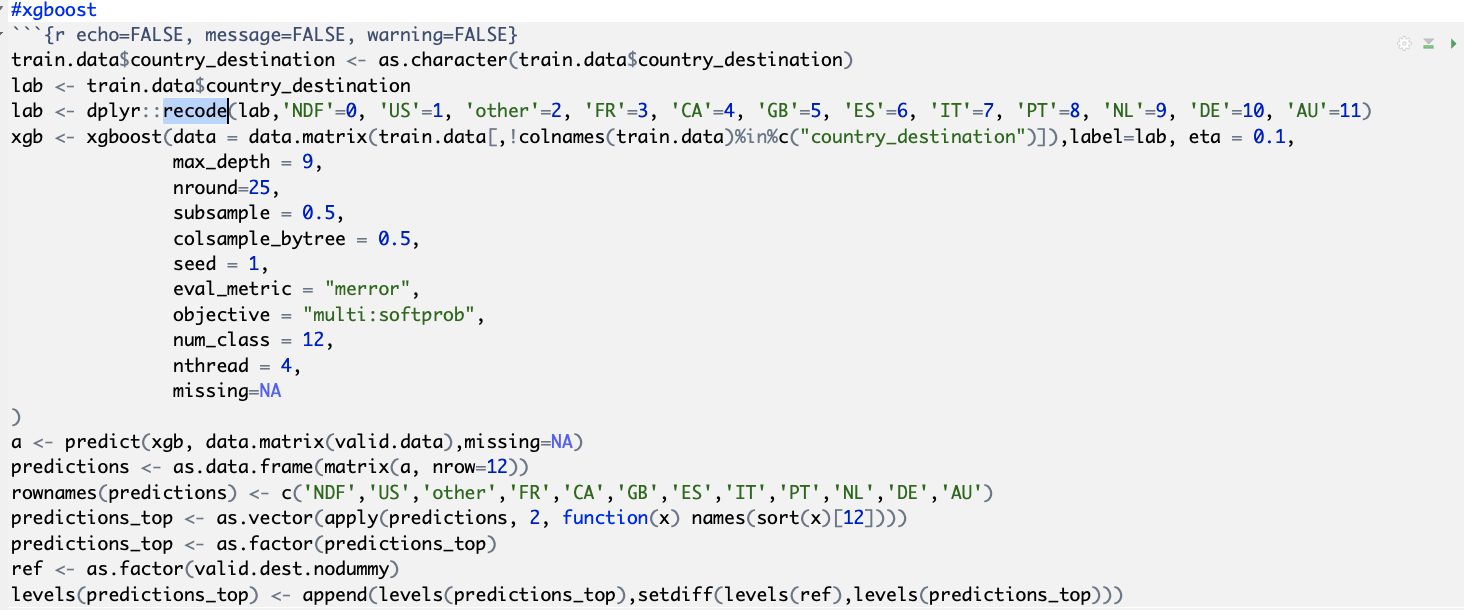
XGBOOST ALGORITHM
library used: xgboost
The algorithm we choose to use was created by Tianqi Chen from University of Washington and is an implementation of gradient boosted decision trees. A standard decision tree algorithm will create one tree based on all features to try and predict the outcome, it achieves this by continuously splitting the data into 2 or more groups and leading those groups into more splits on each branch, for example it might split gender into male, female or unknown as the first node in the tree each decision will branch out to new decision nodes or a leaf node which is the final destination for the users in this case, which leaf they end up in will tell the classifier which destination they are most likely going to choose. Downside of normal decision trees is the size required to explain the data fully when for example every gender needs its own decision node describing its age to fully be able to profile the users. A boosted tree uses the same concept of a tree with decision nodes and final leaf nodes, but the difference is the size, a boosted tree uses smaller trees that only explain a fraction of the features in each tree. Several of these trees are then created and every leaf node contains a score, the score from all sub trees are summed up to achieve the final score. The gradient part of the algorithm comes from the creation of every new tree, when the algorithm creates a new tree it analyses the previous trees and creates a new tree that attempts to fix errors in the previous ones. Datasets today become larger and larger which pose a problem for the existing hardware where for instance the memory is very limited which requires good memory handling from the machine learning algorithms to not suffer too much from common out of memory issues. XGBoost uses several different techniques to tackle these problems, most notably Cache aware access and out-of-block computation, cache aware access means that the algorithm plans ahead to actively reduce the amount of cache misses when new data needs to be constantly fetched from memory and out -of-block computation enables the computer to store parts of the data on disk instead of keeping everything in the main memory, this is supported by efficient use of threads for preloading compressed data from the disk that it partly decompresses when needed. XGBoost automatically makes use of all available cores for computing (Chen & Guestrin, 2016). We were committed to using boosted-tree based methods for a few reasons:
• Boosted Trees can outperform Random Forests once they plateau.
• Tree-based methods can handle missingness very well.
• Tree-based methods can handle both categorical and continuous variables.
Logistic Regression
Logistic Regression:
Logistic regression extends the ideas of linear regression to the situation where the outcome variable is categorical. We can think of a categorical variable as dividing the records into classes. In our example, we are predicting country destination and hence we can classify 11 countries into 11 classes. But for the purpose of performance evaluation, we have considered major classes whether the user will make a booking or not.
function used: glm
Evaluation:
libraries used: gains,
Multiclass classification:
As we can see XGBoost achieves overall 80% accuracy and high sensitivities for "US" and "NDF".Although this itself is good prediction, we can use resampling methods like SMOTE oversampling or undersampling to see if there will be a better performance in predicting other country destinations.
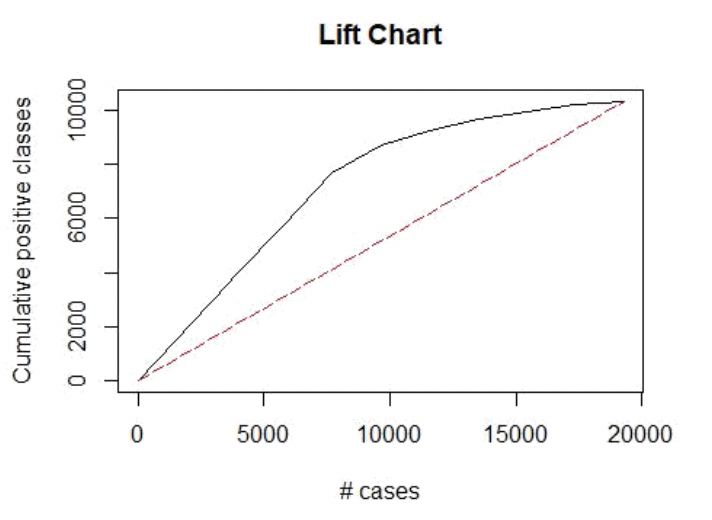
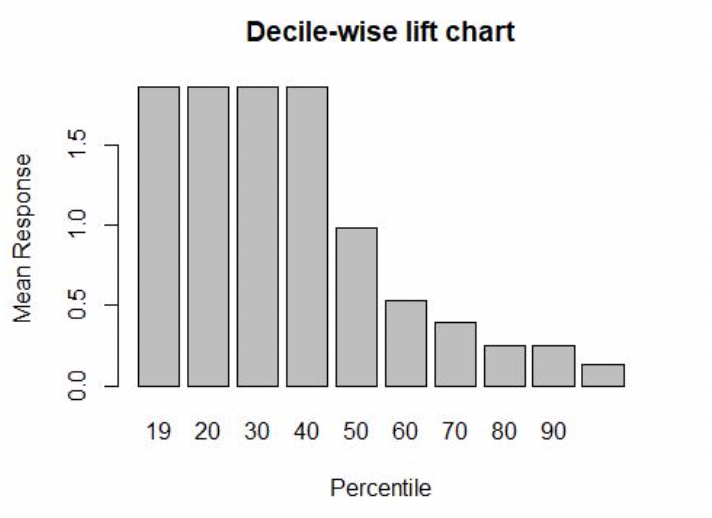
User Booking Turnout Evaluation
The logistic regression algorithm does well in predicting user booking with accuracy of 88% which is pretty high!
Conclusion
• Seasonality in Bookings, we have seen a huge growth in bookings in the month of June which seems to be the booking season for customers.
• Some of the features in the datasets can be added by improving the features like adding the “difference between the date of first booking and date first active”.
• Users are tending to book after few months from the date of account created so we can use the same time to collect the user’s demographic data so that we can have a better prediction about the user’s next destination.
• We have seen lot of users are not mentioning their gender which can be collected for better predictions as we have seen a correlation between gender and country destination booking. • Age outliers state that there are users who are mentioning wrong age, so we can collect their proper personal data if we can make them to open their account using their Gmail-ids or Facebook-ids.
• From the signup distribution chart, we can see more users are using basic signup which might be leading to multiple user accounts in the same location thus misleading the data models.
• Looking at age and gender in combination, we can see that the missingness in age overlaps to some extent with the missingness in gender.
• We have seen huge chunks of data specifically for NDS and US which is comparatively huge that it can mislead the information provided for other countries.
