This gem adds an analyze method to Active Record query objects. It executes EXPLAIN ANALYZE on a query SQL.
You can check out this blog post for more info on how to debug and fix slow queries in Rails apps.
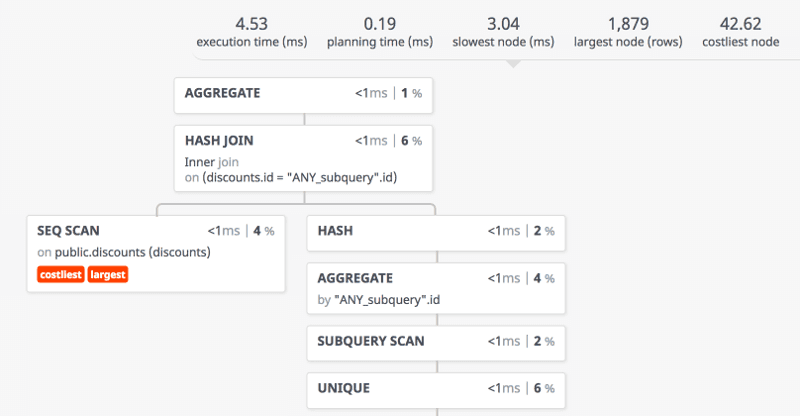
The following format options are supported :json, :hash, :yaml, :text, :xml. Especially the :json format is useful because it let's you visualize a query plan using a visualizer tool.
In your Gemfile:
gem 'activerecord-analyze'The analyze method supports the following EXPLAIN query options (PostgreSQL docs reference):
buffers: [ boolean ]
verbose: [ boolean ]
costs: [ boolean ]
settings: [ boolean ]
timing: [ boolean ]
summary: [ boolean ]
format: { :text | :json | :xml | :yaml | :pretty_json }
You can execute it like that:
puts User.all.analyze(
  format: :pretty_json, # :pretty_json format option generates a formatted JSON output
  verbose: true,
  costs: true,
  settings: true,
  buffers: true,
  timing: true,
  summary: true
)

# EXPLAIN (FORMAT JSON, ANALYZE, VERBOSE, COSTS, SETTINGS, BUFFERS, TIMING, SUMMARY)
# SELECT "users".* FROM "users"
# [
#   {
#     "Plan": {
#       "Node Type": "Seq Scan",
#       "Parallel Aware": false,
#       "Relation Name": "users",
#       "Schema": "public",
#       "Alias": "users",
#       "Startup Cost": 0.00,
#       "Total Cost": 11.56,
#       "Plan Rows": 520,
#       "Plan Width": 127,
#       "Actual Startup Time": 0.006,
#       "Actual Total Time": 0.007,
#       "Actual Rows": 2,
#       "Actual Loops": 1,
#       "Output": ["id", "team_id", "email"],
#       "Shared Hit Blocks": 1,
#       "Shared Read Blocks": 0,
#       "Shared Dirtied Blocks": 0,
#       "Shared Written Blocks": 0,
#       "Local Hit Blocks": 0,
#       "Local Read Blocks": 0,
#       "Local Dirtied Blocks": 0,
#       "Local Written Blocks": 0,
#       "Temp Read Blocks": 0,
#       "Temp Written Blocks": 0,
#       "I/O Read Time": 0.000,
#       "I/O Write Time": 0.000
#     },
#     "Settings": {
#       "cpu_index_tuple_cost": "0.001",
#       "cpu_operator_cost": "0.0005",
#       "cpu_tuple_cost": "0.003",
#       "effective_cache_size": "10800000kB",
#       "max_parallel_workers_per_gather": "1",
#       "random_page_cost": "2",
#       "work_mem": "100MB"
#     },
#     "Planning Time": 0.033,
#     "Triggers": [
#     ],
#     "Execution Time": 0.018
#   }
# ]
Optionally you can disable running the ANALYZE query and only generate the plan:
User.all.analyze(analyze: false)

# EXPLAIN ANALYZE for: SELECT "users".* FROM "users"
#                         QUERY PLAN
# ----------------------------------------------------------
# Seq Scan on users (cost=0.00..15.20 rows=520 width=127)You can also use a raw SQL query string to generate an EXPLAIN ANALYZE output:
query = "SELECT * FROM users WHERE email = 'email@example.com'"

puts ActiveRecordAnalyze.analyze_sql(query, { format: :json })

# [
# {
#    "Plan": {
#      "Node Type": "Seq Scan",
#      "Parallel Aware": false,
#      "Relation Name": "users",
#      "Alias": "users",
#      "Startup Cost": 0.00,
#      "Total Cost": 18.75,
#      "Plan Rows": 4,
#      "Plan Width": 88,
#      "Actual Startup Time": 0.010,
#      "Actual Total Time": 0.018,
#      "Actual Rows": 0,
#      "Actual Loops": 1,
#      "Filter": "((email)::text = 'email@example.com'::text)",
#      "Rows Removed by Filter": 0
#    },
#    "Planning Time": 0.052,
#    "Triggers": [
#    ],
#    "Execution Time": 0.062
# }
# ]
This feature is helpful in analyzing SQL queries extracted from the logs.
It is a bit experimental and can break with new Rails release.