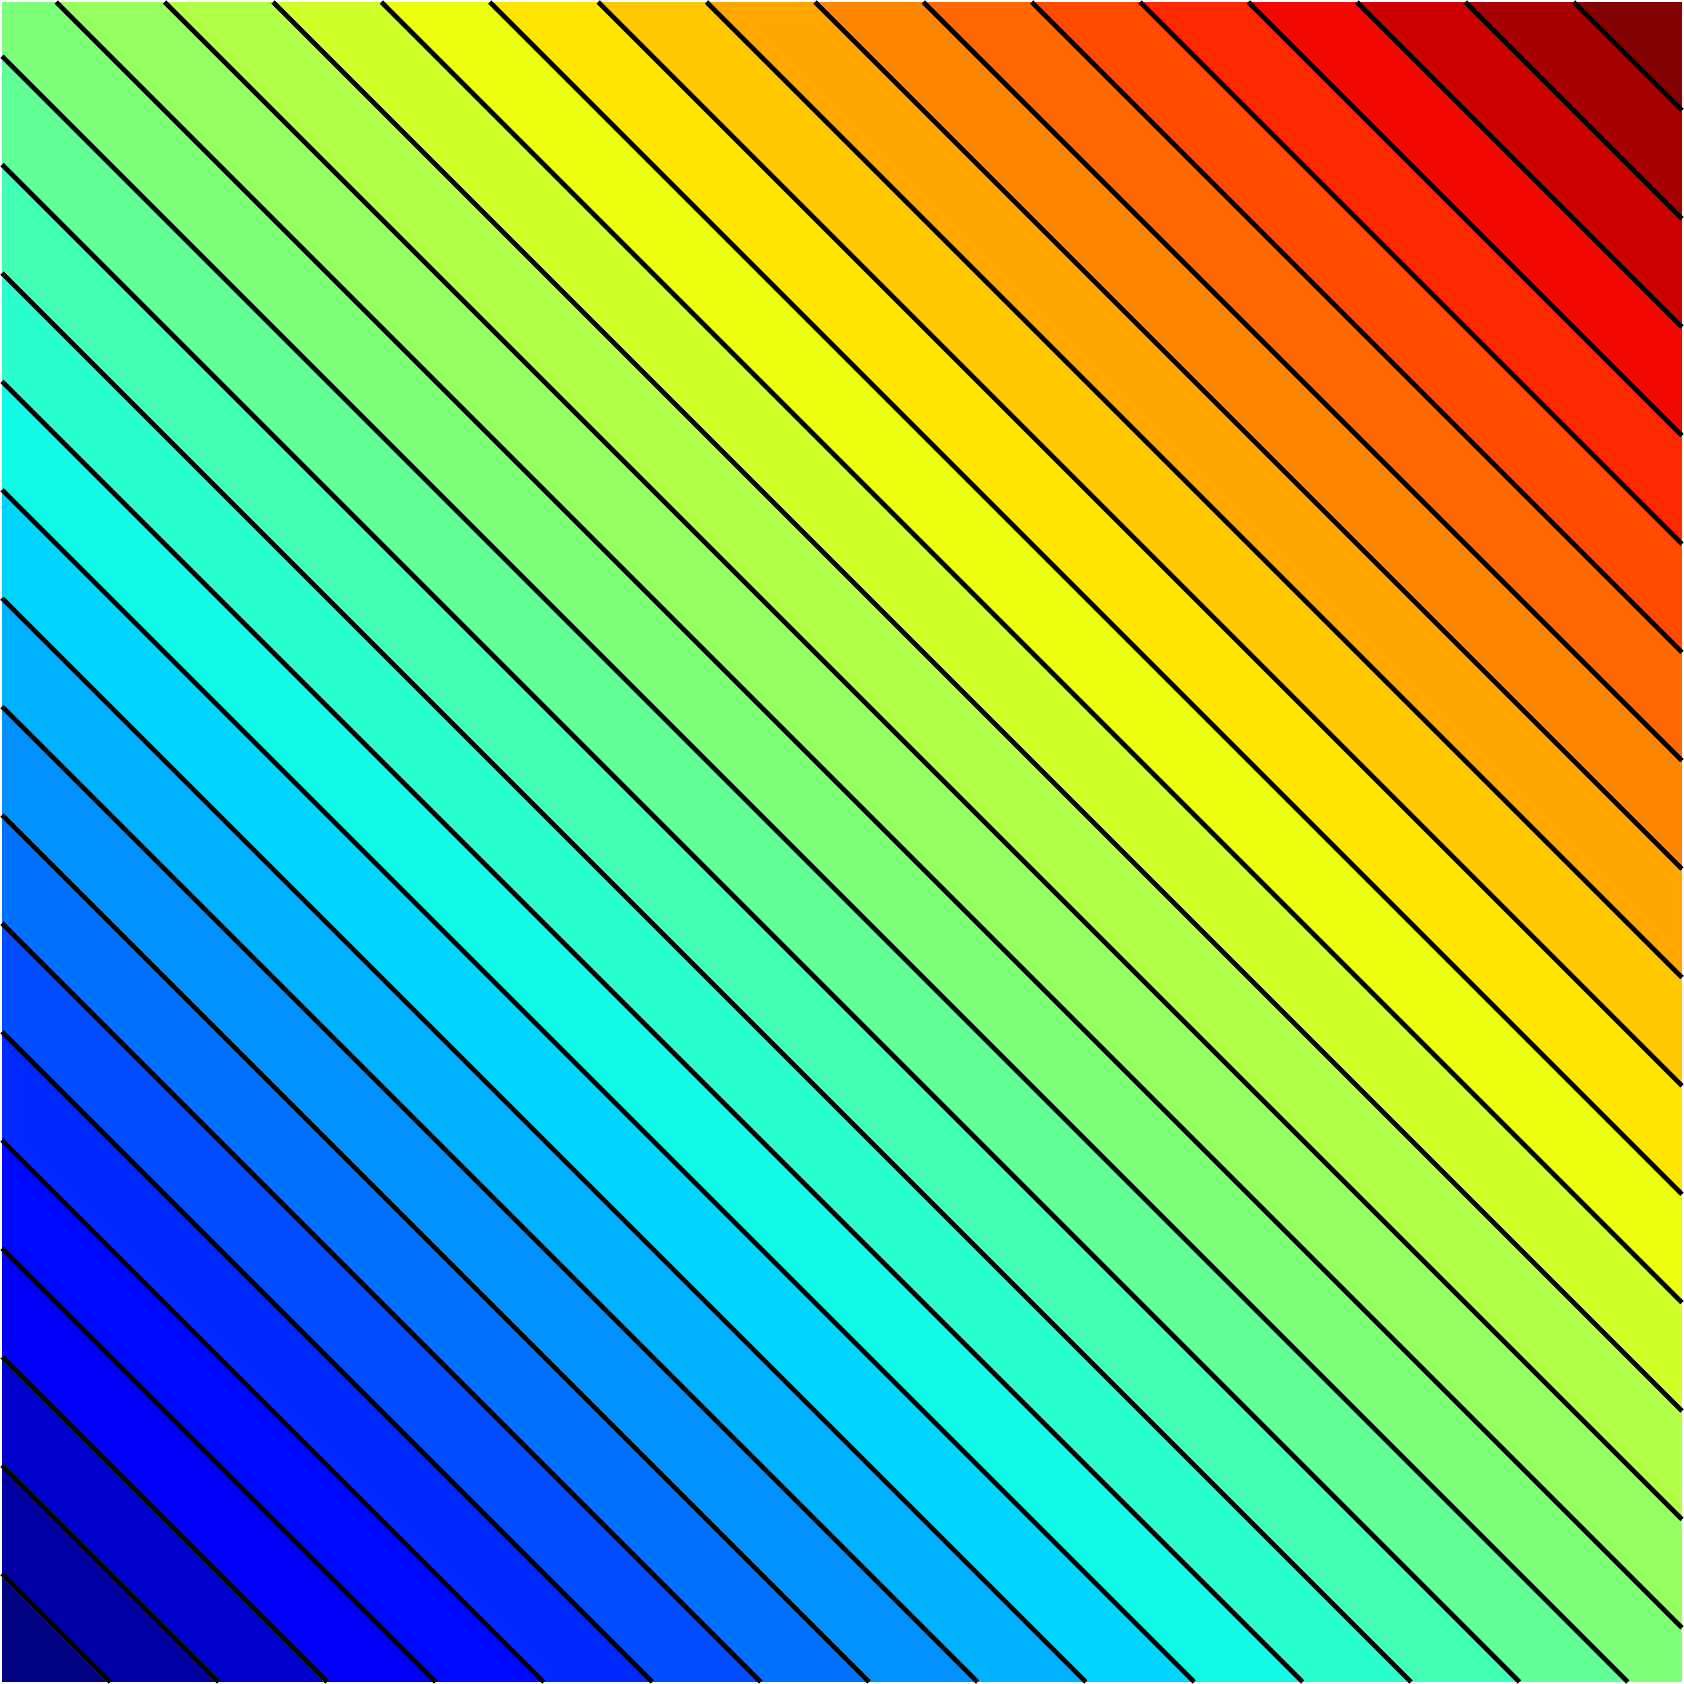
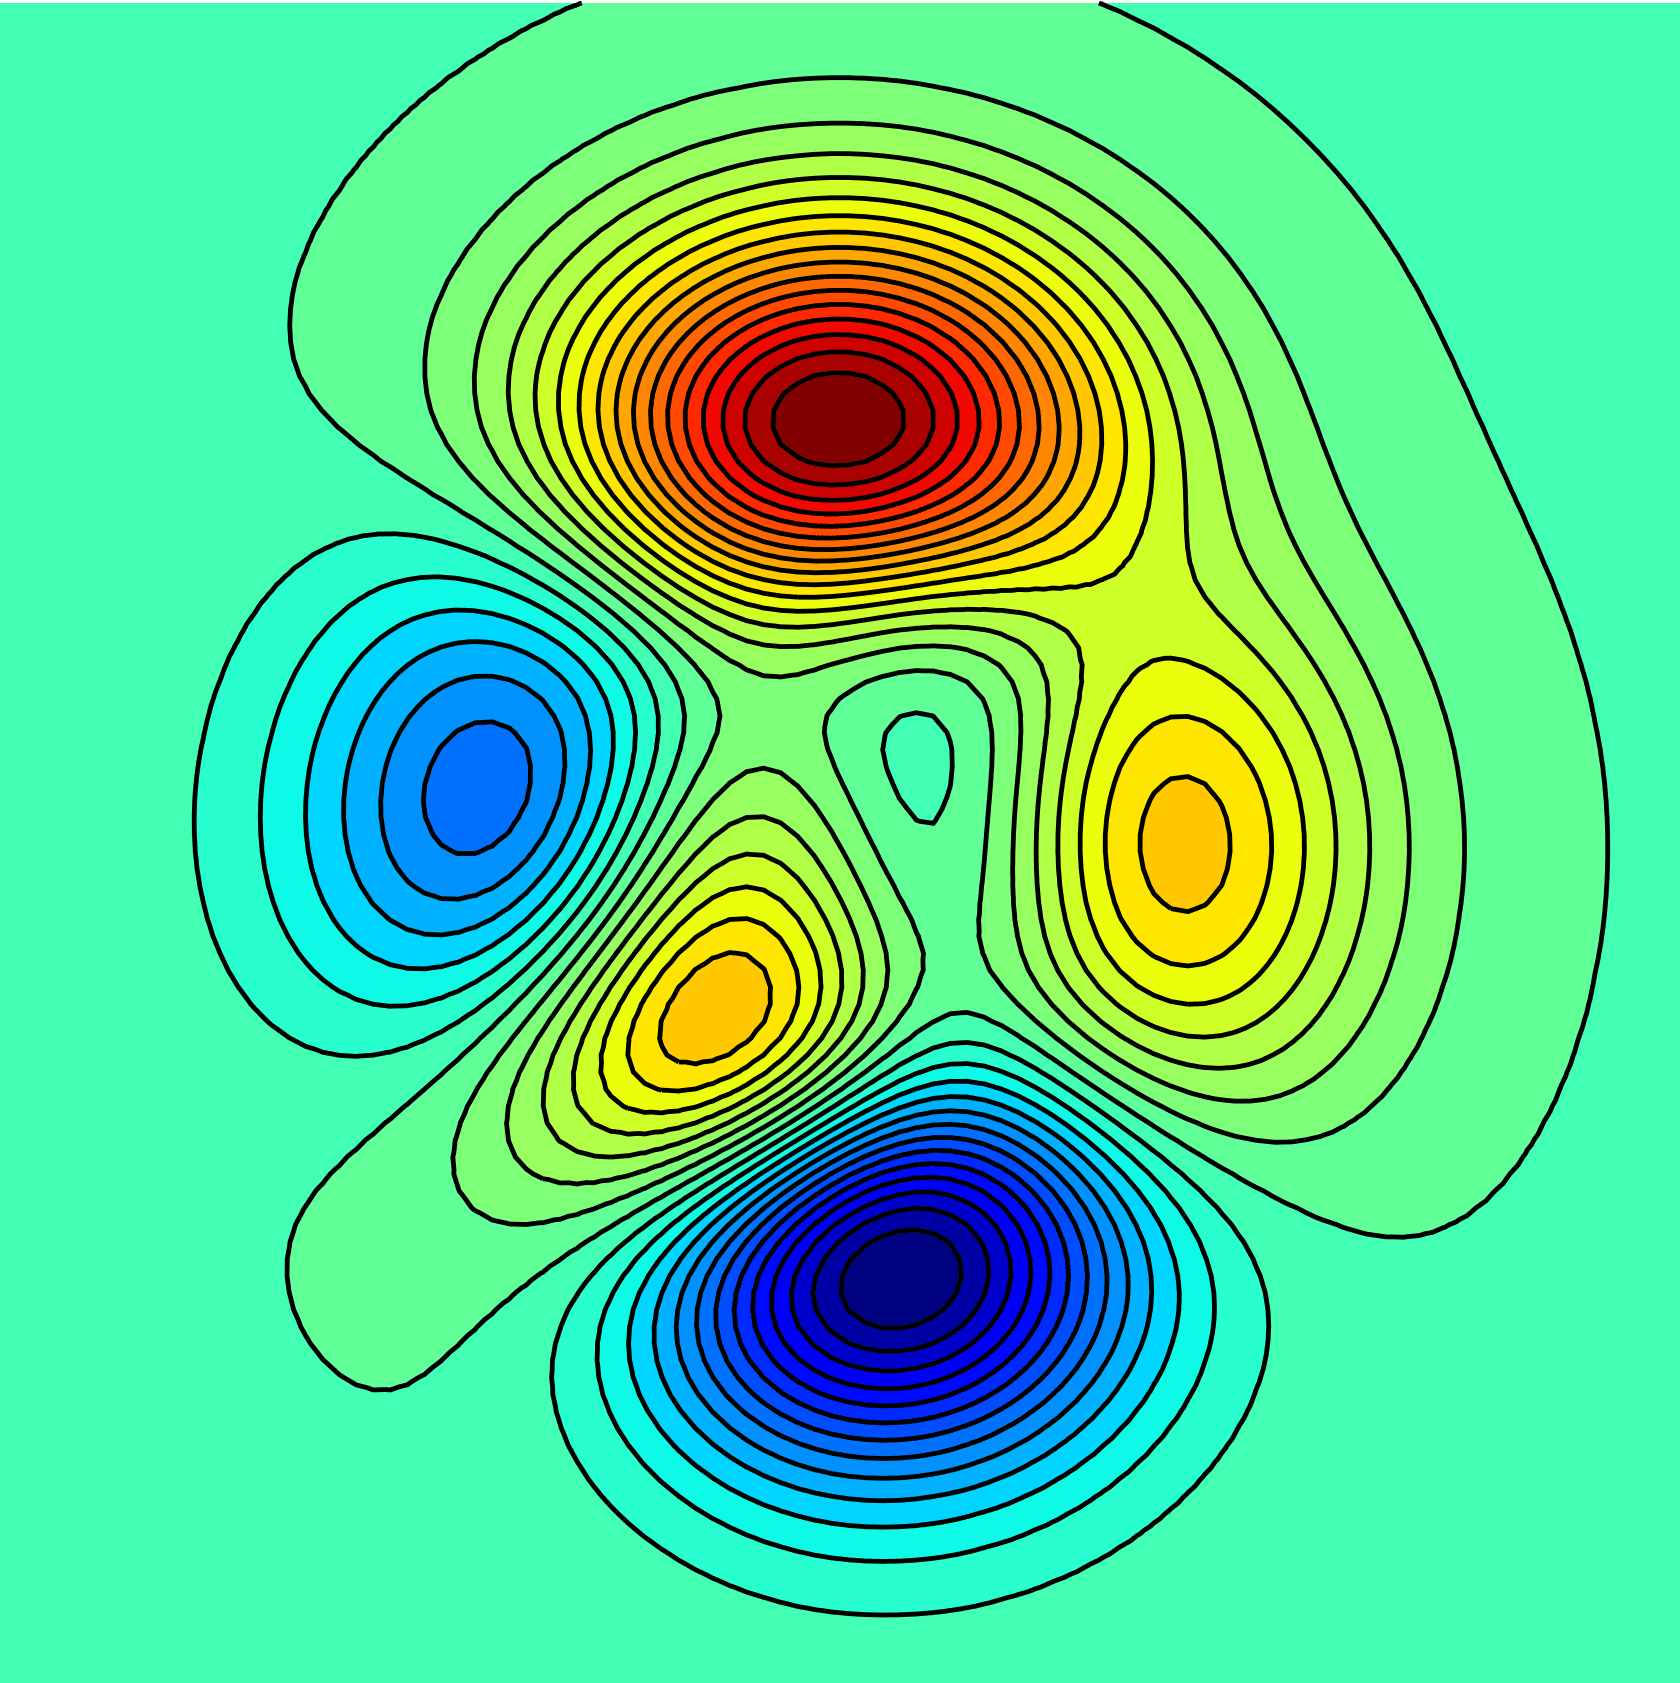
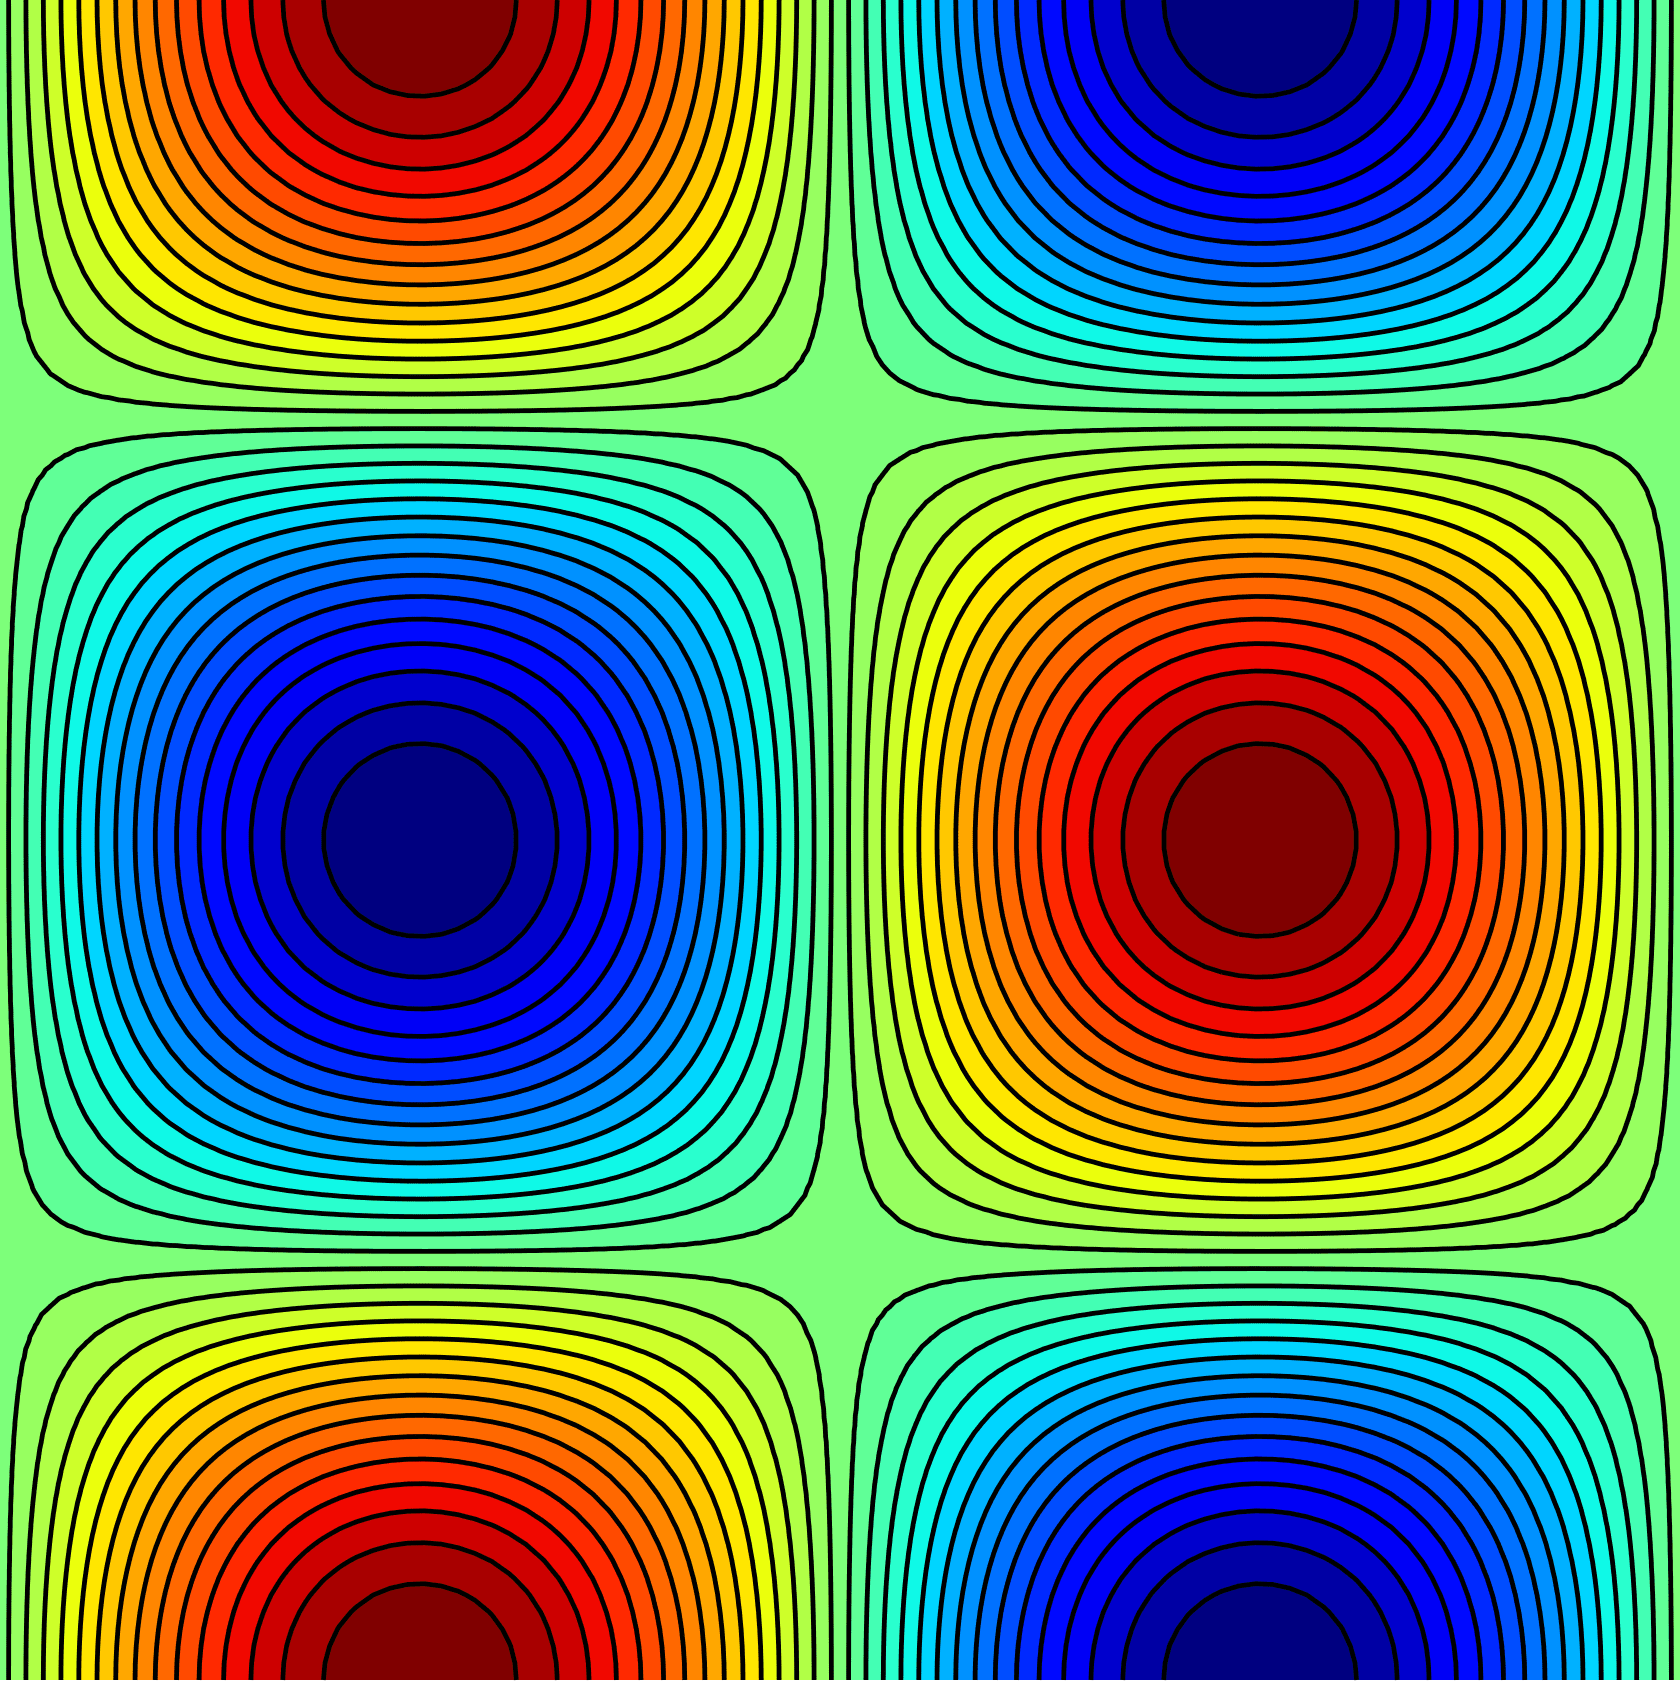
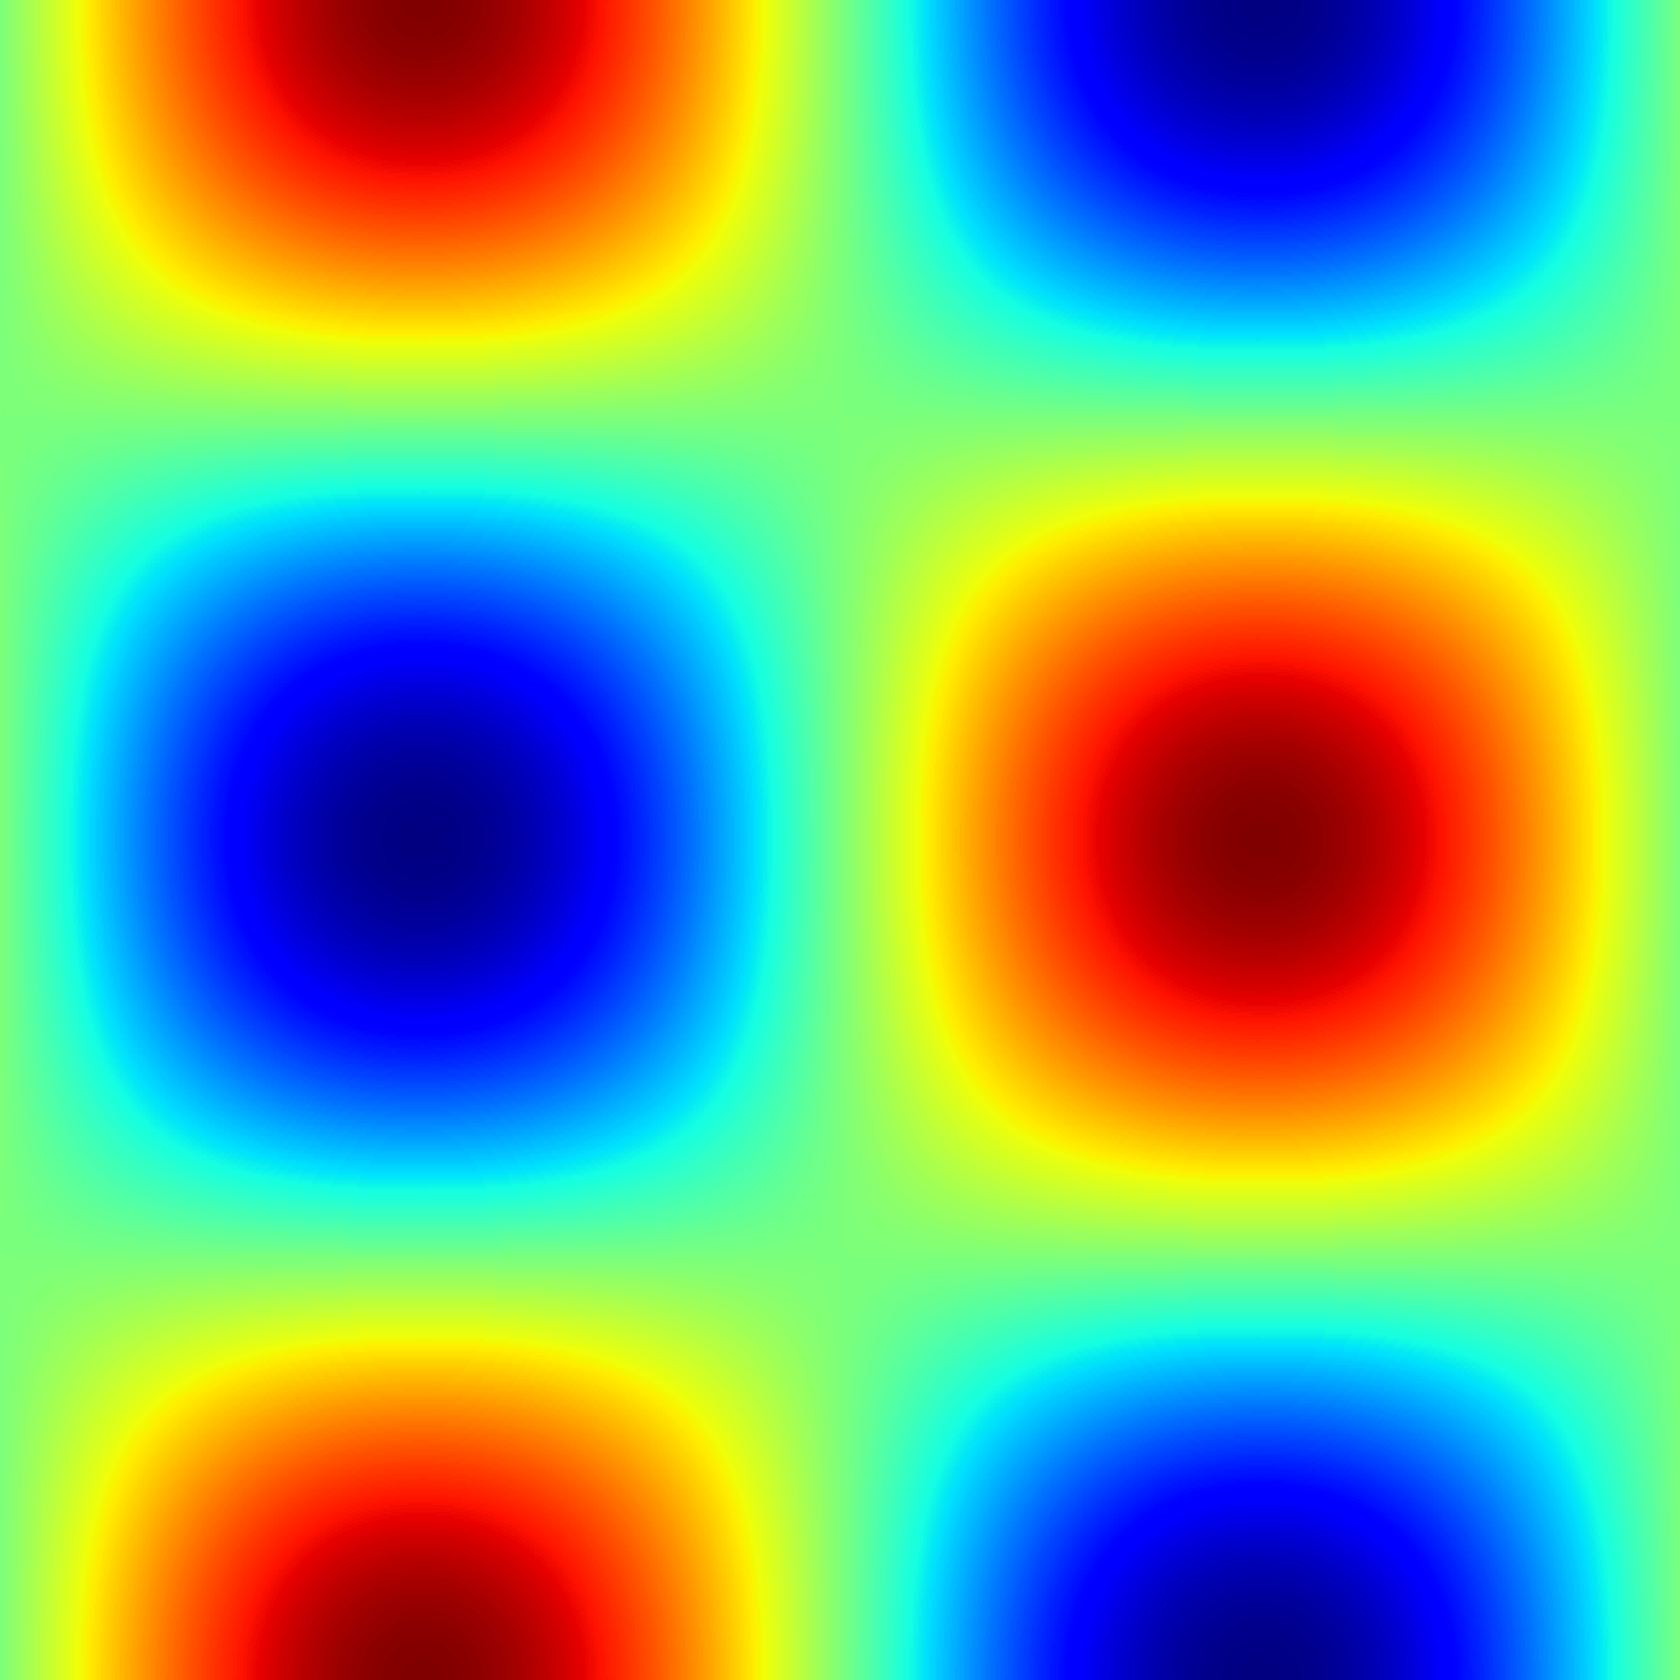
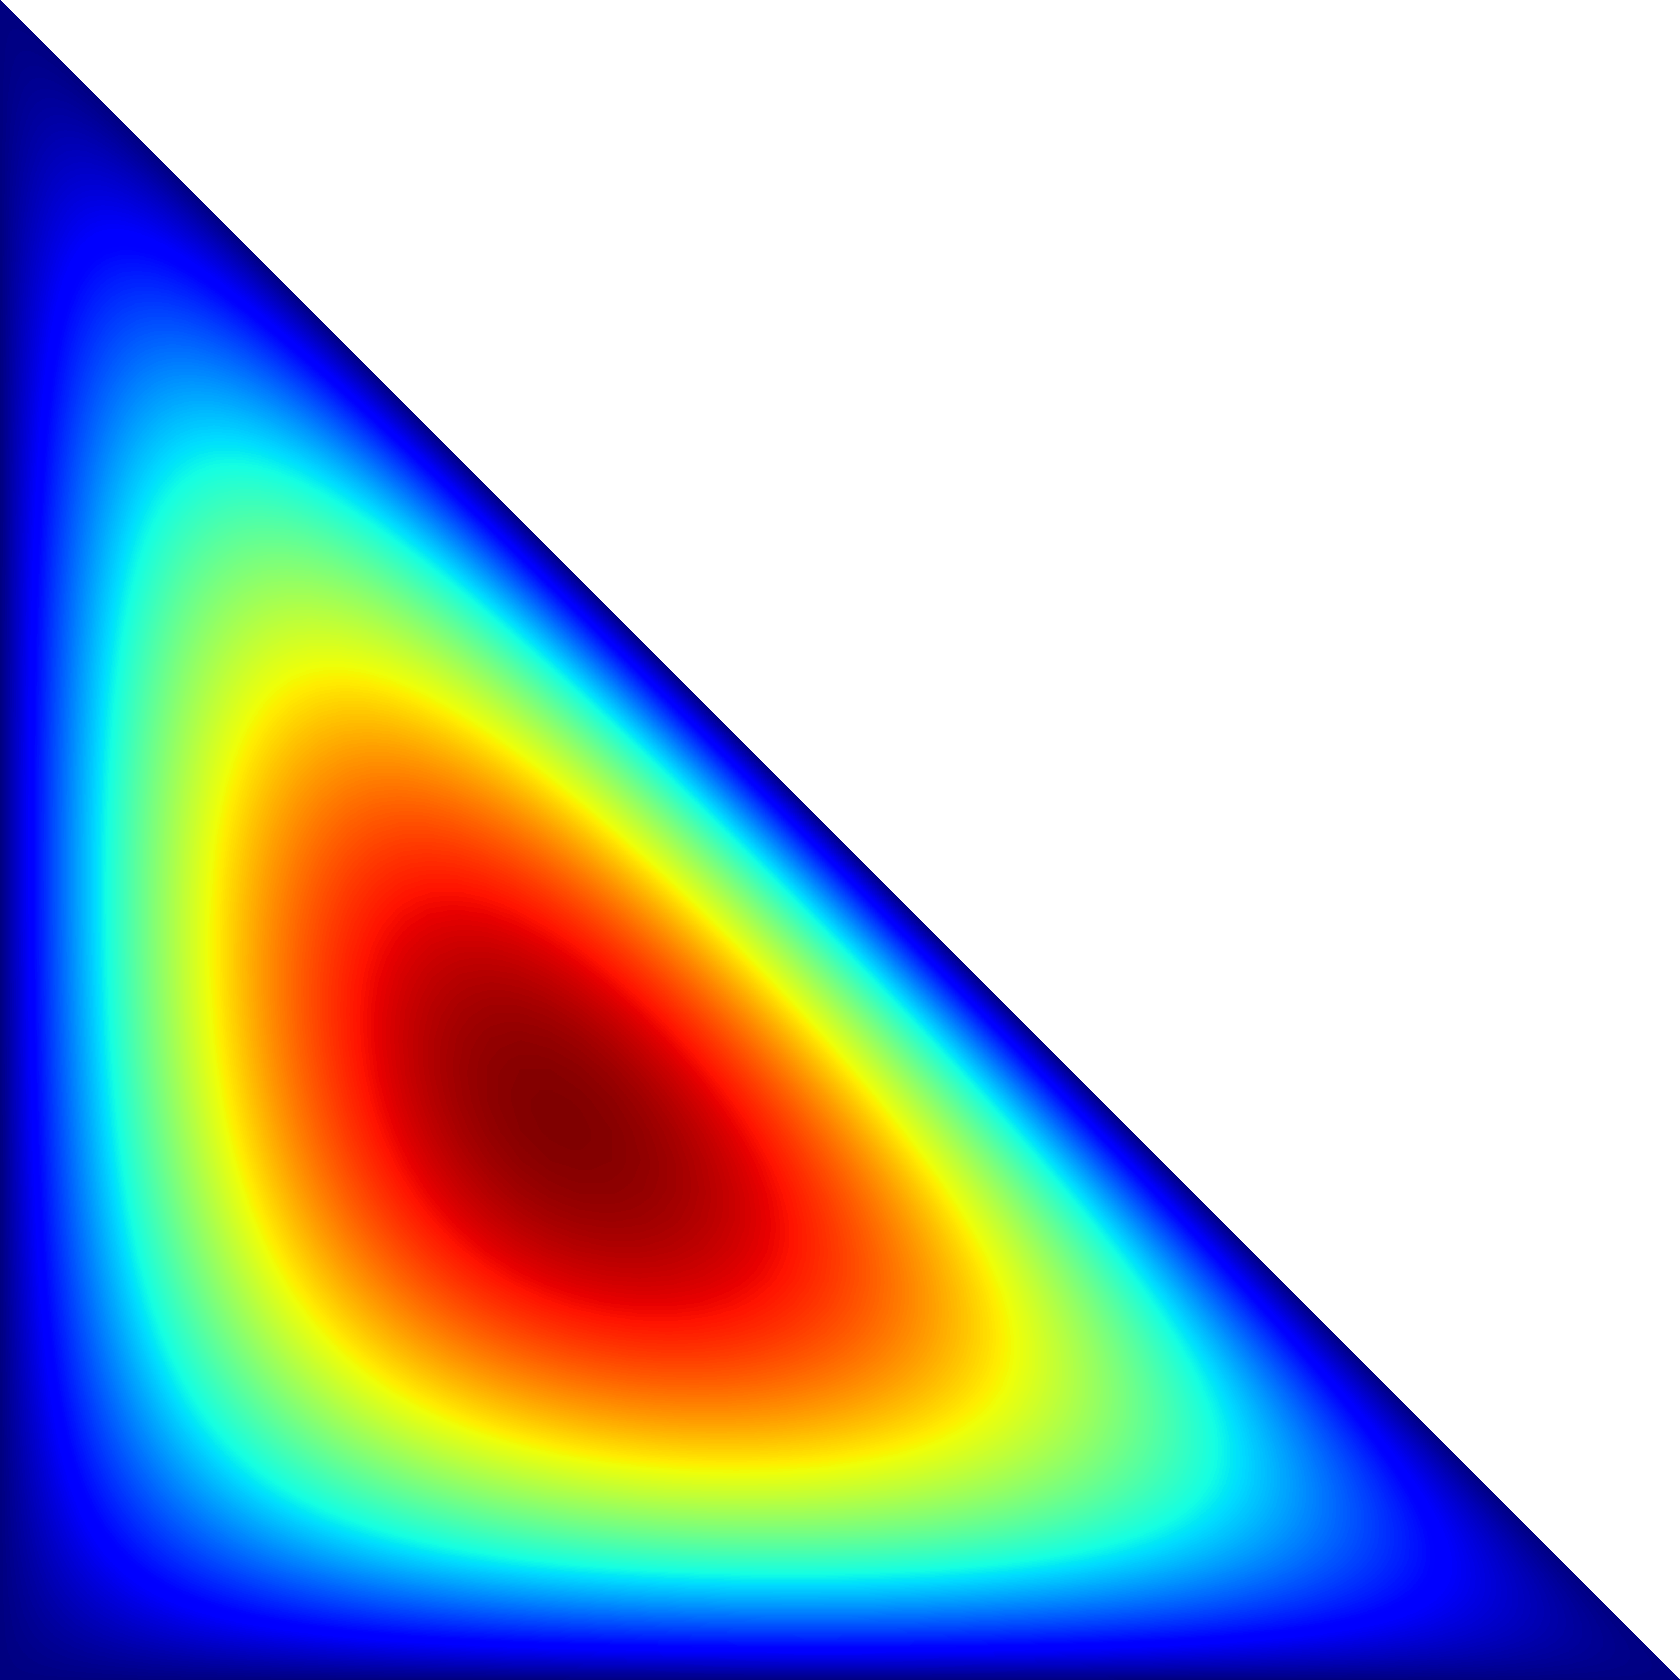
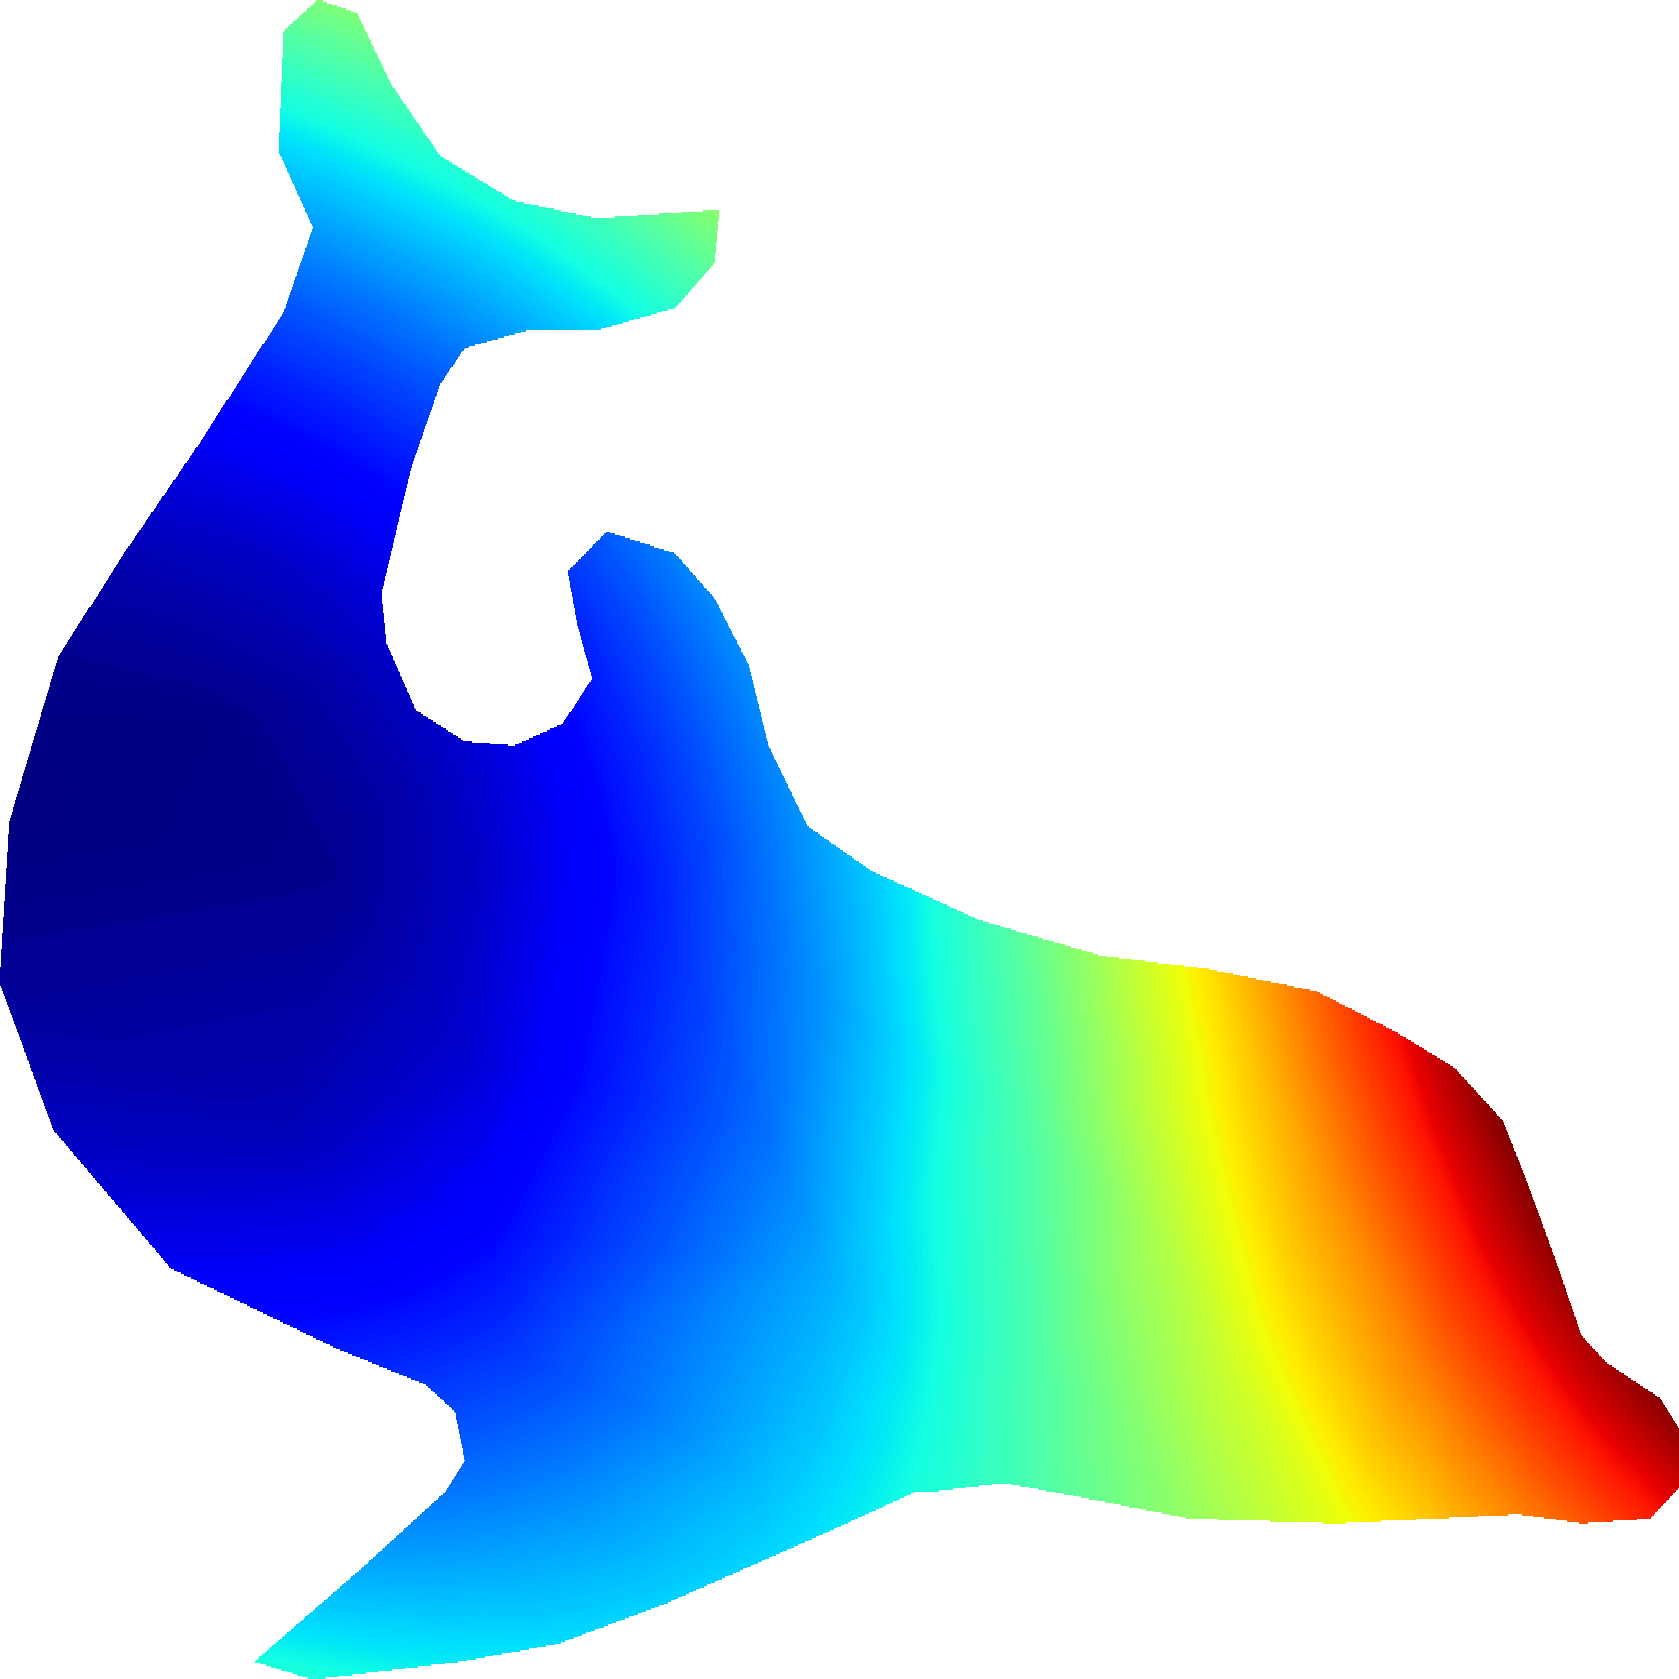
This package provides functionality for drawing contour lines, filled contour regions, and pseudocolor plots for data defined on unstructured triangular meshes in Julia. The plotting functionality is based on GR. The contouring algorithm is inspired by matplotlib.
Triplot.jl provides three plotting functions: tricontour, tricontourf, and
tripcolor.
Each of these functions takes x, y, z, and t arrays. x, y, and z
are one-dimensional arrays of length nv, where nv is the number of vertices
in the triangular mesh. x and y define the coordinates of the vertices, and
z defines the function values at each vertex.
The array t is an integer array of size (3,nt), where nt is the number of
triangles in the mesh. t[i,j] is the index of the ith vertex of the
jth triangle, and so (x[t[i,j]], y[t[i,j]]) are its coordinates.
tricontour and tricontourf take a levels argument, that can either be an
integer (for evenly spaced levels between the data bounds), or an array of
values corresponding to contour lines. tricontourf will fill the regions
defined between contour lines.
tripcolor generates a rasterized pseudocolor plot. The range used to compute
the pseudocolor values can be set by specifying zmin and zmax values (if
none are provided, the extremal values of the z array will be used).
Coloring is done using the current colormap in GR. This colormap can be set to
one of the built-in colormaps using GR.setcolormap, or it can be set to a
custom colormap using GR.setcolormapfromrgb. This is illustrated in the
example ex_contour.jl in order to draw contour lines of a uniform color.
