An R package to implement some of the methods of empirical dynamic modelling
This package complements our new paper:
Edwards, A.M, L.A. Rogers, and C.A. Holt (2024). Explaining empirical dynamic modelling using verbal, graphical and mathematical approaches. Ecology and Evolution, 14:e10903, 1-12. https://doi.org/10.1002/ece3.10903
Part of the Supporting Information is a narrated movie (based on animations produced by this package), downloadable here.
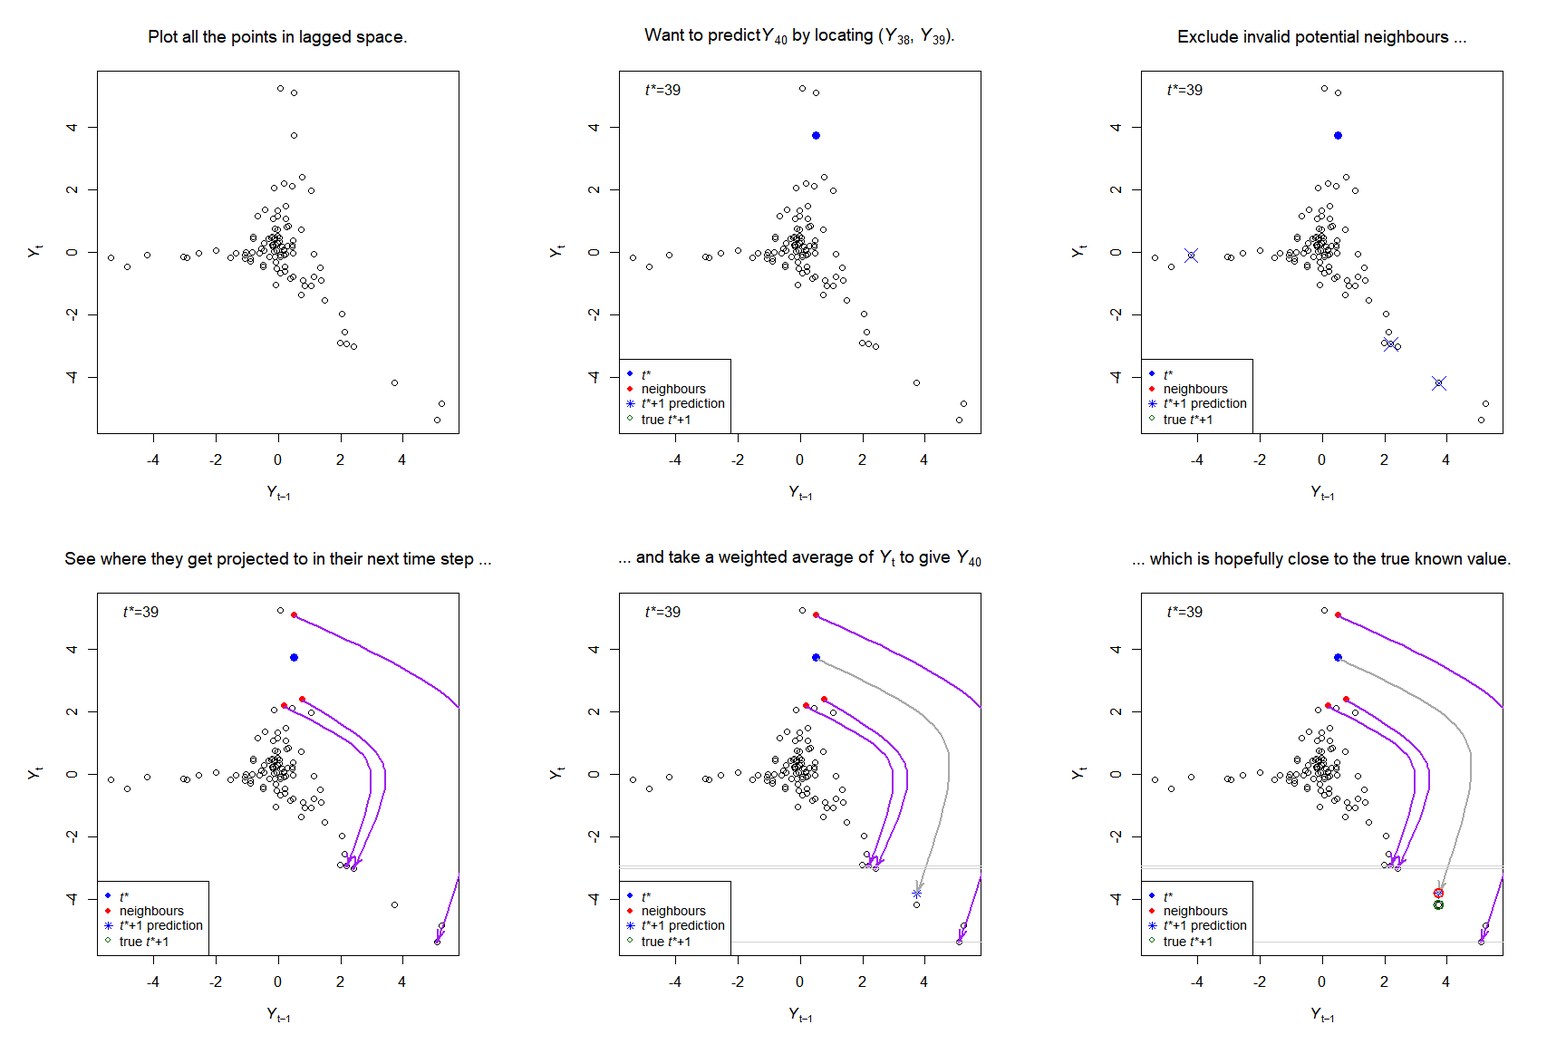
The package implements the simplex and S-map algorithms of empirical dynamic modelling (EDM), and creates visualisations to help understand the methods, for example:
Users can also analyse their own data. The package can be installed directly from GitHub (see instructions below).
The name pbsEDM combines two acronyms - PBS (our workplace, the Pacific Biological Station, in British Columbia, Canada) and EDM.
The vignettes are already rendered here:
- analyse_simple_time_series.html How to analyse a simple time series using the simplex algorithm, and produce figures that help understand the algorithm.
- aspect_2.html Detailing of aspect 2.
- negative_predictions.html Demonstrations of getting negative predictions, and also how the correlation coefficients differ between looking at predictions of lagged values and predictions of the actual population values.
- pbsSmap.html Demonstration of S-map code.
The source code written in Rmarkdown, the R code that gets extracted from the
Rmarkdown code, and the resulting .html files are all found within your library
folder (where all your R libraries get saved), in
library\pbsEDM\doc\. Or you can look at the vignettes\ folder on GitHub or locally. Terms like `aspect 2' will make more sense upon reading of the manuscript.
Just run the following code. Type the function name (or look at the help with ?<function_name>) to see what it does.
E_results <- pbsEDM_Evec(NY_lags_example$N_t)

plot_pbsEDM_Evec_save(E_results)      # Figure 1

plot_explain_edm_save(E_results[[1]]) # Figure 2

plot_rho_Evec_save()                  # Figure 3

plot_library_size_save()              # Figure 4

# Animated figures for the Appendix:

plot_pbsEDM_Evec_movie_save(E_results)                # Figure A.1

plot_explain_edm_movie_save(E_results[[1]])           # Figure A.2

plot_explain_edm_all_tstar_movie_save(E_results[[1]]) # Figure A.3
install.packages("remotes")    # If you do not already have the "remotes" package
remotes::install_github("pbs-assess/pbsEDM")
If you get an error like
Error in utils::download.file(....)
then the connection may be timing out. Try
options(timeout = 1200)
and then try and install again.
Our motivation for this work was initially to fully understand the steps of EDM, which led to us writing this package. As described in our paper:
Our intention is for pbsEDM to complement the popular R package rEDM and its tutorial, plus the Python package pyEDM, to aid understanding and reproducibility. All intermediate calculations are available as output in pbsEDM and all code is in R, while rEDM contains C++ code (which is faster than R code but less readable than R to many ecologists); however, rEDM and pyEDM also include advanced algorithms that are not in pbsEDM.
If you use our package then please cite it so that we can keep track and will continue to update it. See citation("pbsEDM") for a bibTeX entry, or use:
Rogers, L. A., and Edwards, A. M. (2023). pbsEDM: An R package to implement some of the methods of empirical dynamic modelling. Available at https://github.com/pbs-assess/pbsEDM.
Please report any problems as a GitHub Issue or by email, using a minimal working example if possible (and please check the closed issues first).
