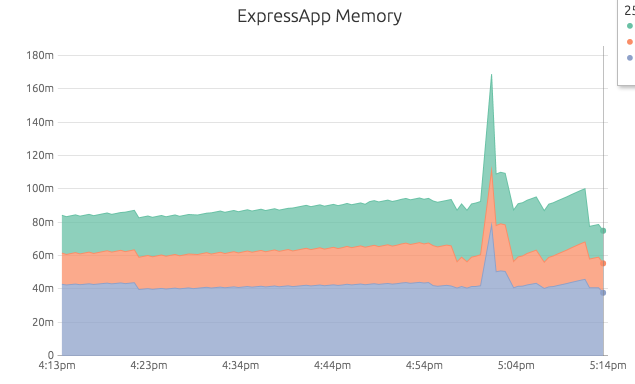
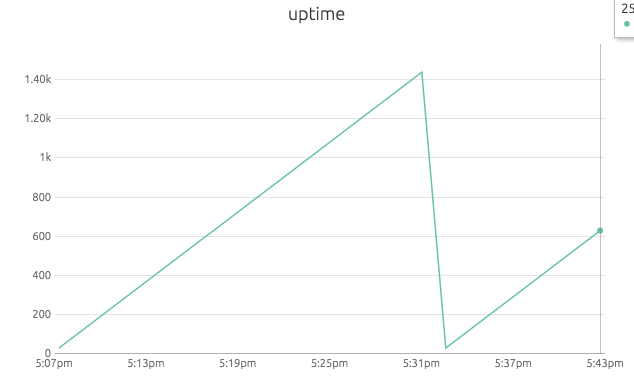
This is a node client for the OpsDash Server Monitor. You can report process metrics like memory and cpu usage and of course your own individual metrics.
It requires NodeJS >= 4.0.0
npm install --save opsdash-clientlet opsDashClient = require('opsdash-client')
let opsDashReporter = opsDashClient({
server: 'http://yourOpsDashDomain:8080',
interval: 30,
source: 'expressApp-' + opsDashClient.hostname
})The option object can have the following attributes:
- server: Address of your OpsDash server including the port.
- interval: Default interval for sending metrics in seconds.
- reportProcessMetrics: Boolean, default
true. Should the opsDashClient automatically send process reports (details see below). - source: Name of the source.
The opsDashClient can send the following metrics of your node process:
- memory.rss
- memory.heapUsed
- memory.heapTotal
- cpu (CPU usage in %)
- uptime (uptime of your node process in seconds - great to identify crashes or restarts)
If you instantiate your reporter with reportProcessMetrics set to true, then this metrics will be reported automatically (default).
Otherwise you can start sending this metrics manually:
opsDashReporter.startProcessReporting()If you want to stop sending this metrics:
opsDashReporter.stopProcessReporting()If you don't want to send all available process metrics, you can start them manually. For example, to only report the cpu usage:
opsDashReporter.addMetric(
  'cpu',
  {type: 'callback', start:true},
  opsDashClient.processReporter.cpu
)Currently three different types of values are supported:
- Simple values like counters
- Setting values with a synchronous function
- Setting values with an asynchronous callback
To add a new metric use the opsDashReporter.addMetric(name, options, callback) method.
Setup:
//Add new metric and start reporting
opsDashReporter.addMetric(
  'numberOfLogins',
  {type: 'value', start: true, reset:true}
)
Options:
- type: In case of simple values, this must be
value - start: Boolean, should we stat the reporting automatically?
- reset: Boolean. If
true, the value will be reseted after every report interval, defaulttrue - startValue: The initial value of your metric, default
0 - interval: The reporting interval in seconds. If not set, the default interval will be used.
Increase the value:
//will increase the value by 1:
opsDashReporter.incMetric('numberOfLogins')

//will increase the value by number
opsDashReporter.incMetric('numberOfLogins', number)

//will set the value to number
opsDashReporter.setMetricValue('numberOfLogins', number)Setup:
//Add new metric and start reporting
opsDashReporter.addMetric(
  'numberOfLogins',
  {type: 'callback', start: true, reset:true},
  yourCallbackFunction
)
In this case you provide a callback function to get the current value of your metric.
If this is a synchronous function, this callback must not have any parameters and must return the value of your metric.
If this is a asynchronous function, the function must have a callback function in the form of function(err, result) as the only parameter.
The opsDashClient emits a error-Event:
opsDashReporter.on('error', function(err){
  console.error(err);
})- Support Basic Auth
- Improve error handling
- Check usage in cluster mode


