For quite some time, I had a spare Raspberry Pi lying around in my place. And one weekend I came up with idea to make my apartment "smarter". What I mean by saying "smarter" is tracking some metrics of my surroundings.
I have some experience in working with Prometheus and Grafana, so I decided to incorporate those tools into my solution. Yes, it does sound like overengineering simple task, you can probably get same results in much simpler way : ).
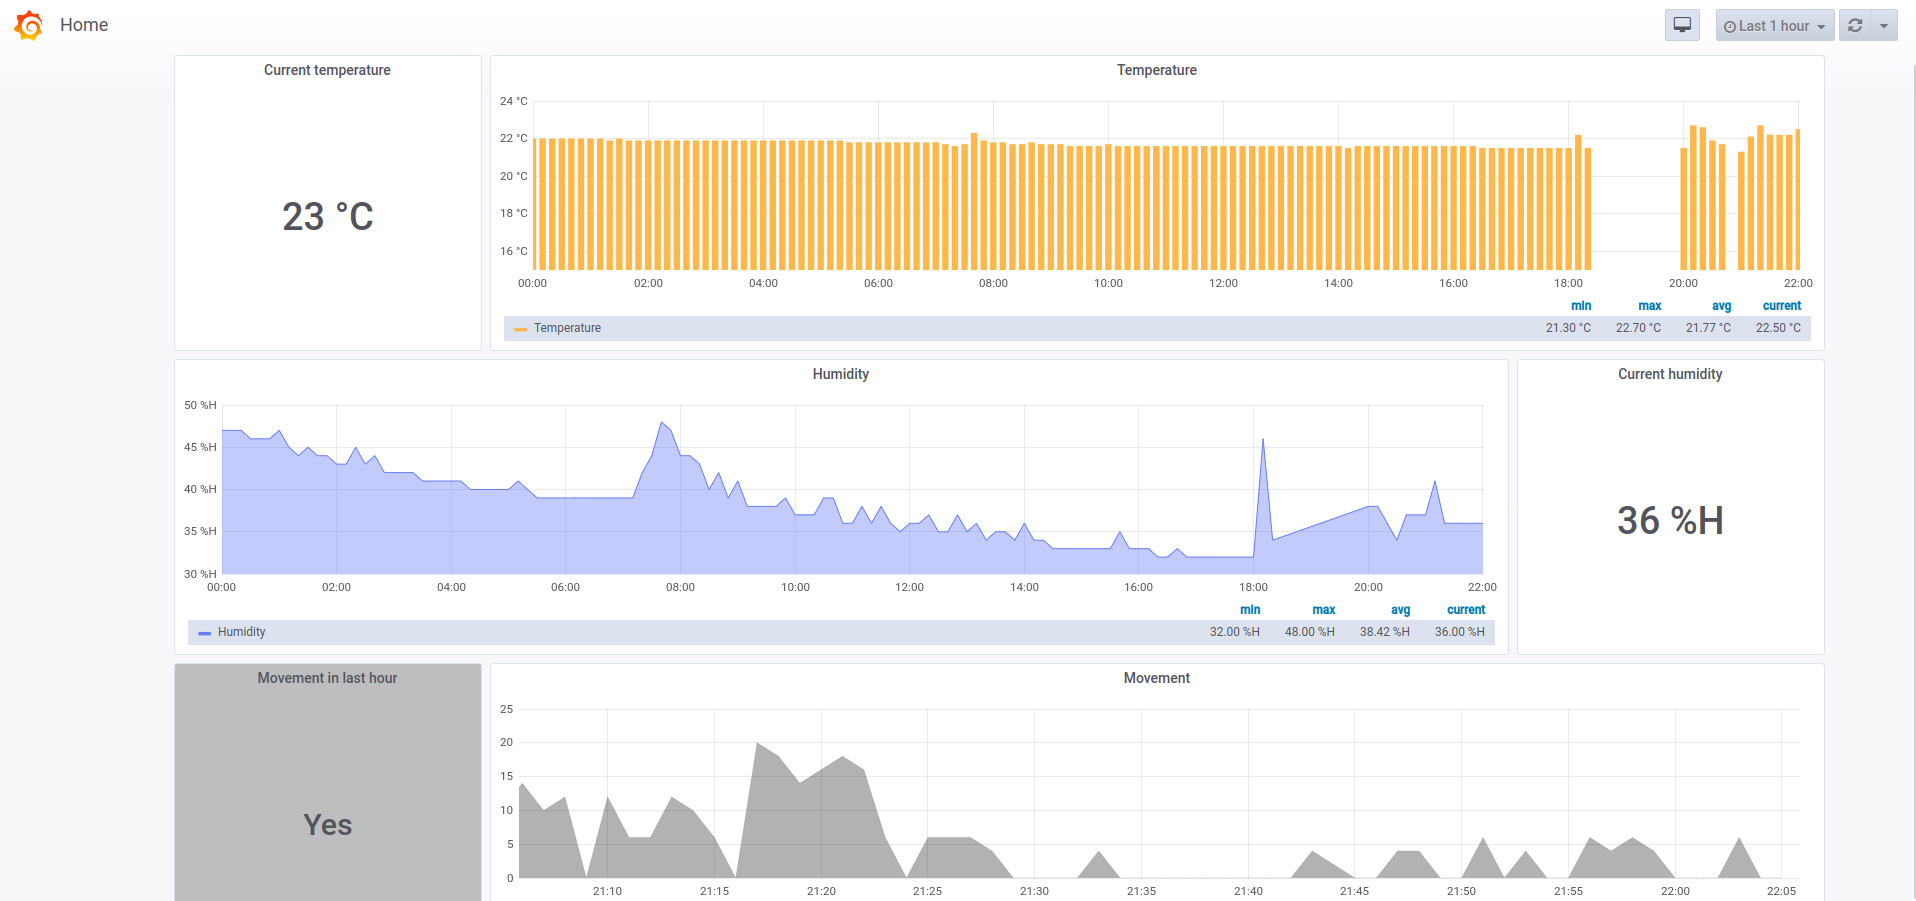
By deploying this project with all its components, you'll be able to track these metrics:
- Room temperature
- Humidity
- Movement
- Nearby bluetooth devices
- Connected network devices
These are all the component, I used in my project:
- Raspberry Pi 3 Model B
- 16 GB microSD card
- DHT11 Temperature And Humidity Sensor
- Motion Sensor HC-SR501
- Mobile phone charger, for powering Raspberry Pi
I connected Ground pin to the Ground of Raspberry PI, Data Pin to GPIO 14 pin, Vcc pin to 3.3V power supply pin.
I connected Ground pin to the Ground of Raspberry PI, Data Pin to GPIO 17 pin, Vcc pin to 5V power supply pin.
For reading DHT11 sensor data and feeding it to Prometheus, I chose DHT11_Python library, which is quite unstable, and sometimes does not return valid results, so you might get some gaps in your graphs.
For HC-SR501, I wrote simple python code myself.
You can browse source code of this project, for more details:
- application/temperature.py & application/dht11.py for temperature & humidity readings;
- application/motion.py for motion sensor;
- application/webapp.py for prometheus endpoint.
To scrape metrics from my Flask API, I've added configuration to prometheus.yml:
global:
    scrape_interval: 30s
scrape_configs:
    - job_name: 'pihome'
      static_configs:
- targets: [pihome:5000]Then, in /etc/grafana/provisioning, I've added datasource configuration:
apiVersion: 1
datasources:
  - name: Prometheus
    type: prometheus
    url: http://prometheus:9090/
    access: proxy
    isDefault: true
It is also possible to add Grafana dashboards to provisioning folder as json files, so that you don't need to create new dashboard each time you re-deploy Grafana.
To make everything portable and easy to install, I packed my Flask API to Docker image and configured all services in docker-compose.yaml.
To deploy whole stack you have to add .env file with some configuration properties:
HOST_IP=192.168.1.216
NETWORK_TO_SCAN=192.168.1.0/24
GRAFANA_PASSWORD=pihome
After adding .env, file run docker-compose build & docker-compose up -d.
