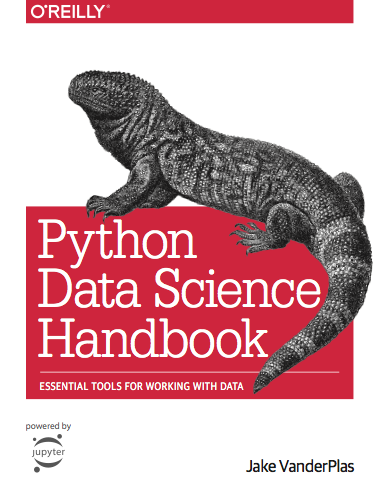
Python Data Science Handbook
This repository contains the entire Python Data Science Handbook, in the form of (free!) Jupyter notebooks.
The book was written and tested with Python 3.5, though older Python versions (including Python 2.7) should work in nearly all cases.
The book introduces the core libraries essential for working with data in Python: particularly IPython, NumPy, Pandas, Matplotlib, Scikit-Learn, and related packages. Familiarity with Python as a language is assumed; if you need a quick introduction to the language itself, see the free companion project, A Whirlwind Tour of Python: it's a fast-paced introduction to the Python language aimed at researchers and scientists.
The following listing links to the notebooks in this repository, rendered through the nbviewer service:
Table of Contents
Preface
1. IPython: Beyond Normal Python
- Help and Documentation in IPython
- Keyboard Shortcuts in the IPython Shell
- IPython Magic Commands
- Input and Output History
- IPython and Shell Commands
- Errors and Debugging
- Profiling and Timing Code
- More IPython Resources
2. Introduction to NumPy
- Understanding Data Types in Python
- The Basics of NumPy Arrays
- Computation on NumPy Arrays: Universal Functions
- Aggregations: Min, Max, and Everything In Between
- Computation on Arrays: Broadcasting
- Comparisons, Masks, and Boolean Logic
- Fancy Indexing
- Sorting Arrays
- Structured Data: NumPy's Structured Arrays
3. Data Manipulation with Pandas
- Introducing Pandas Objects
- Data Indexing and Selection
- Operating on Data in Pandas
- Handling Missing Data
- Hierarchical Indexing
- Combining Datasets: Concat and Append
- Combining Datasets: Merge and Join
- Aggregation and Grouping
- Pivot Tables
- Vectorized String Operations
- Working with Time Series
- High-Performance Pandas: eval() and query()
- Further Resources
4. Visualization with Matplotlib
- Simple Line Plots
- Simple Scatter Plots
- Visualizing Errors
- Density and Contour Plots
- Histograms, Binnings, and Density
- Customizing Plot Legends
- Customizing Colorbars
- Multiple Subplots
- Text and Annotation
- Customizing Ticks
- Customizing Matplotlib: Configurations and Stylesheets
- Three-Dimensional Plotting in Matplotlib
- Geographic Data with Basemap
- Visualization with Seaborn
- Further Resources
5. Machine Learning
- What Is Machine Learning?
- Introducing Scikit-Learn
- Hyperparameters and Model Validation
- Feature Engineering
- In-Depth: Naive Bayes Classification
- In-Depth: Linear Regression
- In-Depth: Support Vector Machines
- In-Depth: Decision Trees and Random Forests
- In-Depth: Principal Component Analysis
- In-Depth: Manifold Learning
- In-Depth: k-Means Clustering
- In-Depth: Gaussian Mixture Models
- In-Depth: Kernel Density Estimation
- Application: A Face Detection Pipeline
- Further Machine Learning Resources
Appendix: Figure Code
Required Packages
The code in the book was tested with Python 3.5, though most (but not all) will also work correctly with Python 2.7 and other older Python versions.
The packages I used to run the code in the book are listed in requirements.txt (Note that some of these exact version numbers may not be available on your platform: you may have to tweak them for your own use). To install the requirements using conda, run the following at the command-line:
$ conda install --file requirements.txt
To create a stand-alone environment named PDSH with Python 3.5 and all the required package versions, run the following:
$ conda create -n PDSH python=3.5 --file requirements.txt
You can read more about using conda environments in the Managing Environments section of the conda documentation.
License
Code
The code in this repository, including all code samples in the notebooks listed above, is released under the MIT license. Read more at the Open Source Initiative.
Text
The text content of the book is released under the CC-BY-NC-ND license. Read more at Creative Commons.
