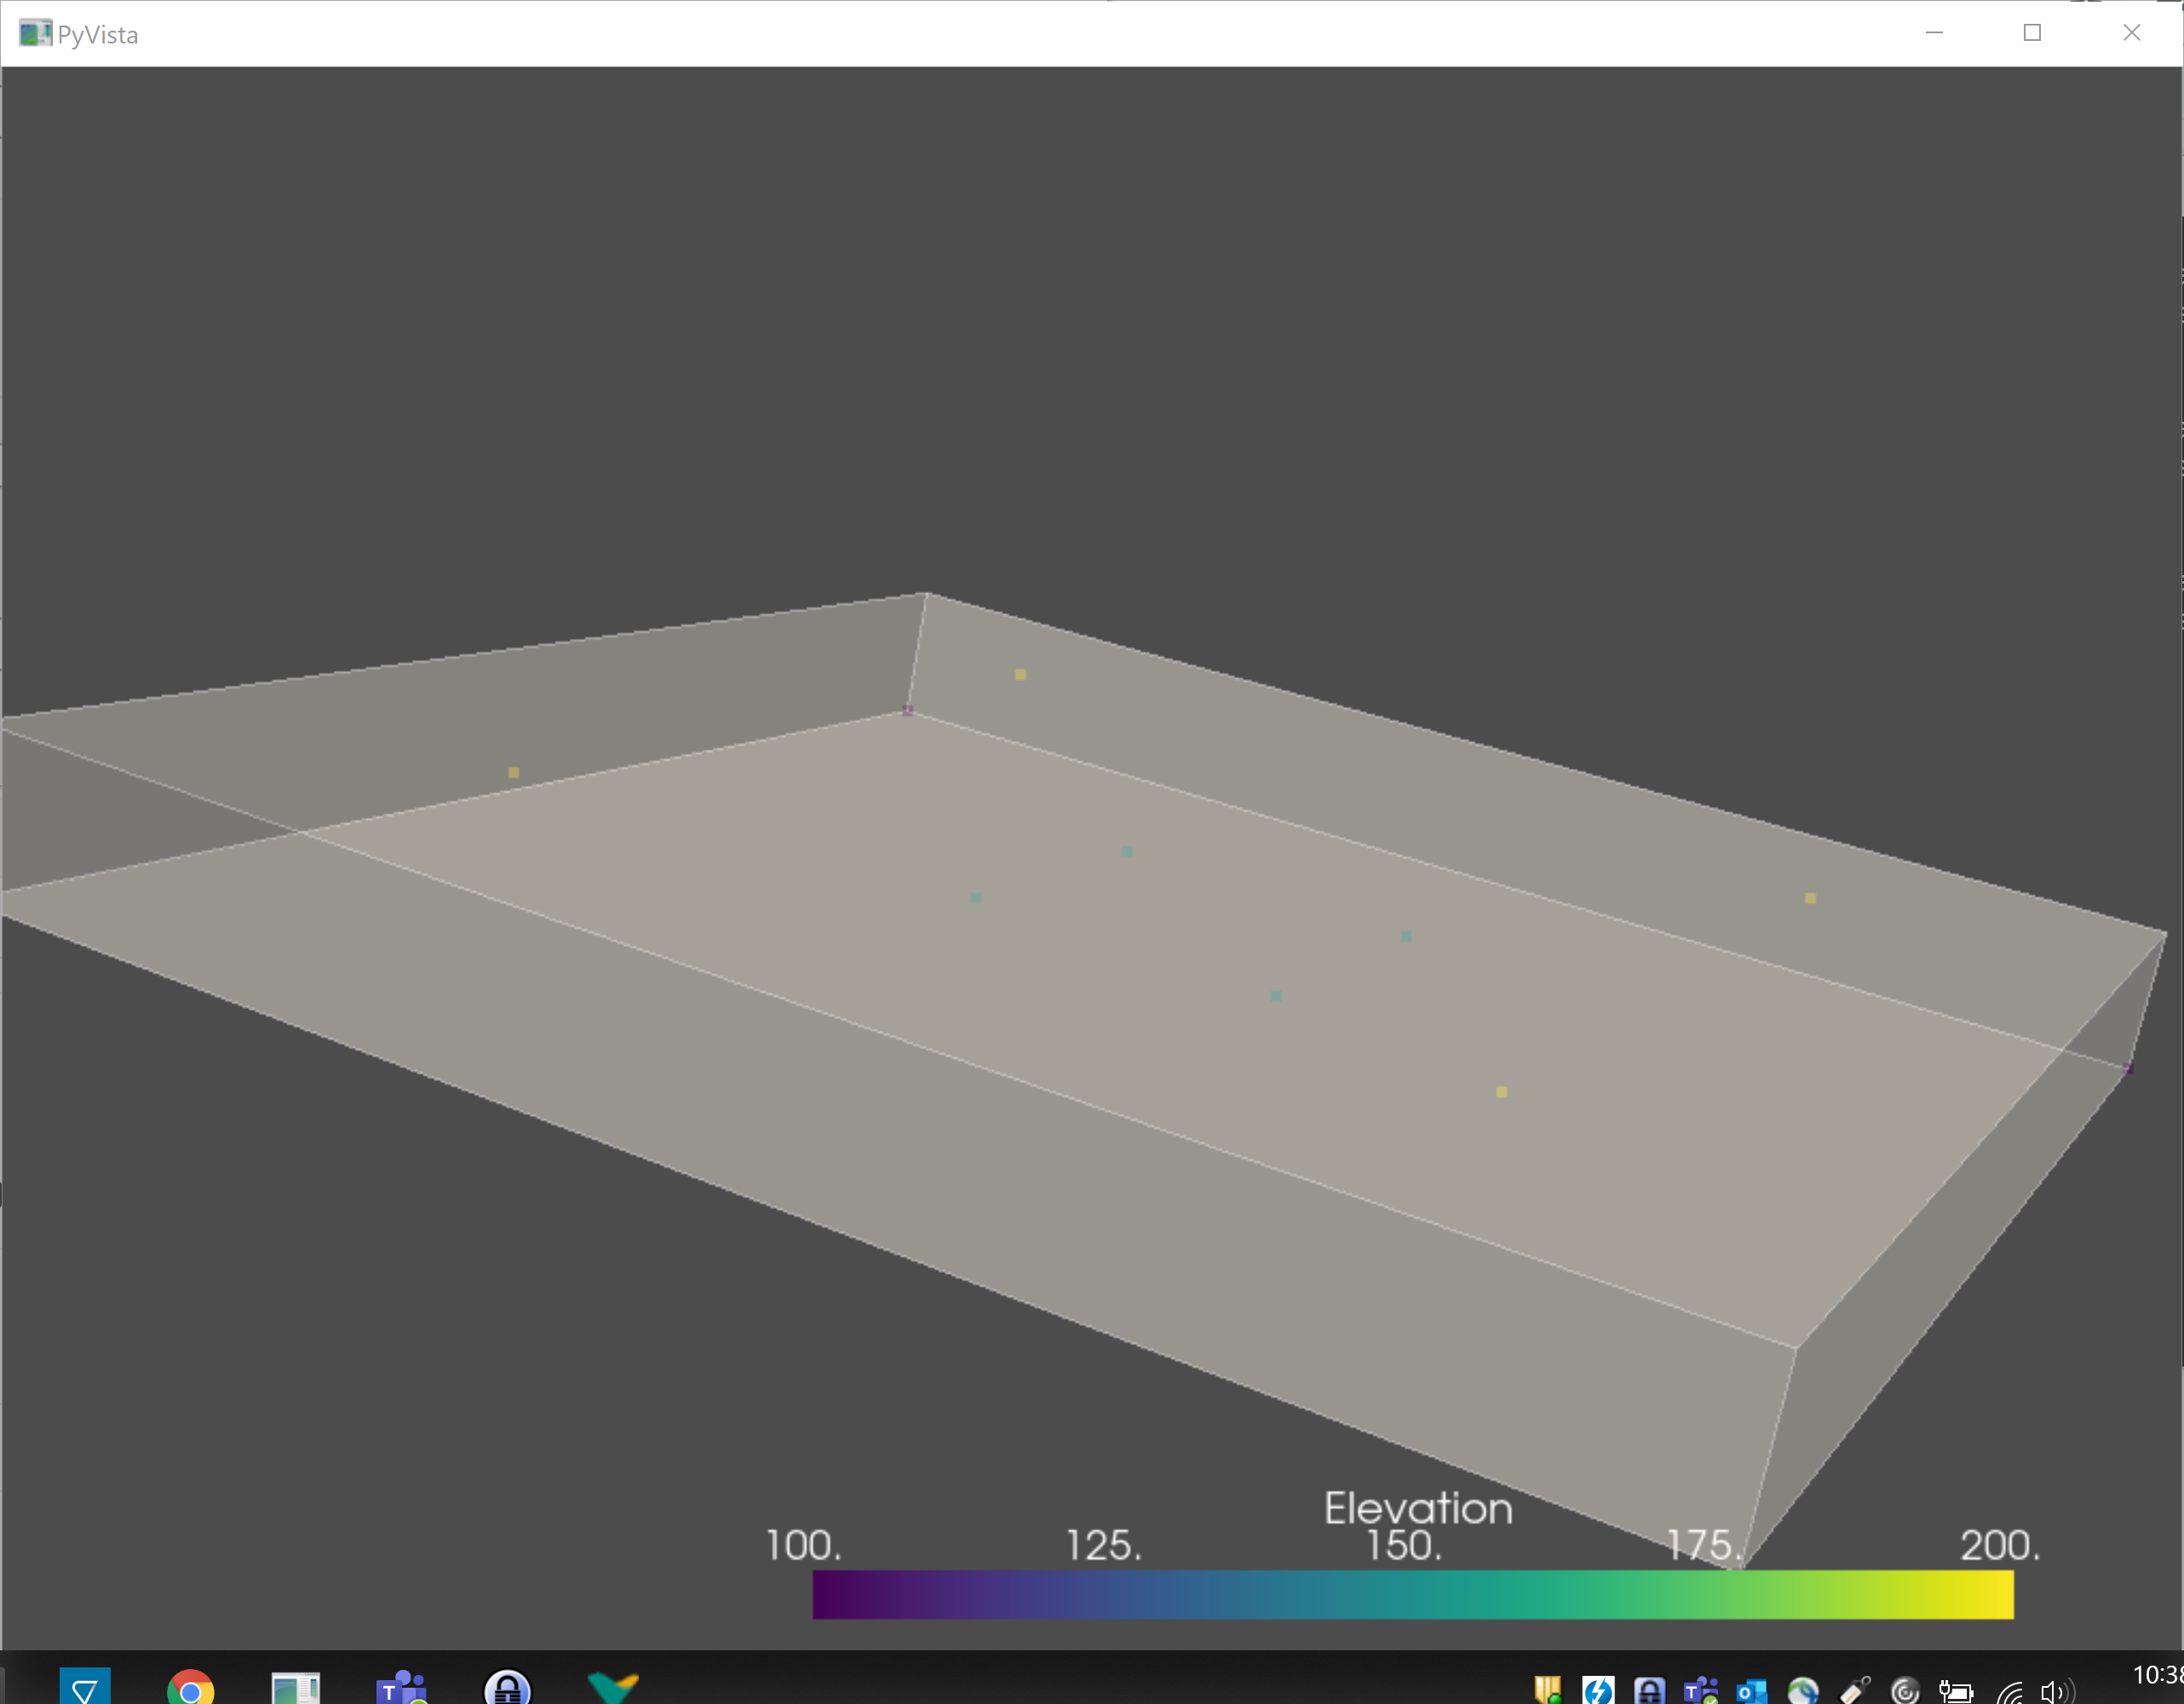
Creates simplified surfaces from dense point clouds.
This script provides a open source and simple way to create simplified/lightweight triangulated surfaces (and solids) from dense point data.
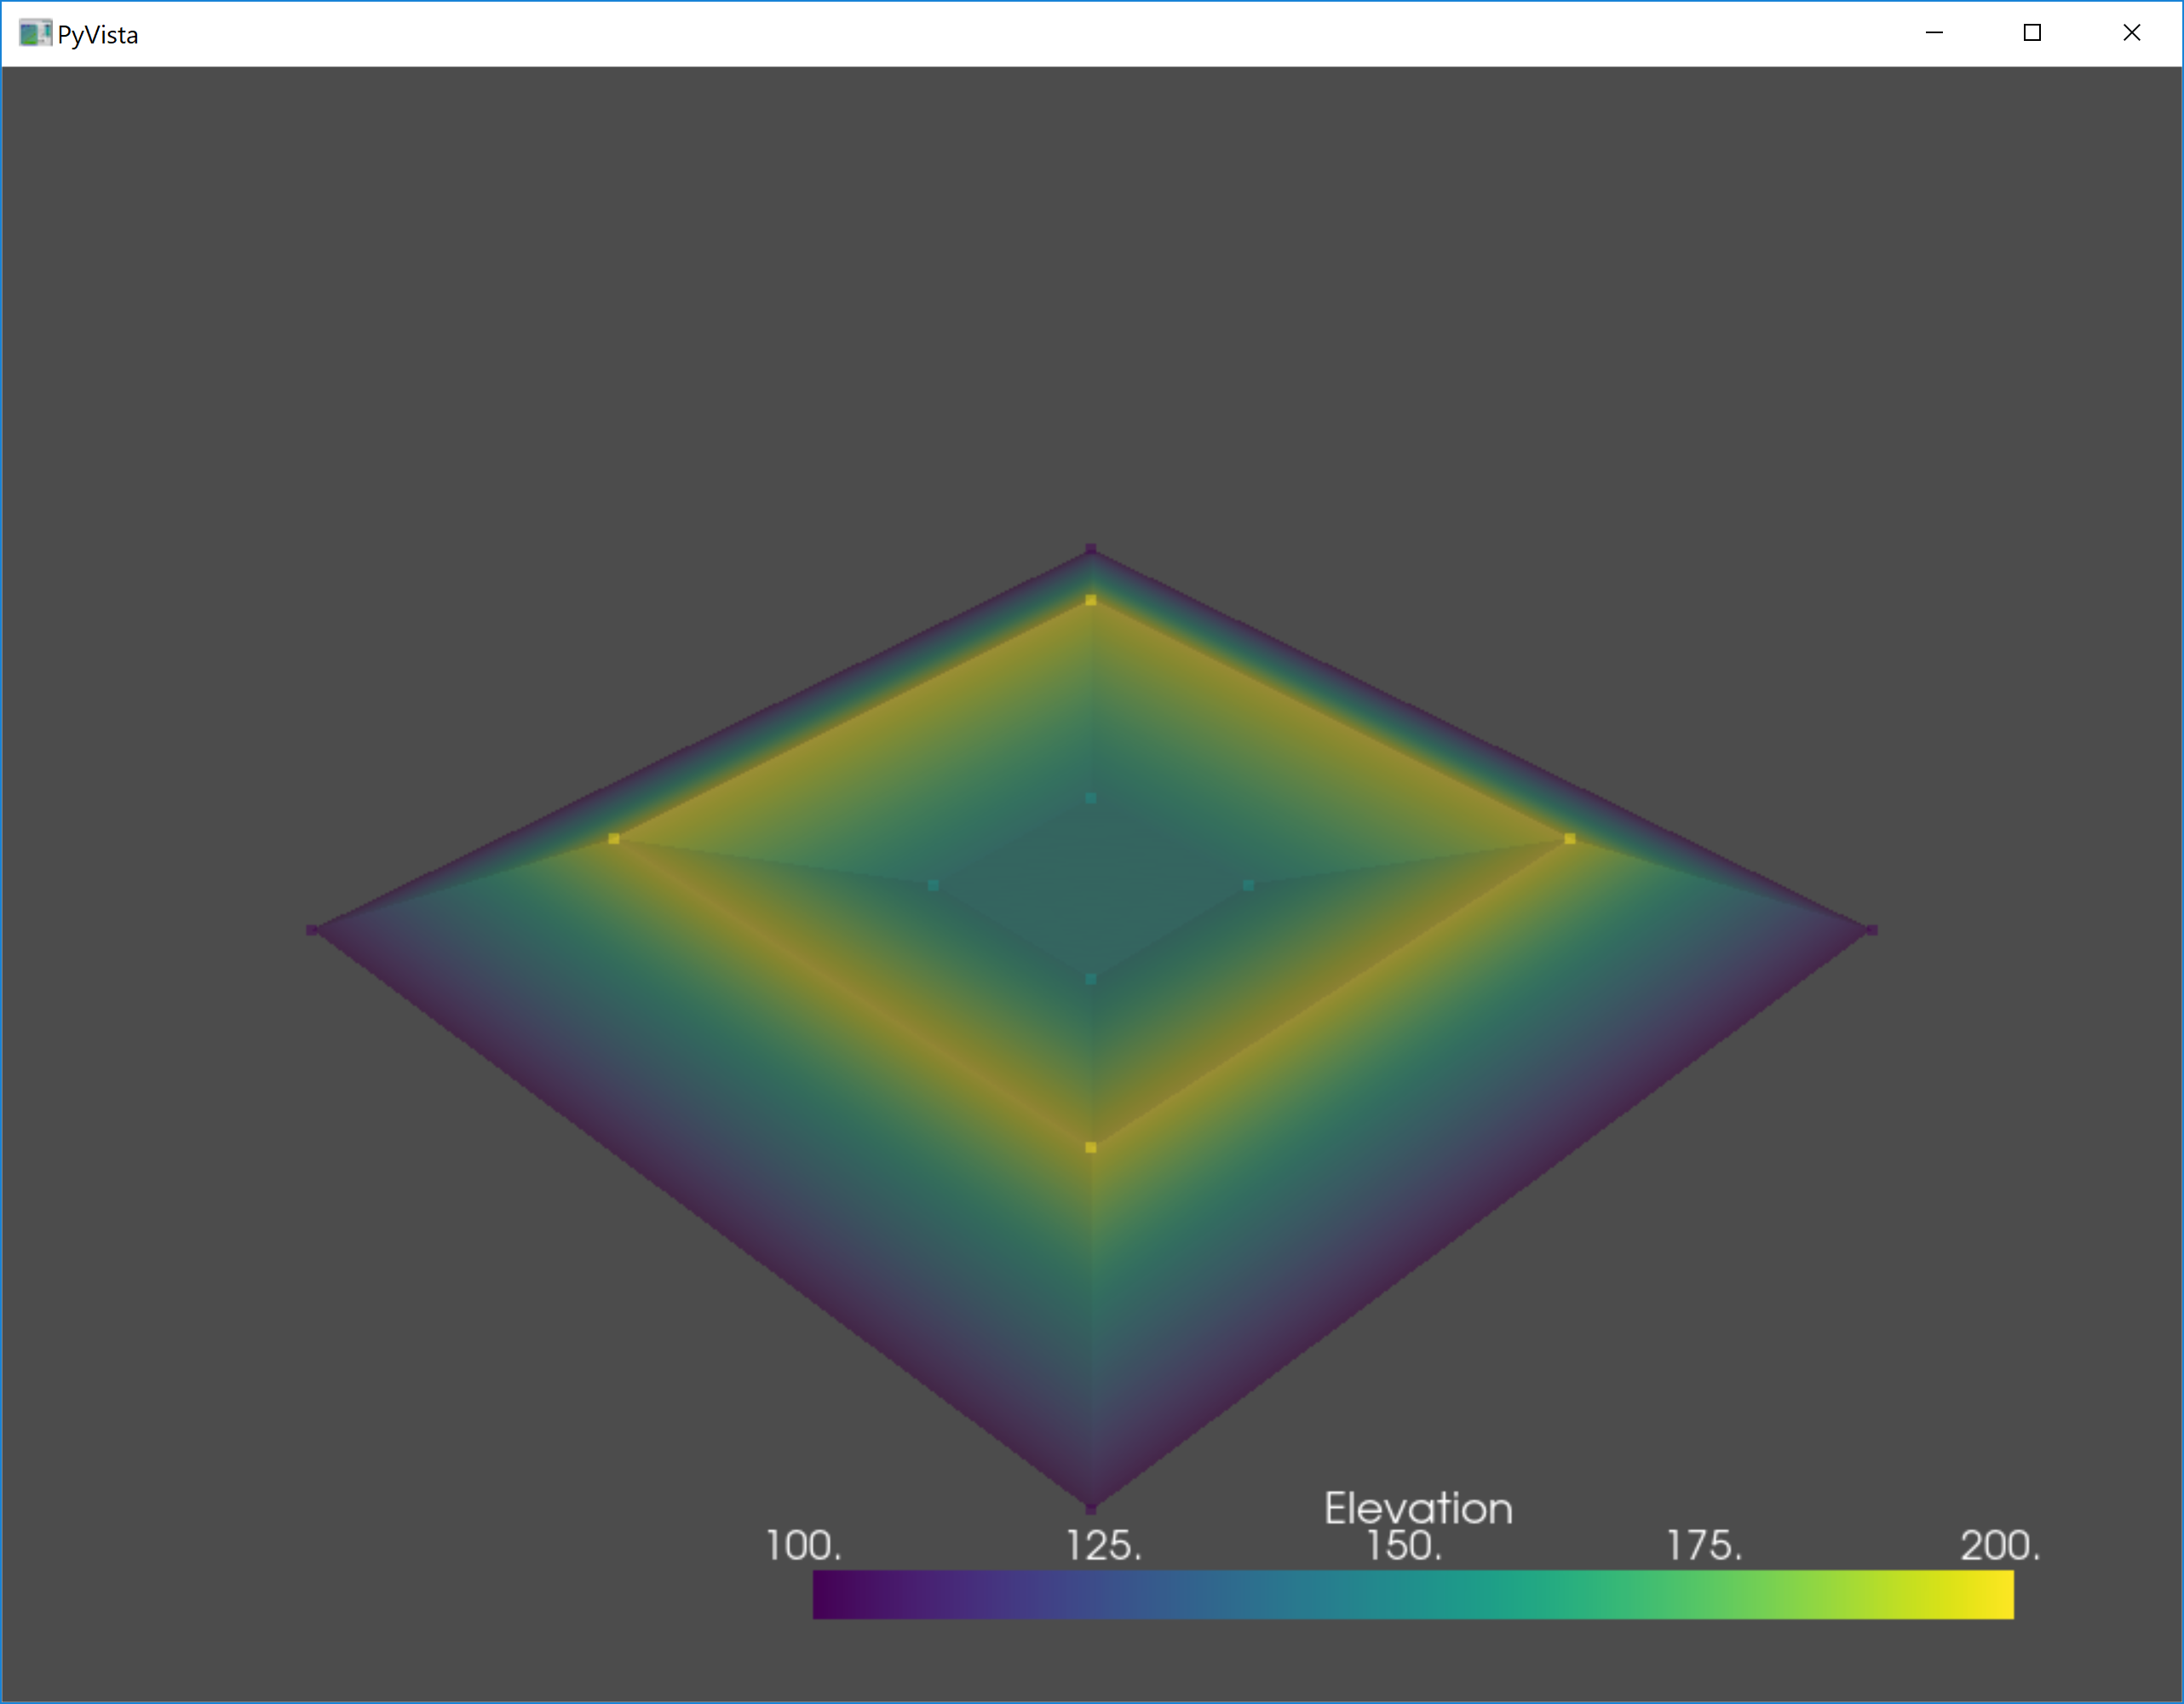
Input point data is usualy generated by traditional topography methods (toe and crest points). Those are best triangulated using Delaunay.
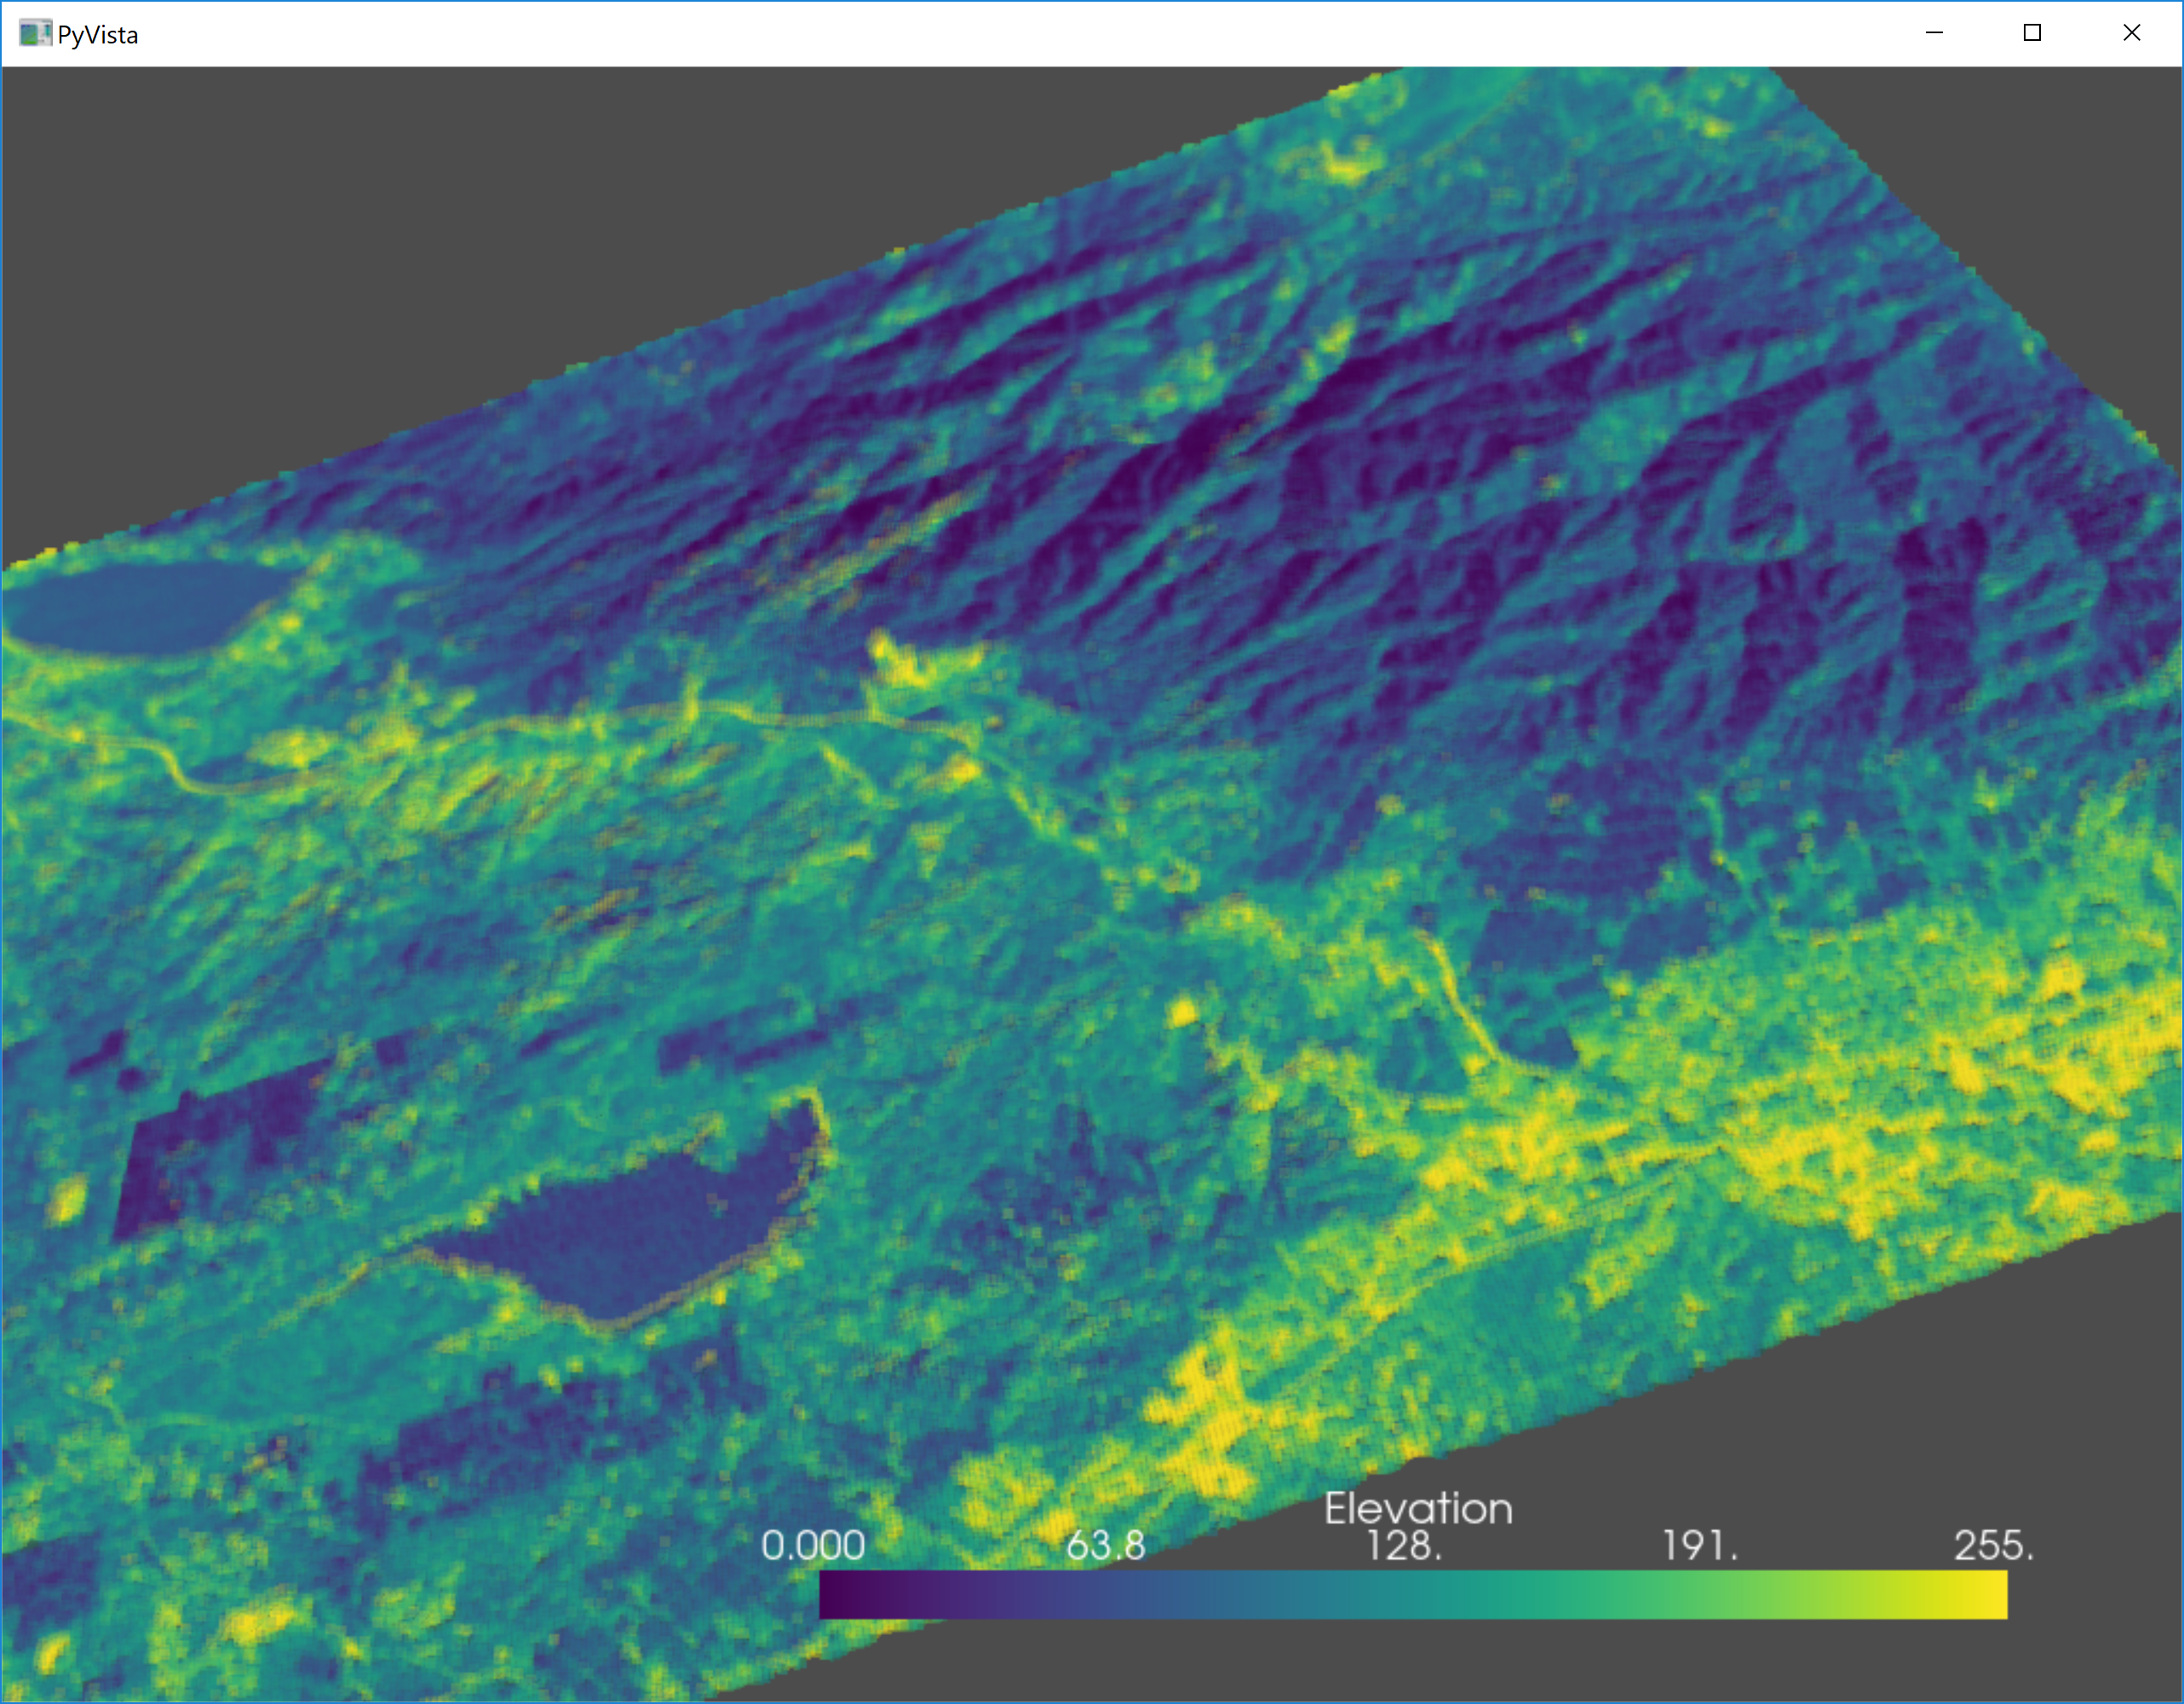
But also can be generated by LIDAR (Laser), Drones (optical or radar) and even satellites (multiple spectral channels including IR). Those generate very dense point clouds which require a method other than Delaunay to create usable surfaces. In this cases "grid" is the recomended method.
The grid method uses a voxel approach where the space is divided in cells and a single elevation value is estimated for each. If multiple points fall inside the cell, they will be aggregated into a single value. Uses the sklearn KNeighborsRegressor for the regression.
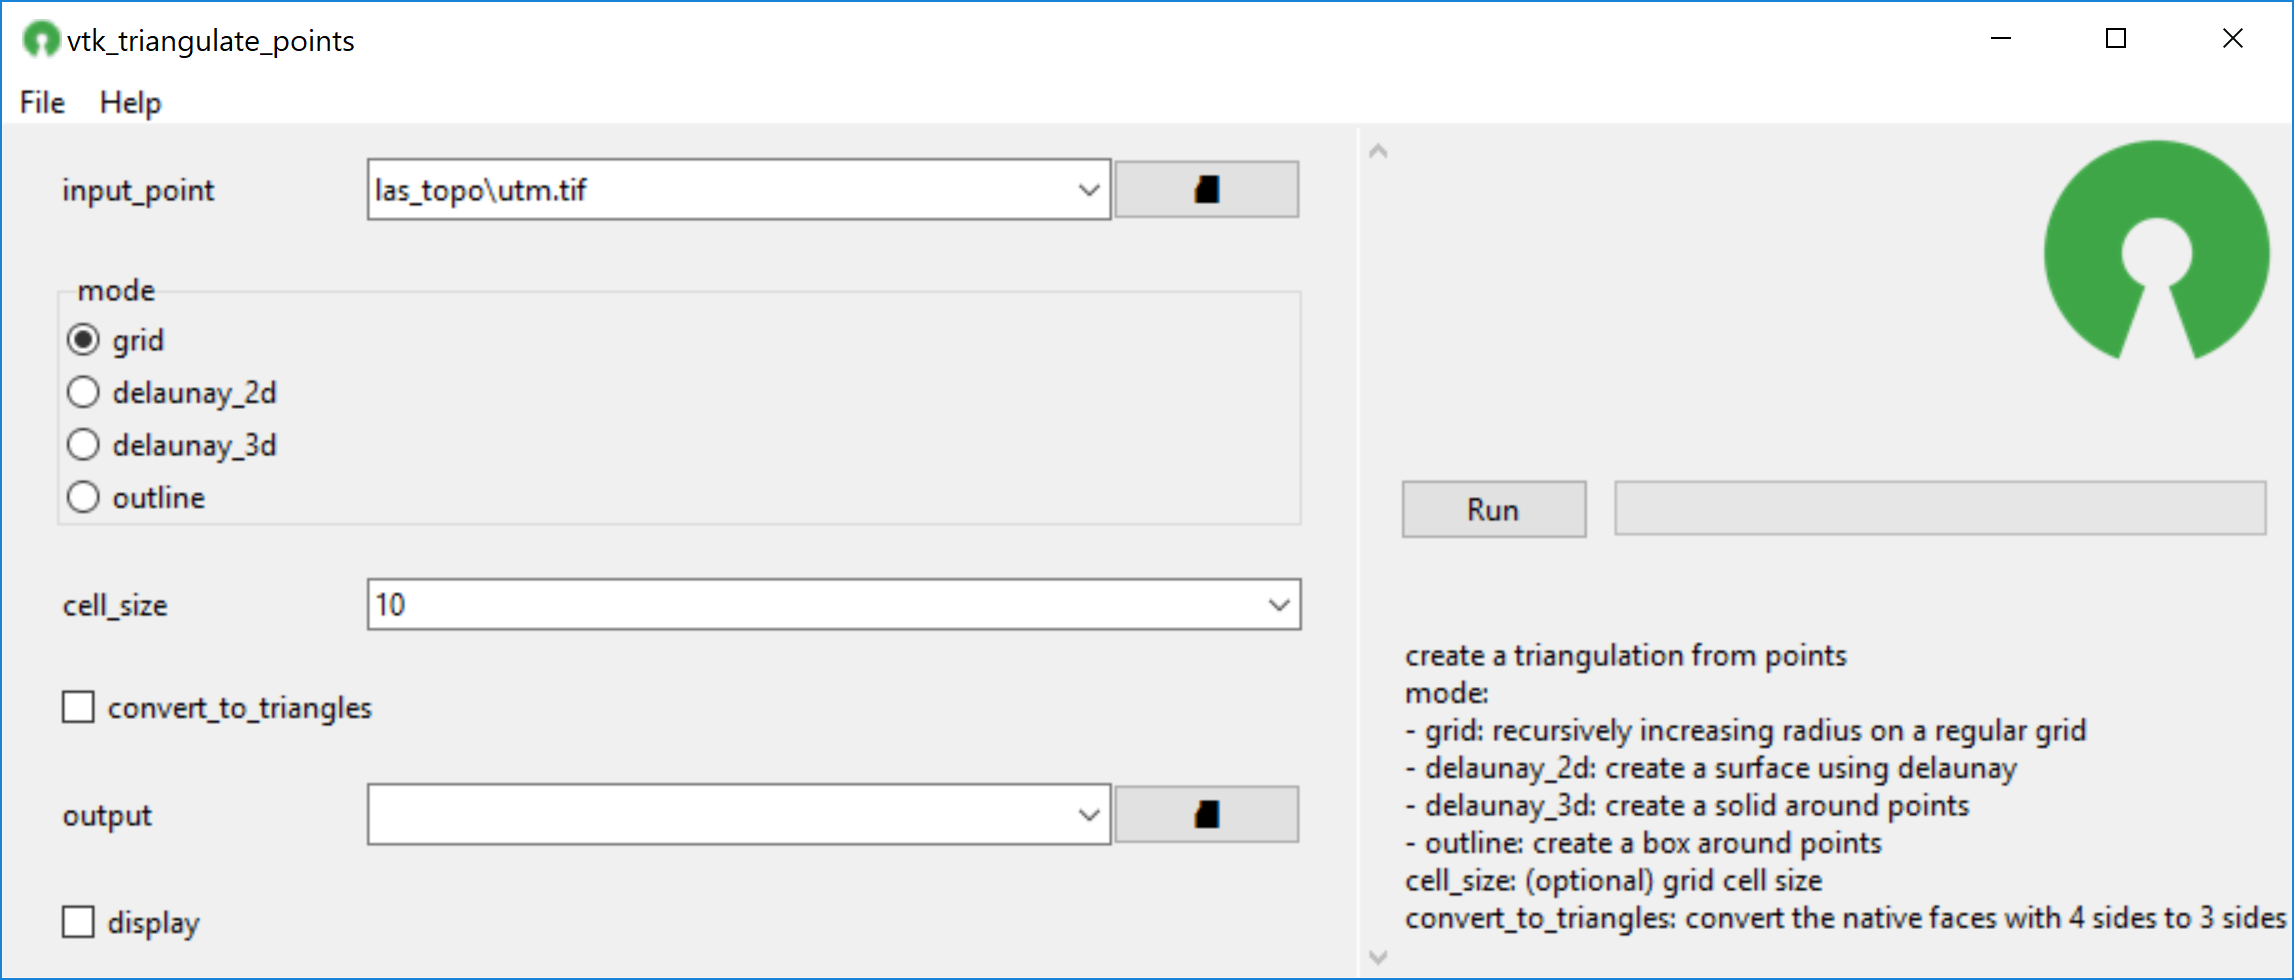
Download all files and run vtk_triangulate_points.py in your python enviroment of choice. The graphic interface should appear.
Ex.:
python vtk_triangulate_points.py
Python 3.5+ required. Recomended: WinPython64-3.8+ (https://winpython.github.io/)
The following modules are required:
- pandas
- sklearn
- pyvista
Of those only pyvista is not commonly present is most python distros.
- Multiple data file formats for input and output
- Built in renderer to display results in a interative 3d window
- Uses mature python libraries to do most tasks, nothing "new" to be mantained
- Can be run either by the included graphic user interface or using command line arguments
- Intermediary data is a pandas Dataframe so it can be easily extended/manipulated/exported/validated
- Grid: Useful for dense point clouds
- Delaunay 2d: Best for exact toe/crest data or small point clouds
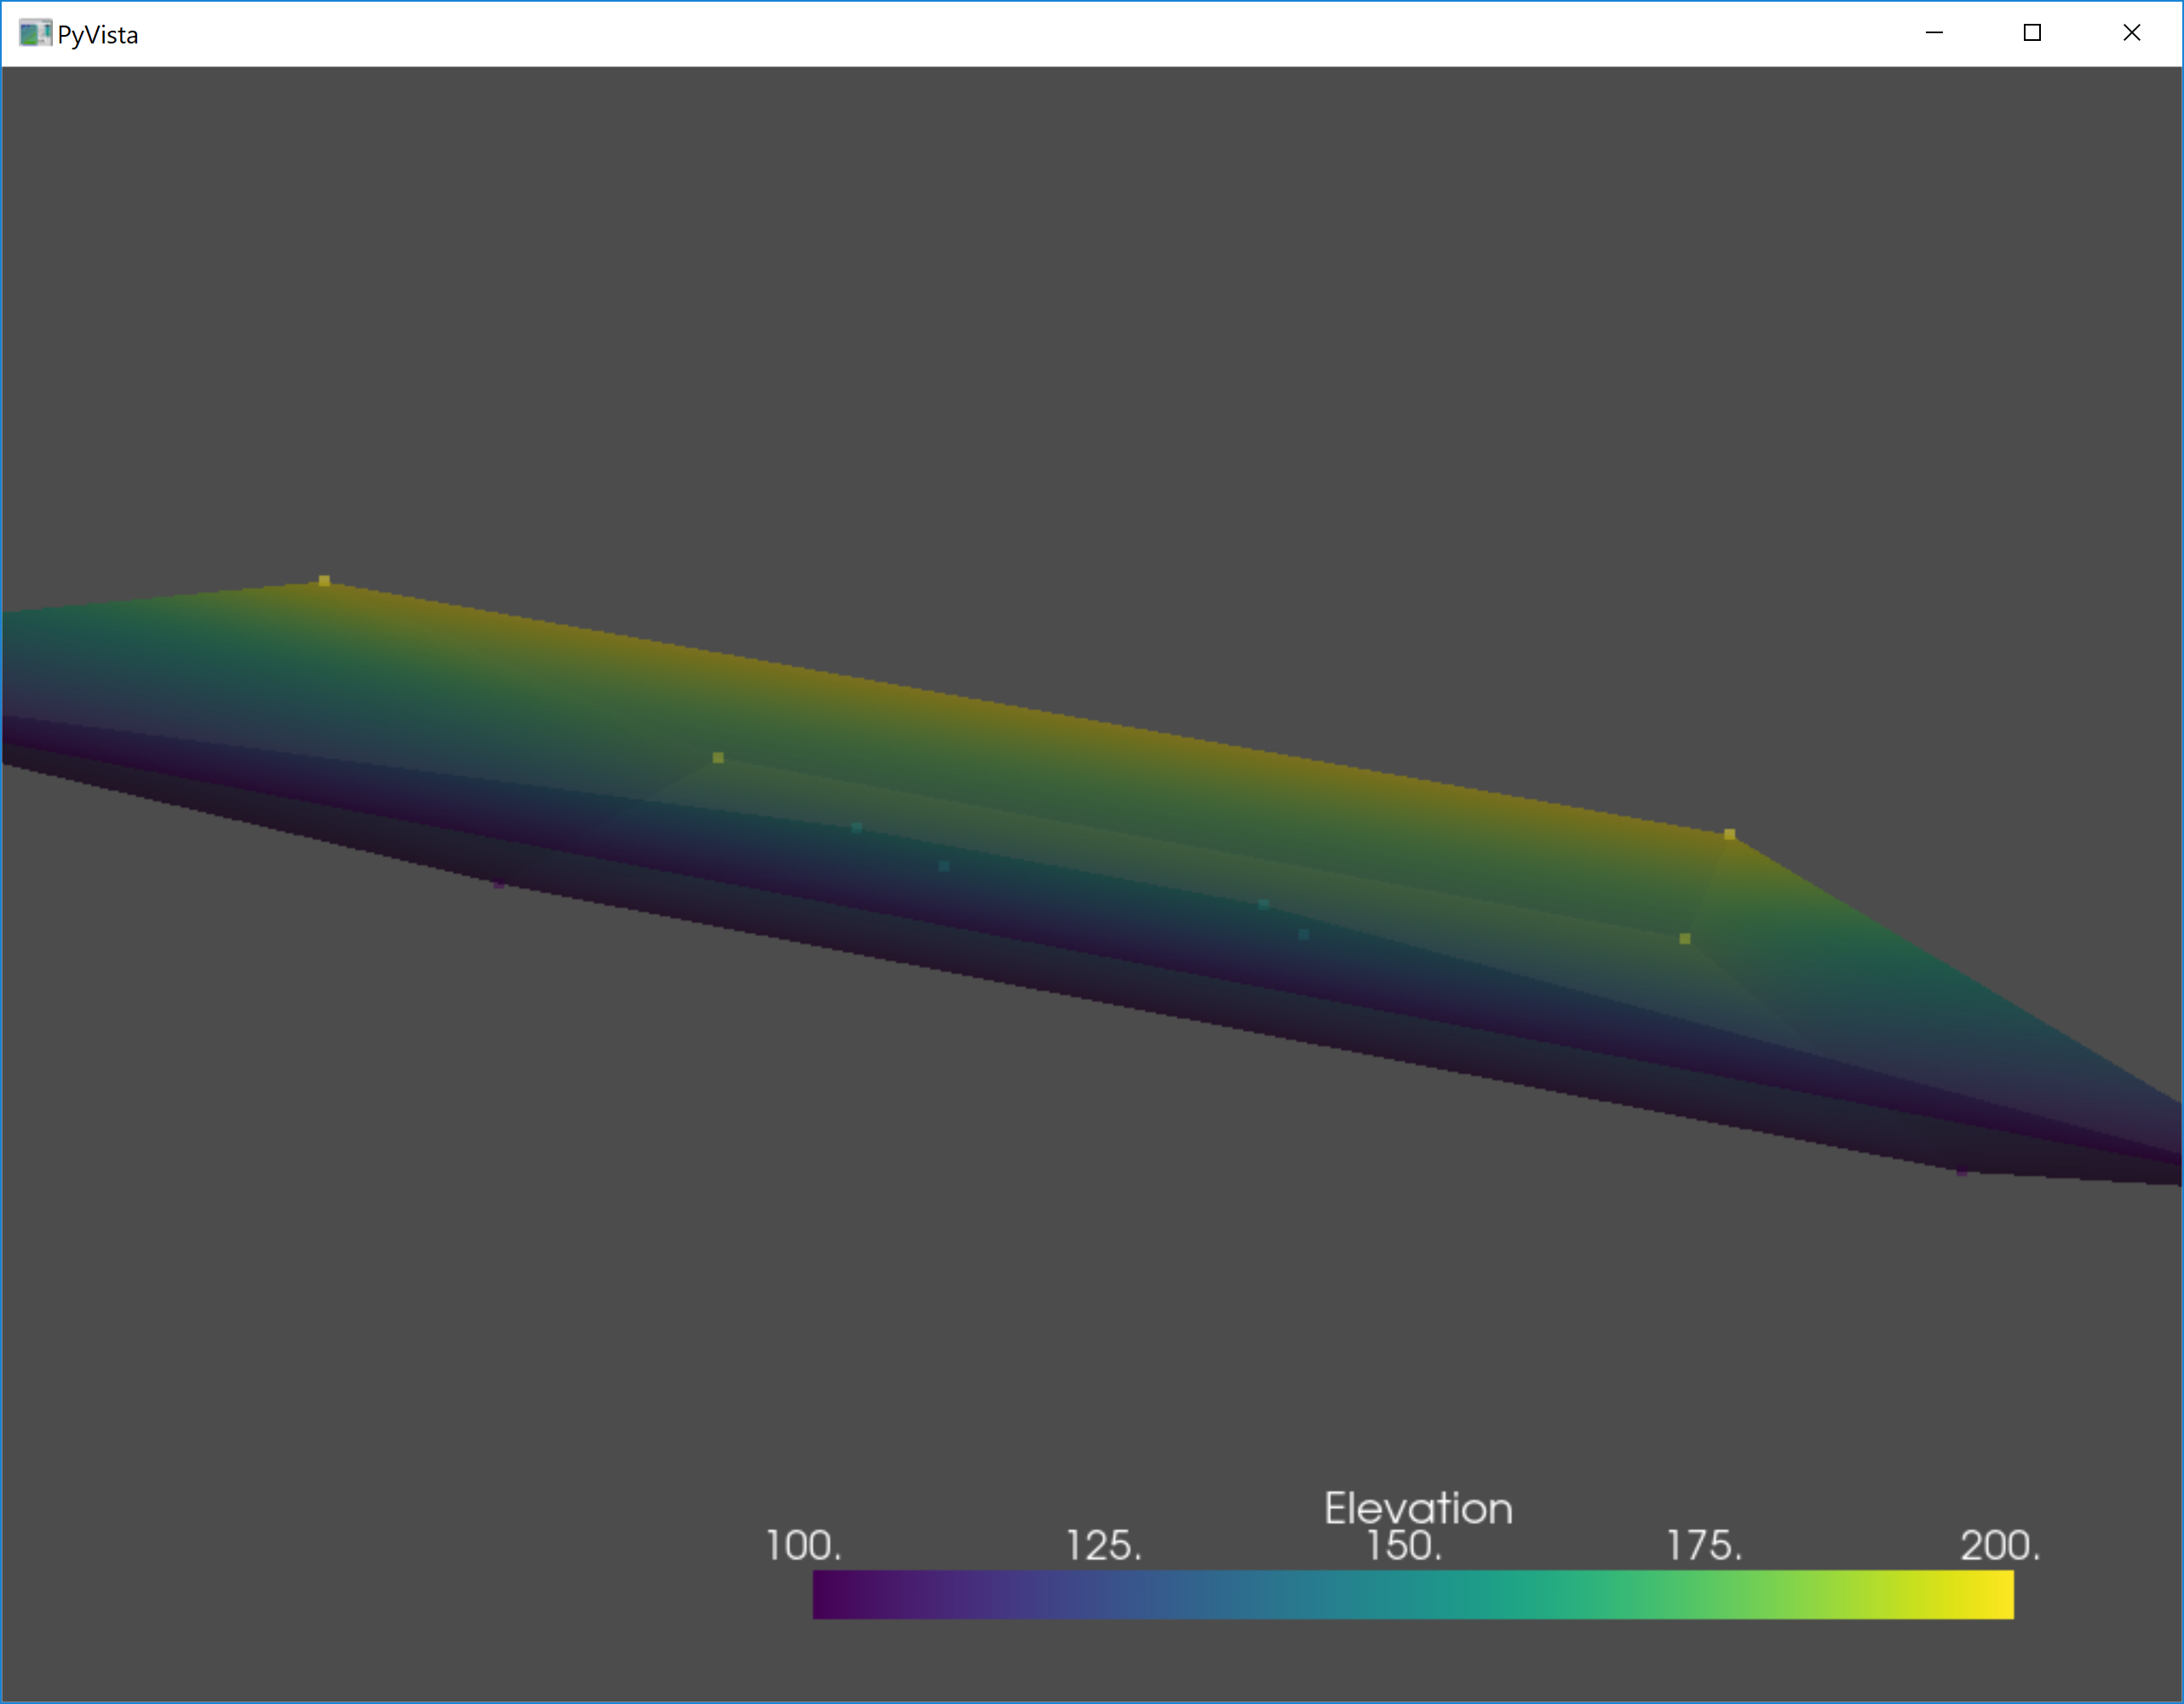
- Delaunay 3d: same as 2d, but create a solid instead of surface
- Outline: Create a simple visual bounding box. Useful to get a first look over the data extension when dealing with EXTREMELY large point clouds (Billions of points).
The script accepts multiple data file formats common in the Mining, Cartography and Topography industries:
- ASCII Csv structured data (*.csv)
- ESRI Shapefile (*.shp +)
- Autodesk DXF (*.dxf)
- Excel structured data (*.xlsx)
- VTK (*.vtk, *.vtm)
- Las Topography (*.las)
- Raster Geotiff (*.tif, *.tiff)
