PerfMark is a low-overhead, manually-instrumented, tracing library for Java. Users can add the tracing function calls to their code to see how long each part takes.
-
Very Low Overhead: When enabled, tracing a function call adds about 70ns. Tracing is done in a lock-free, wait-free, thread local buffer, which avoids interfering with your latency-sensitive code.
-
Dynamically Enabled: PerfMark can be enabled or disabled at runtime. When disabled, PerfMark has zero overhead, taking advantage of the JIT compiler to remove the tracing.
-
Inter-thread Communication: Existing profilers have difficulty expressing which thread wakes up and executes work on another thread. PerfMark allows users to express this relationship explicitly, making for a clear picture of how code flows.
-
Small Library Size: The PerfMark tracing API is only 7 KB in size, and has minimal dependencies making it easy to include in other projects. If no backend for recording the trace is present, the library safely disables itself.
-
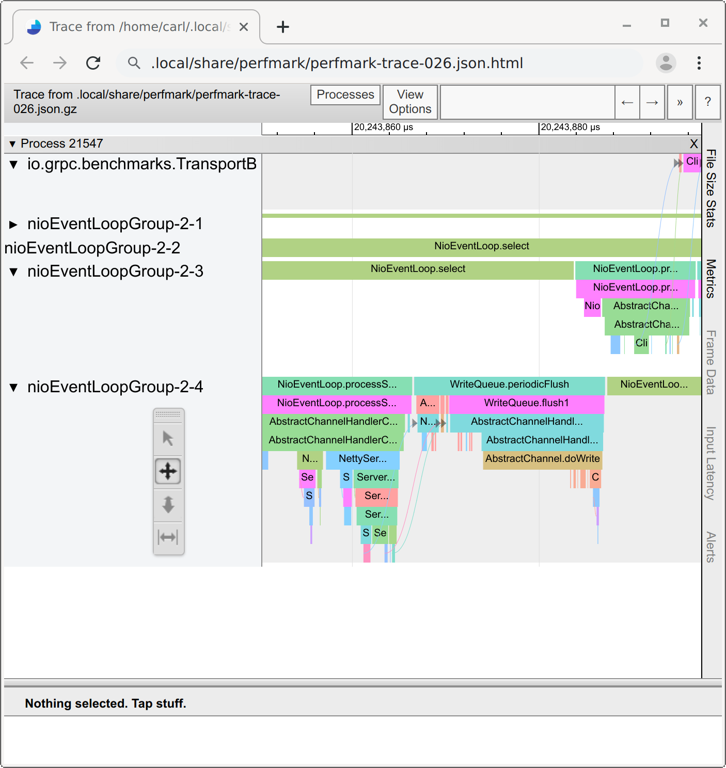
Chrome Trace Viewer Integration: PerfMark can export to the Chrome Trace Event Format, making it easy to view in your Web Browser.
To use PerfMark, add the following dependencies to your build.gradle:
dependencies {
    implementation 'io.perfmark:perfmark-api:0.27.0'
    // Only needed for applications, not libraries.
    implementation 'io.perfmark:perfmark-traceviewer:0.27.0'
}
Or in your pom.xml:
    <dependency>
      <groupId>io.perfmark</groupId>
      <artifactId>perfmark-api</artifactId>
      <version>0.27.0</version>
    </dependency>
In your code, add the PerfMark tracing calls like so:
Map<String, Header> parseHeaders(List<String> rawHeaders) {
  try (TaskCloseable task = PerfMark.traceTask("Parse HTTP headers")) {
    Map<String, String> headers = new HashMap<>();
    for (String rawHeader : rawHeaders) {
      Header header = parseHeader(rawHeader);
      headers.put(header.name(), header);
    }
    return headers;
  }
}
PerfMark can also be used to record asynchronous work:
Future<Response> buildResponse() {
  try (TaskCloseable task = PerfMark.traceTask("Build Response")) {
    Link link = PerfMark.linkOut();
    return executor.submit(() -> {
      try (TaskCloseable task2 = PerfMark.traceTask("Async Response")) {
        PerfMark.linkIn(link);
        return new Response(/* ... */);
      }
    });
  }
}
To view the traces in your browser, generate the HTML:
  PerfMark.setEnabled(true);
  PerfMark.event("My Task");
  TraceEventViewer.writeTraceHtml();
The output looks like:
PerfMark provides some System Properties that allow controlling how it initializes. These can be set
by providing them as JVM arguments. (e.g. -Dio.perfmark.PerfMark.startEnabled=true)
-
io.perfmark.PerfMark.startEnabledcontrols if PerfMark starts enabled. This boolean property makes it possible to start tracing calls immediately. This is helpful when it's difficult to invokesetEnabled()on PerfMark before task tracing calls have started. -
io.perfmark.PerfMark.debugcontrols if PerfMark can log initializing steps. This property exists to disable class loading of the logger package (currentlyjava.util.logging). If the debug property is set, the logger settings still need to be configured to report the logs. By default, all PerfMark logs use levelFINE(SLF4JDEBUG) or lower, which means that they usually need additional setup to print.In addition to initialization, the debug property controls if other tracing failures can be logged. When calls involving deferred execution are used (e.g.
startTask(T, StringFunction<T>)), the String function provided may throw an exception. In these cases, the exception is silently ignored. This makes it easy to ensure the start/stop call parity is maintained. To view these failures, the debug property can be set to log such problems. As above, the PerfMark logger should be configured as well to report these.
PerfMark uses Semantic Versioning, and thus will not break existing APIs within a minor version update. PerfMark may need to disable some functionality, and thus may need to make some tracing calls become No-ops. In such cases, it will remain safe to call these functions being recorded.
PerfMark was designed originally for gRPC. It is also used by Zuul.

