This document gives an introduction to pcp2pdf
The main goal of pcp2pdf is to create a visually pleasing report of a
Performance Co-Pilot archive file. PCP archive files
contain a bunch of metrics of a system and are usually created by the
pmlogger service, which is part of Performance Co-Pilot.
pcp2pdf is a python program and makes use of these 3rd party modules:
If you're using Fedora, you can use the packages found mbaldessari/pcp2pdf COPR repo. Just launch:
dnf copr enable mbaldessari/pcp2pdf
dnf install pcp2pdf
Otherwise just use the following:
python3 ./setup.py install
pcp2pdf --help
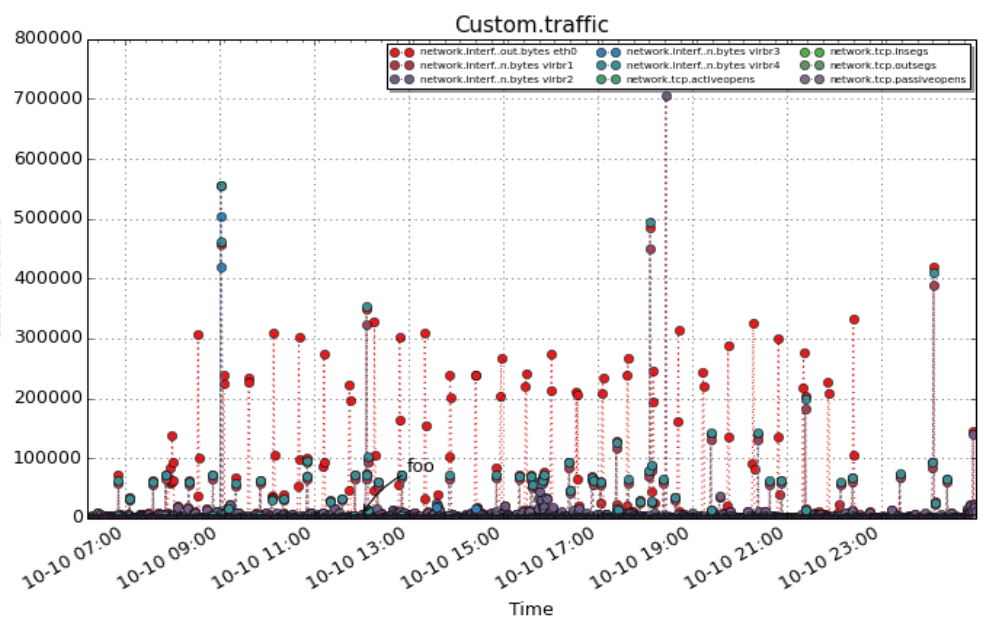
For example if we have a PCP archive and we would like to understand how the performance metrics behaved during the time interval from "Fri Oct 10 22:10" to "Sat Oct 11 01:00", and we would also like to see the following:
- How the eth0 TX patch behaved in correlation to the TCP statistics
- How the eth0 RX and TX behaved
- A label on the graph at 23:00 on Friday when users told us things are "slow"
- Lower DPI quality (75)
For example:
pcp2pdf -S "Fri Oct 10 22:10:12.362 2014" -T "Sat Oct 11 01:00:00.00 2014" --dpi 75 \
    -t "14 minute" -c "traffic:network.interface.out.bytes:eth0,network.tcp..*:.*" \
    -c "in_out:network.interface.out.bytes:eth0,network.interface.in.bytes:eth0" \
    -l 'slow:2014-10-10 23:00:00' -a pcparchivedir/20141010
Here is a sample pdf report
By default pcp2pdf uses a DPI value of 200. While this gives
high-quality looking graphs it takes quite a bit of memory and CPU time.
It is possible to reduce both RAM and CPU usage by setting a smaller DPI
value in pcp2pdf.conf or with the --dpi switch.
Note that pcp2pdf is SMP aware and will use all the CPUs to render
the graphs.
Feel free to report any issues here
