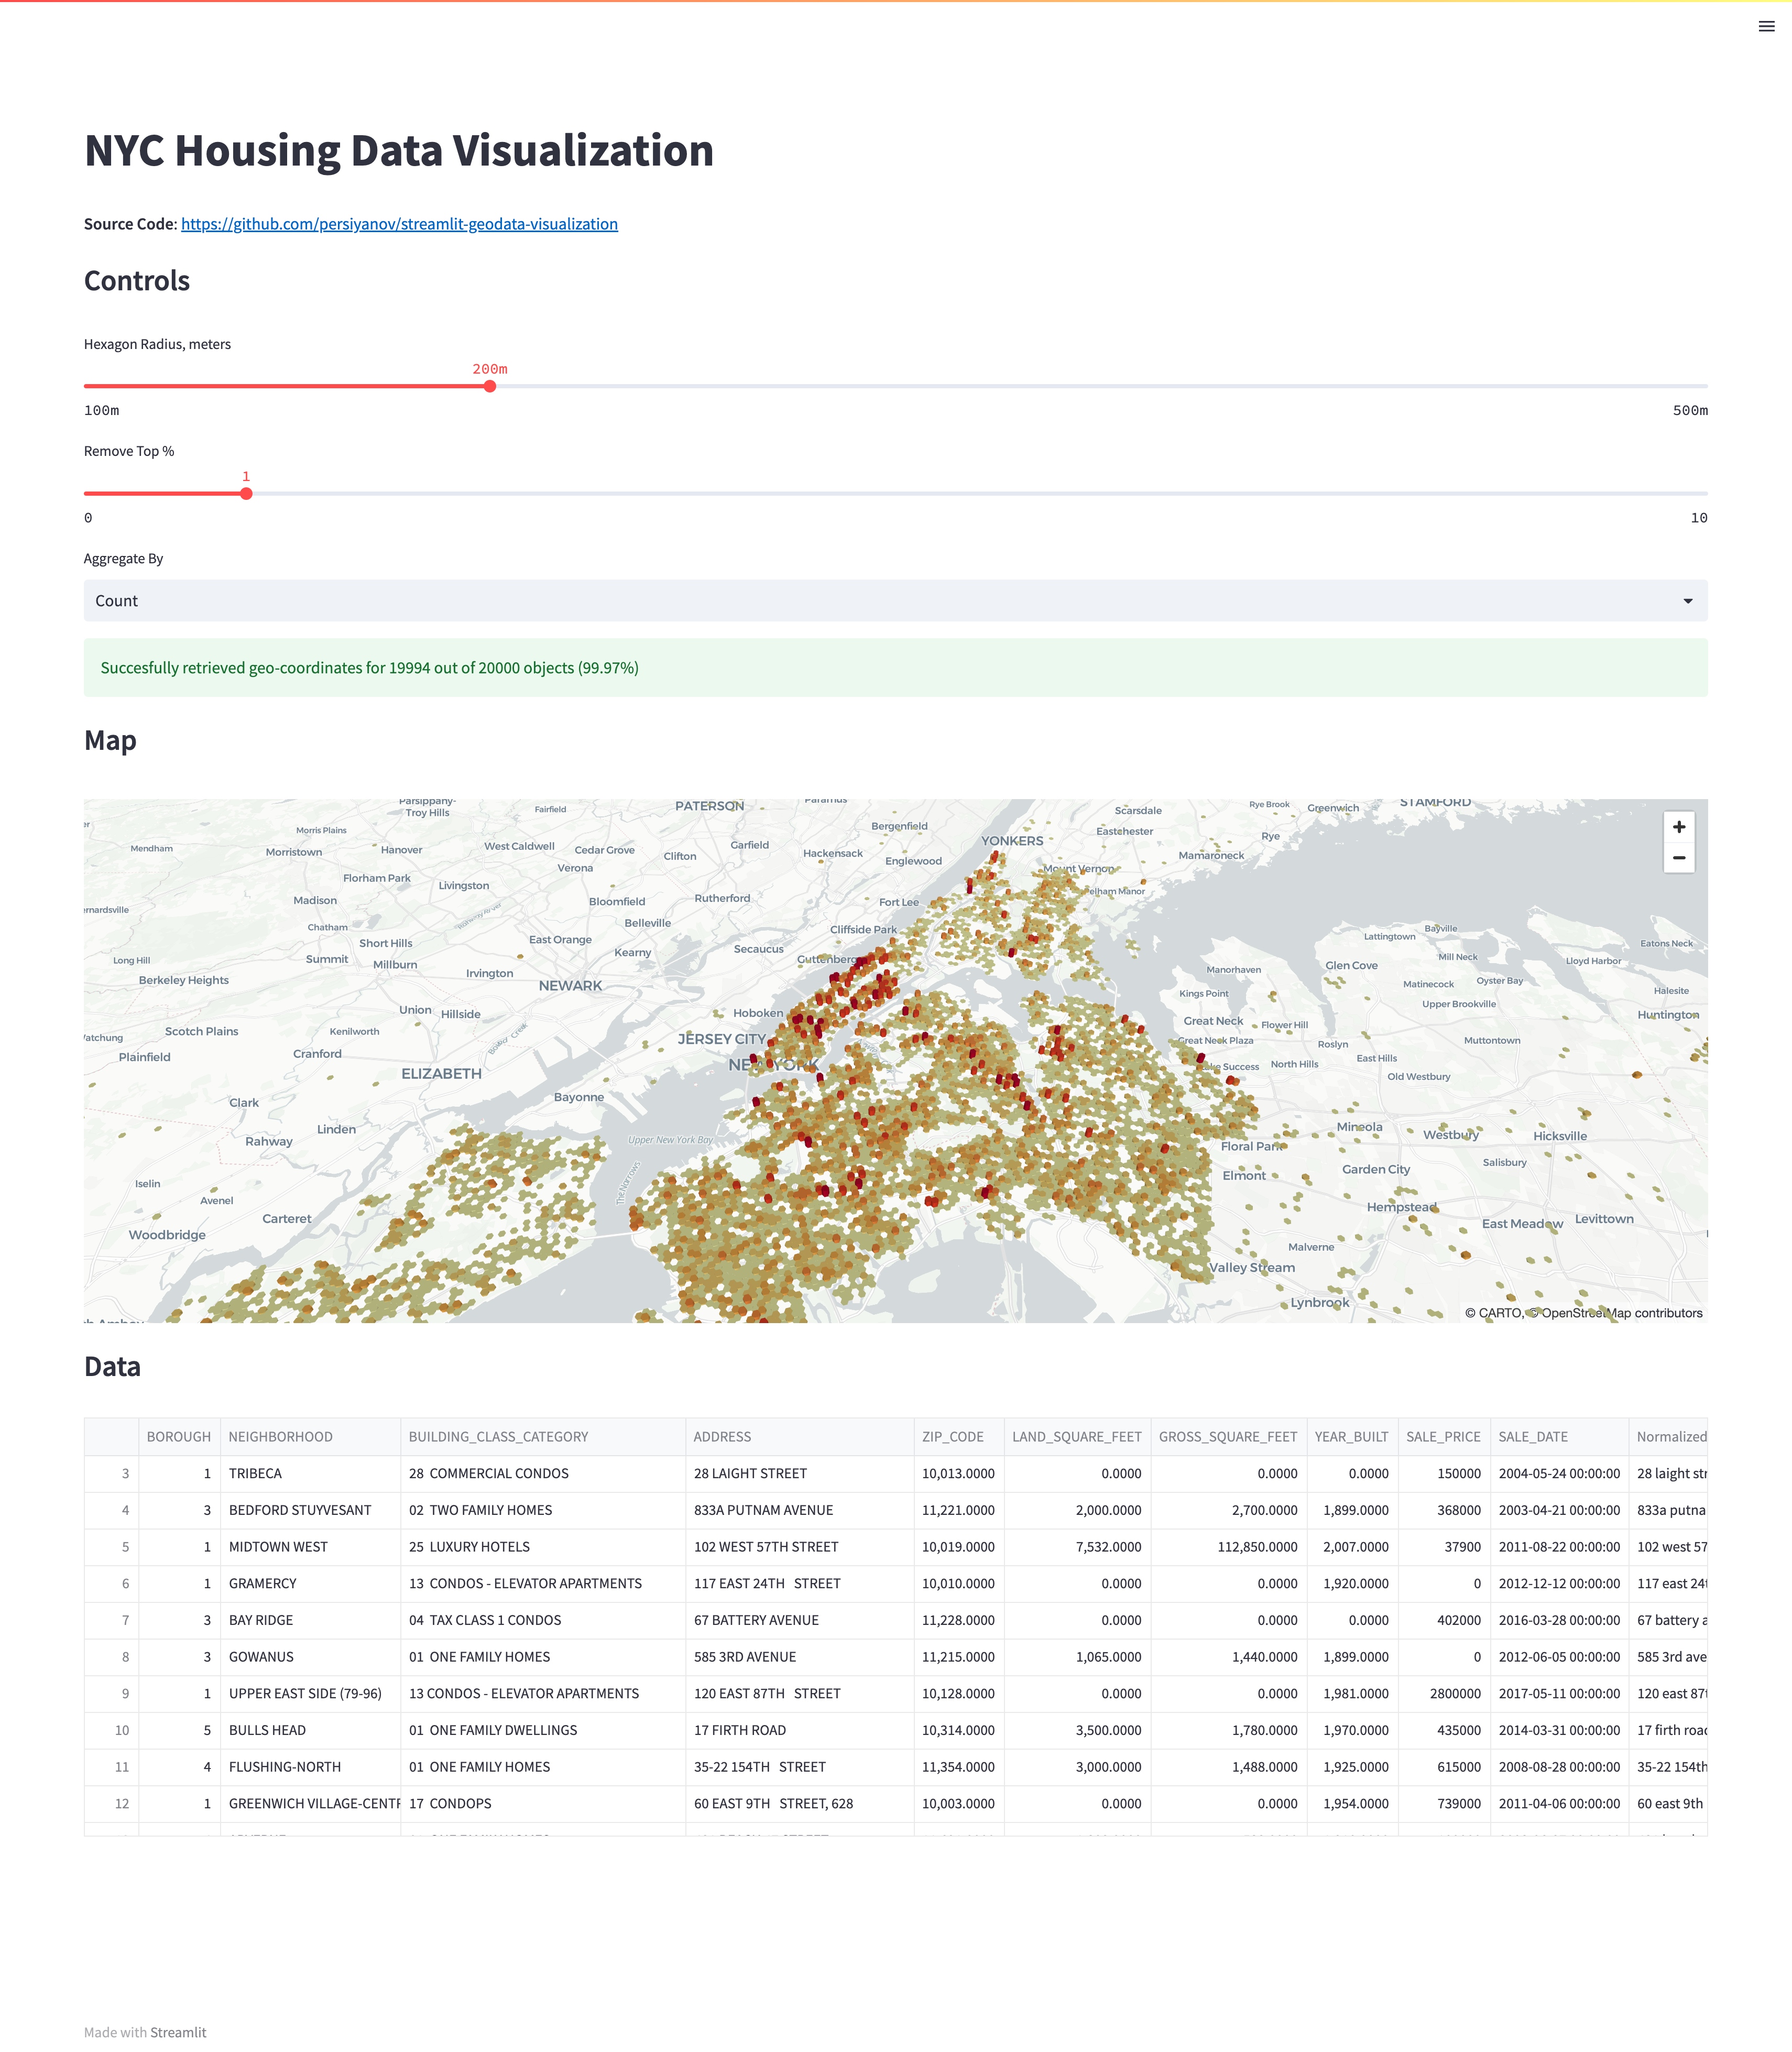
Available here: https://streamlit-geodata-visualization-jyiexkhtva-lm.a.run.app/
This repo is a demonstration of parsing geo-coordinates from address data using Mapbox.com and visualizing via awesome Streamlit library.
Repo consists of two parts:
- Geocoding of text addresses using Mapbox.com (see
scriptsfolder) - Visualization of geocoded data using Streamlit and its pydeck integration (
streamlit_app.py)
Dataset: NYC-Housing-Data-2003-2019
- Run
docker build -t geodata . - Run
docker run -it -p 80:80 geodata - Open http://127.0.0.1:80/
- Create virtual environment using your favorite tool (e.g. pyenv). I used Python 3.9.15 for development, but code should work for all 3.8+ versions.
- Run
pip install -r requirements.txt - Run
streamlit run streamlit_app.py
- Set up an account on Google Cloud Platform
- Install gcloud cli
- Run
gcloud run deploy(deployment via Cloud Run) - Note: make sure to reply
ywhen promptedAllow unauthenticated invocations to [streamlit-geodata-visualization] (y/N)?
