Code accompanying the manuscript "Climate model code genealogy and its relation to climate feedbacks and sensitivity"
This repository contains code to accompanying the manuscript Climate model code genealogy and its relation to climate feedbacks and sensitivity.
The code contains programs for calculating climate model averaging weights based on multiple choices of model "democracy":
variant: All model runs (here also called "variants") are equal.model: All models are equal.institute: All institutes are equal.country: All countries are equal.code(ancestry): Model weights are calculated based on a model code genealogy.
The programs are to be run on Linux or another unix-like operating system in the Bash shell.
System requirements:
- Python 3.9
- NetCDF4 (tested with 4.7.4)
On Debian-based Linux distributions, these can be installed with:
apt install python3 libnetcdf-devThe required Python packages are listed in requirements.txt and can be
installed with:
pip3 install -r requirements.txtInput files are stored in the input directory.
ar6_cmip5.csv: CMIP5 models table from IPCC AR6.ar6_cmip6.csv: CMIP6 models table from IPCC AR6.cmip5.tar.xz: CMIP5 temperature data.cmip6.tar.xz: CMIP6 temperature data.CMIP5_ECS_ERF_fbks.csv: CMIP5 feedback, forcing and ECS data from mzelinka/cmip56_forcing_feedback_ecs.CMIP5_ECS_ERF_fbks.txt: The same as the above but in the original format.CMIP6_ECS_ERF_fbks.csv: CMIP6 feedback, forcing and ECS data from mzelinka/cmip56_forcing_feedback_ecs.CMIP6_ECS_ERF_fbks.txt: The same as the above but in the original format.HadCRUT.5.0.1.0.analysis.summary_series.global.monthly.nc: HadCRUT global temperature data.models.csv: A CSV file containing a database of climate models and their code genealogy. A list of references can be found in the supplement.subset.csv: An example subset file listing models to calculate weights for.zelinka2021_table_S1.csv: Table S1 from Zelinka et al. (2021).zelinka2021_table_S2.csv: Table S2 from Zelinka et al. (2021).
Before using the scripts, the input files need to be prepared by unpacking
the archives cmip5.tar.xz and cmip6.tar.xz.
The directory img contains images:
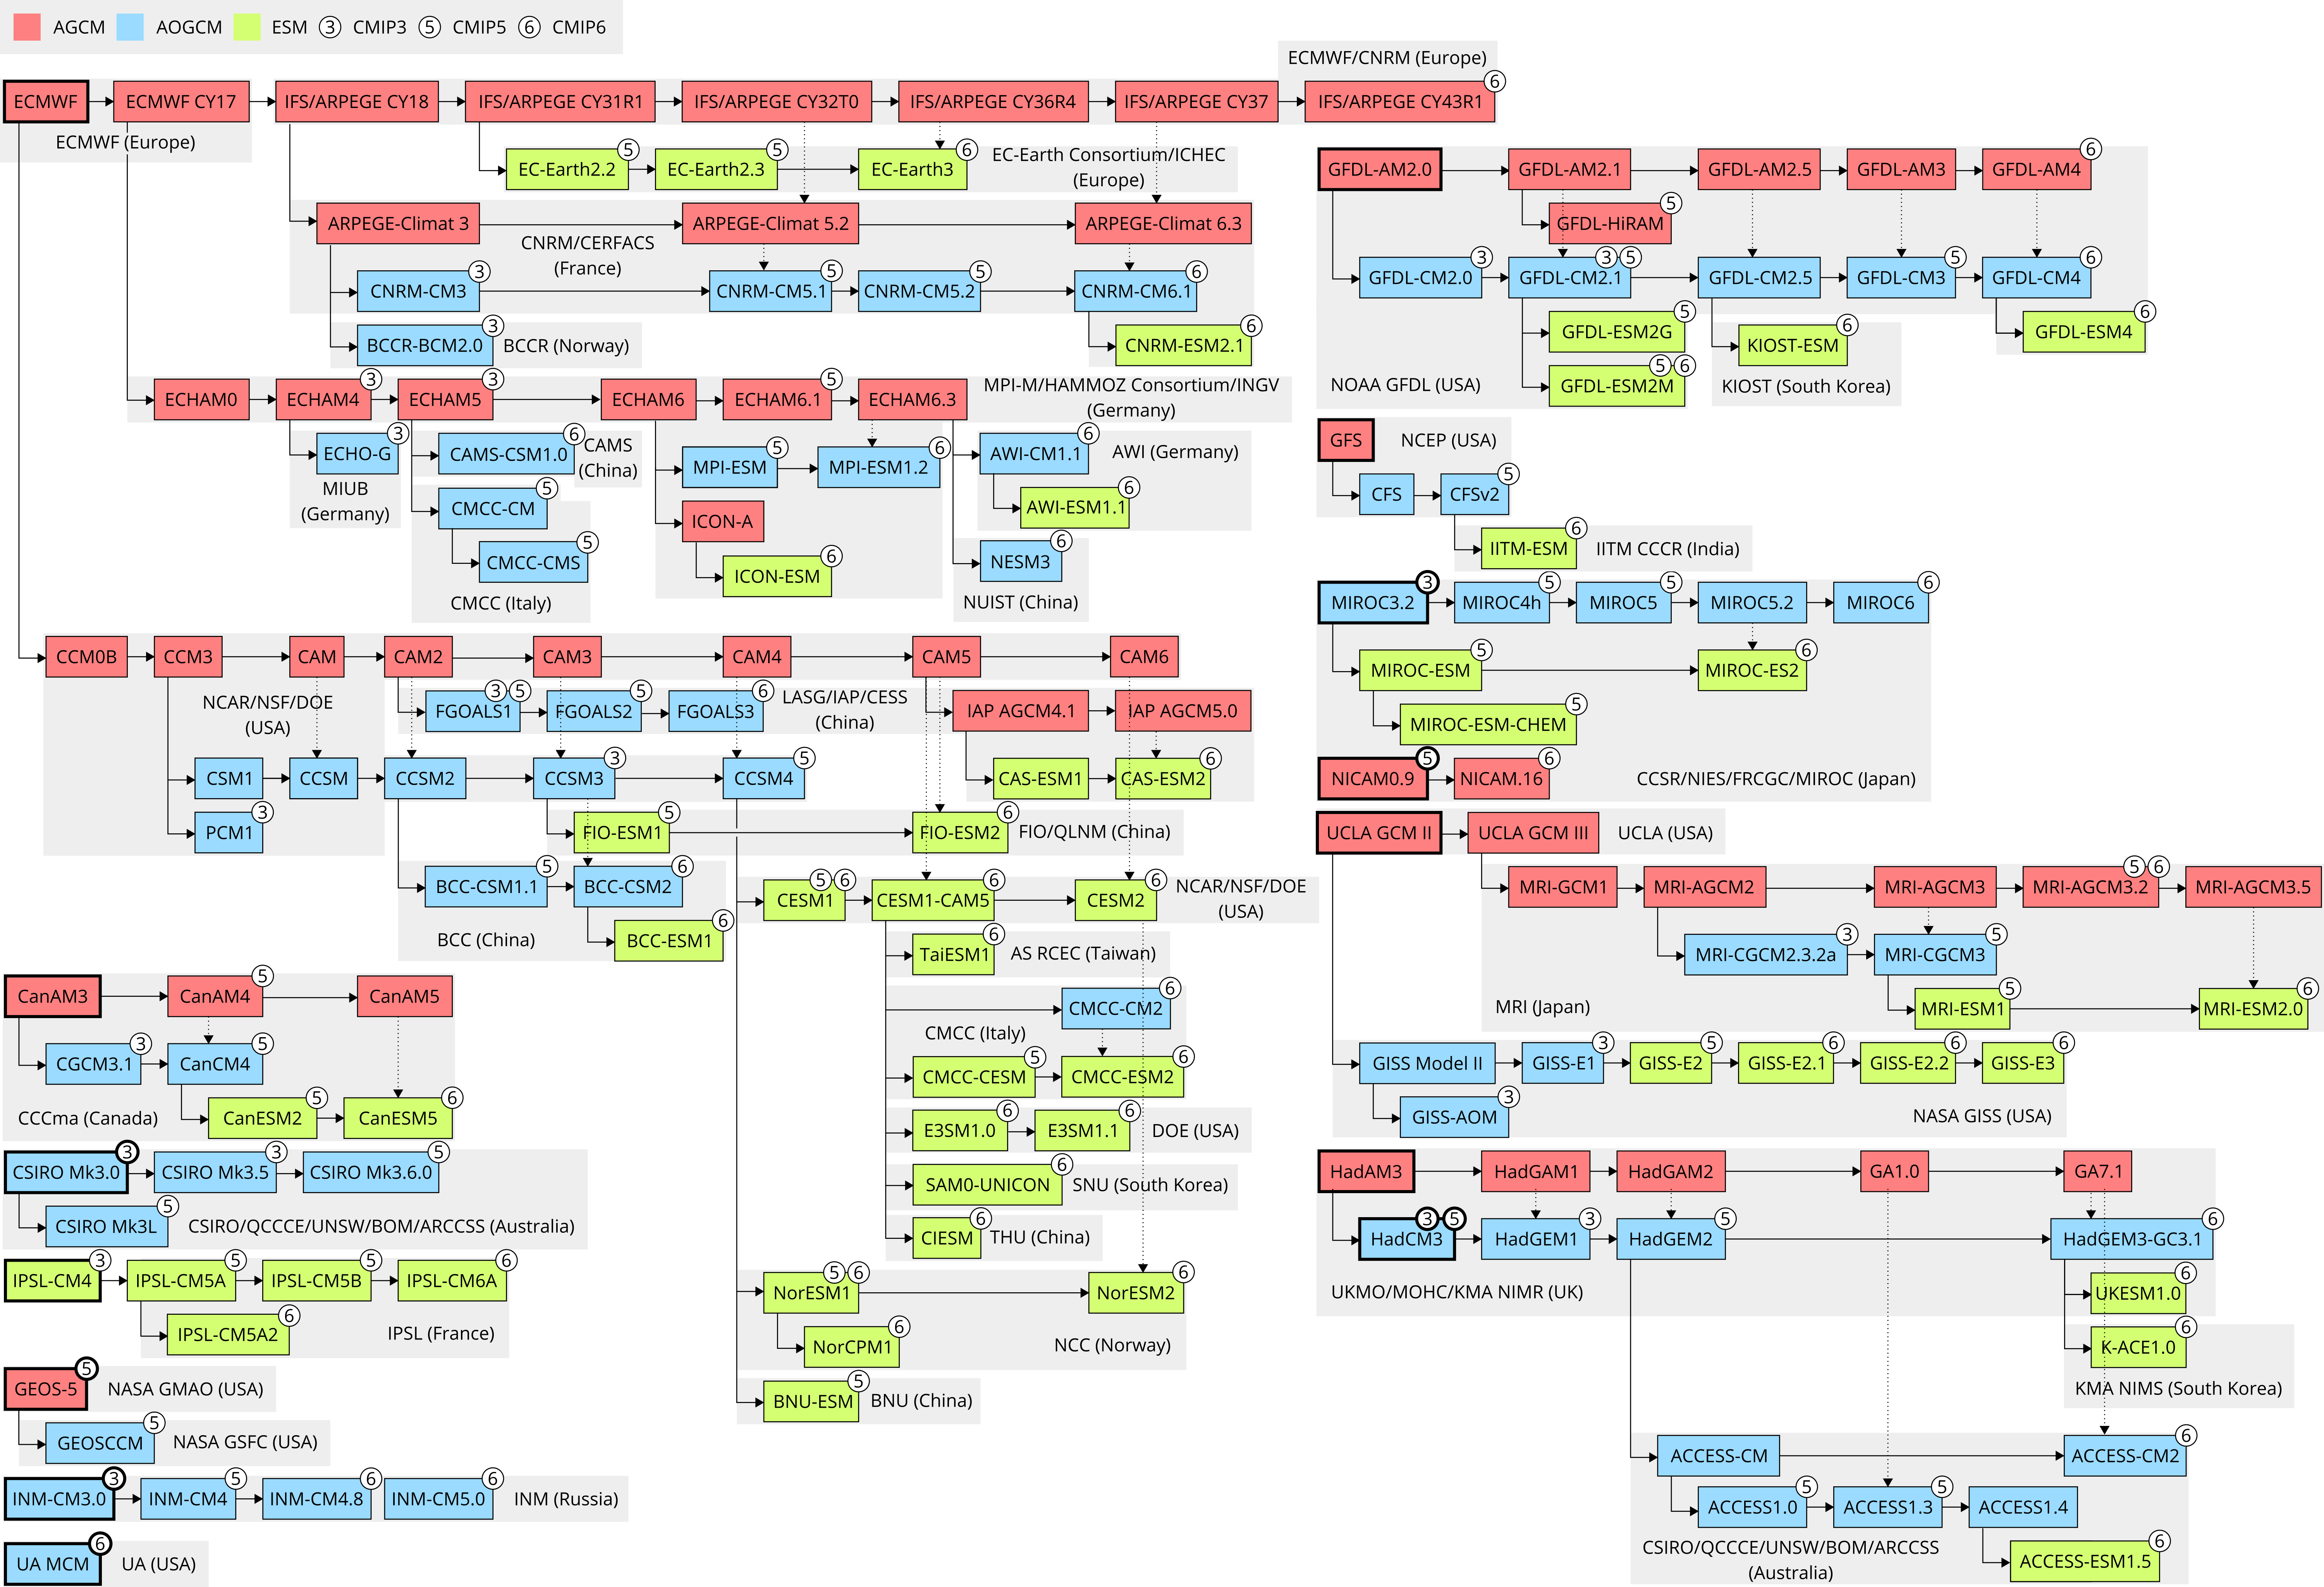
climate_model_code_genealogy.svg: A model code genealogy graph in plain SVG.climate_model_code_genealogy_inkscape.svg: The same as above, but this is the source file in Inkscape SVG.
Programs are stored in the bin directory.
Calculate statistical significance in feedback by group difference between the overall mean and the group mean.

Usage: calc_bayes INPUT OUTPUT

Arguments:

  INPUT   Input file. The output of plot_feedbacks_by_group (NetCDF).
  OUTPUT  Output file (NetCDF).

Examples:

bin/calc_bayes data/feedbacks_by_family_cmip5.nc data/feedbacks_by_family_cmip5_bayes.nc
bin/calc_bayes data/feedbacks_by_family_cmip6.nc data/feedbacks_by_family_cmip6_bayes.nc
Calculate model count by family, institute and country.

Usage: calc_model_count INPUT OUTPUT

Arguments:

  INPUT   Input file with models (CSV).
  OUTPUT  Output file (NetCDF).

Examples:

bin/calc_model_count input/models.csv data/model_count.nc
Calculate model statistics.

Usage: calc_model_stats INPUT MODELS

Arguments:

  INPUT   Input data (CSV). The table should contain a column "Model" identifying the model, and an arbitrary number of other columns to calculate statistics for.
  MODELS  Table of all models (CSV).

Examples:

bin/calc_model_stats input/zelinka2021_table_S1.csv input/models.csv > data/model_stats_zelinka2021_table_S1.csv
bin/calc_model_stats input/ar6_cmip5.csv input/models.csv > data/model_stats_ar6_cmip5.csv
bin/calc_model_stats input/ar6_cmip6.csv input/models.csv > data/model_stats_ar6_cmip6.csv
Calculate model weights based on code genealogy.

Usage: model_weights TYPE MODELS [SUBSET]

Arguments:

  TYPE    Type of "democracy". One of: "variant", "model", "institute", "country", "code", "family".
  MODELS  Table of all models (CSV).
  SUBSET  List of models to calculate weights for (CSV).

Files:

The models CSV file should be "models.csv", supplied with the code. The optional
subset CSV file should contains a single column "Model" with a list of models,
referring to a model or a variant in the "Model" or "CMIPx names" columns
of the models file, respectively.

Examples:

bin/model_weights code input/models.csv > data/model_weights_code.csv
bin/model_weights code input/models.csv input/subset.csv > data/model_weights_code_subset.csv
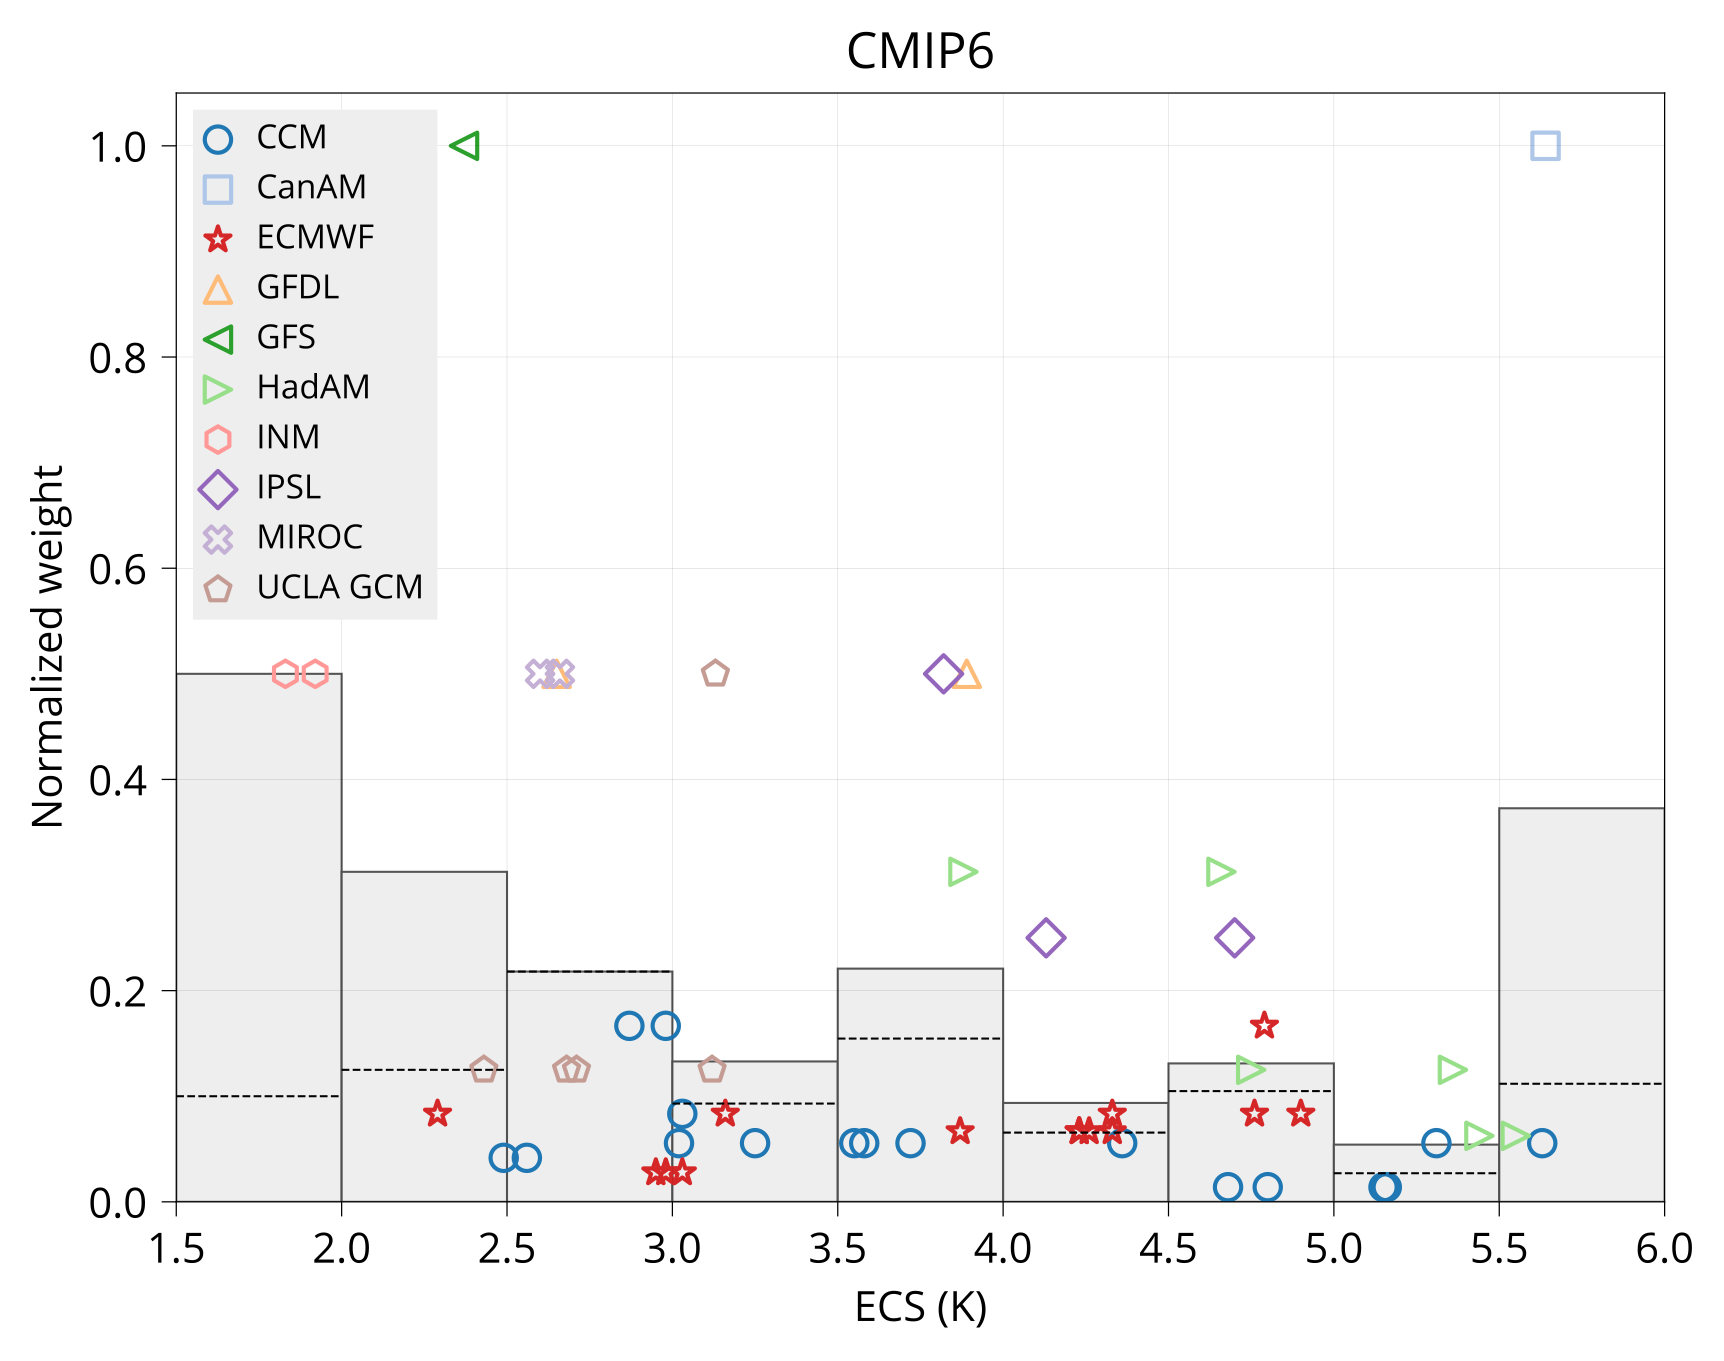
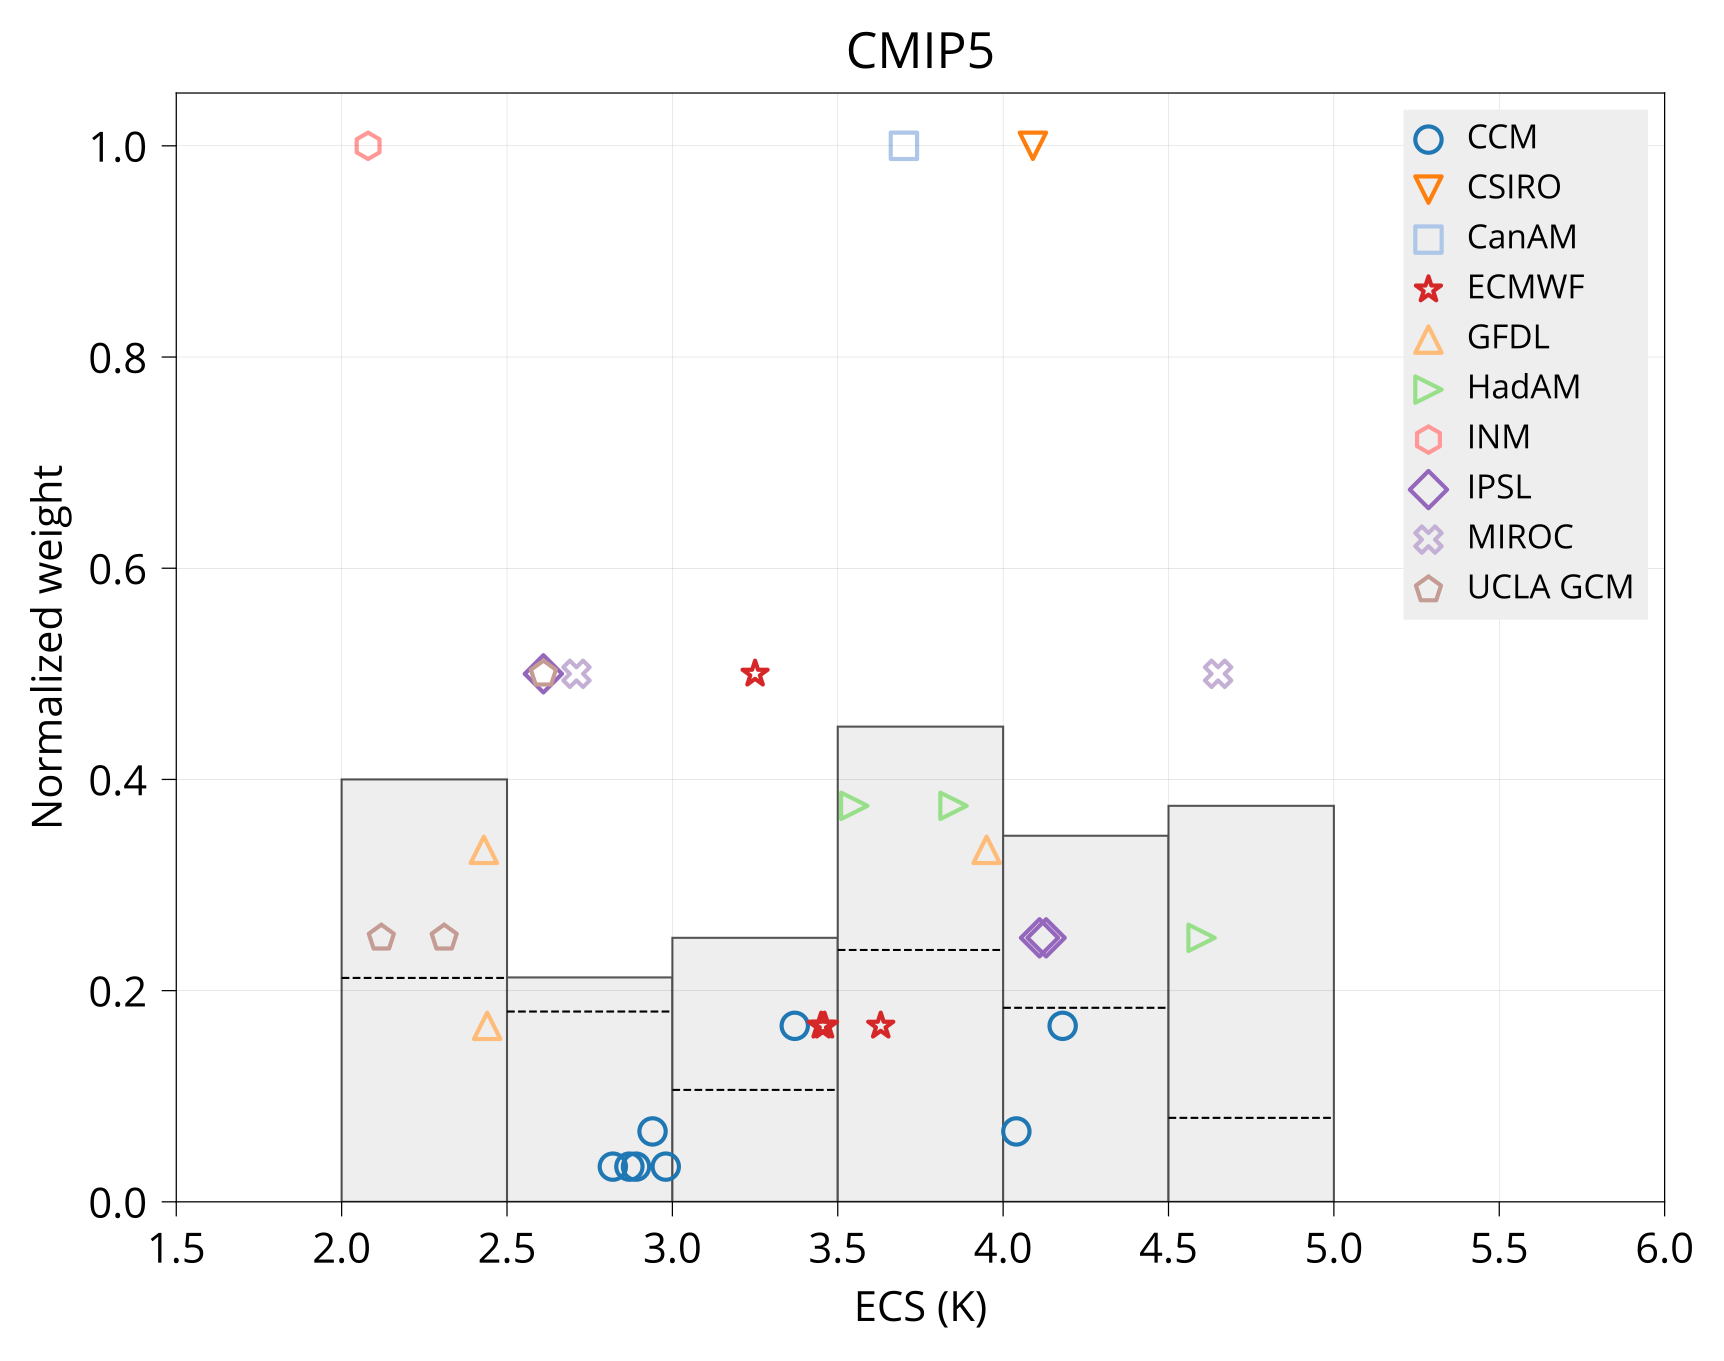
Plot variable-weight diagram.

Usage: plot_var_weight VAR MODELS INPUT OUTPUT TITLE

Arguments:

  VAR     Variable to plot on the x-axis.
  MODELS  Table of all models (CSV).
  CMIP    Input data (CSV). The table should contain a column "Model" identifying the model, and columns for variables.
  OUTPUT  Output plot (PDF).
  TITLE   Plot title.

Examples:

bin/plot_var_weight ECS input/models.csv input/CMIP5_ECS_ERF_fbks.csv plot/ecs_weight_cmip5.pdf CMIP5
bin/plot_var_weight ECS input/models.csv input/CMIP6_ECS_ERF_fbks.csv plot/ecs_weight_cmip6.pdf CMIP6
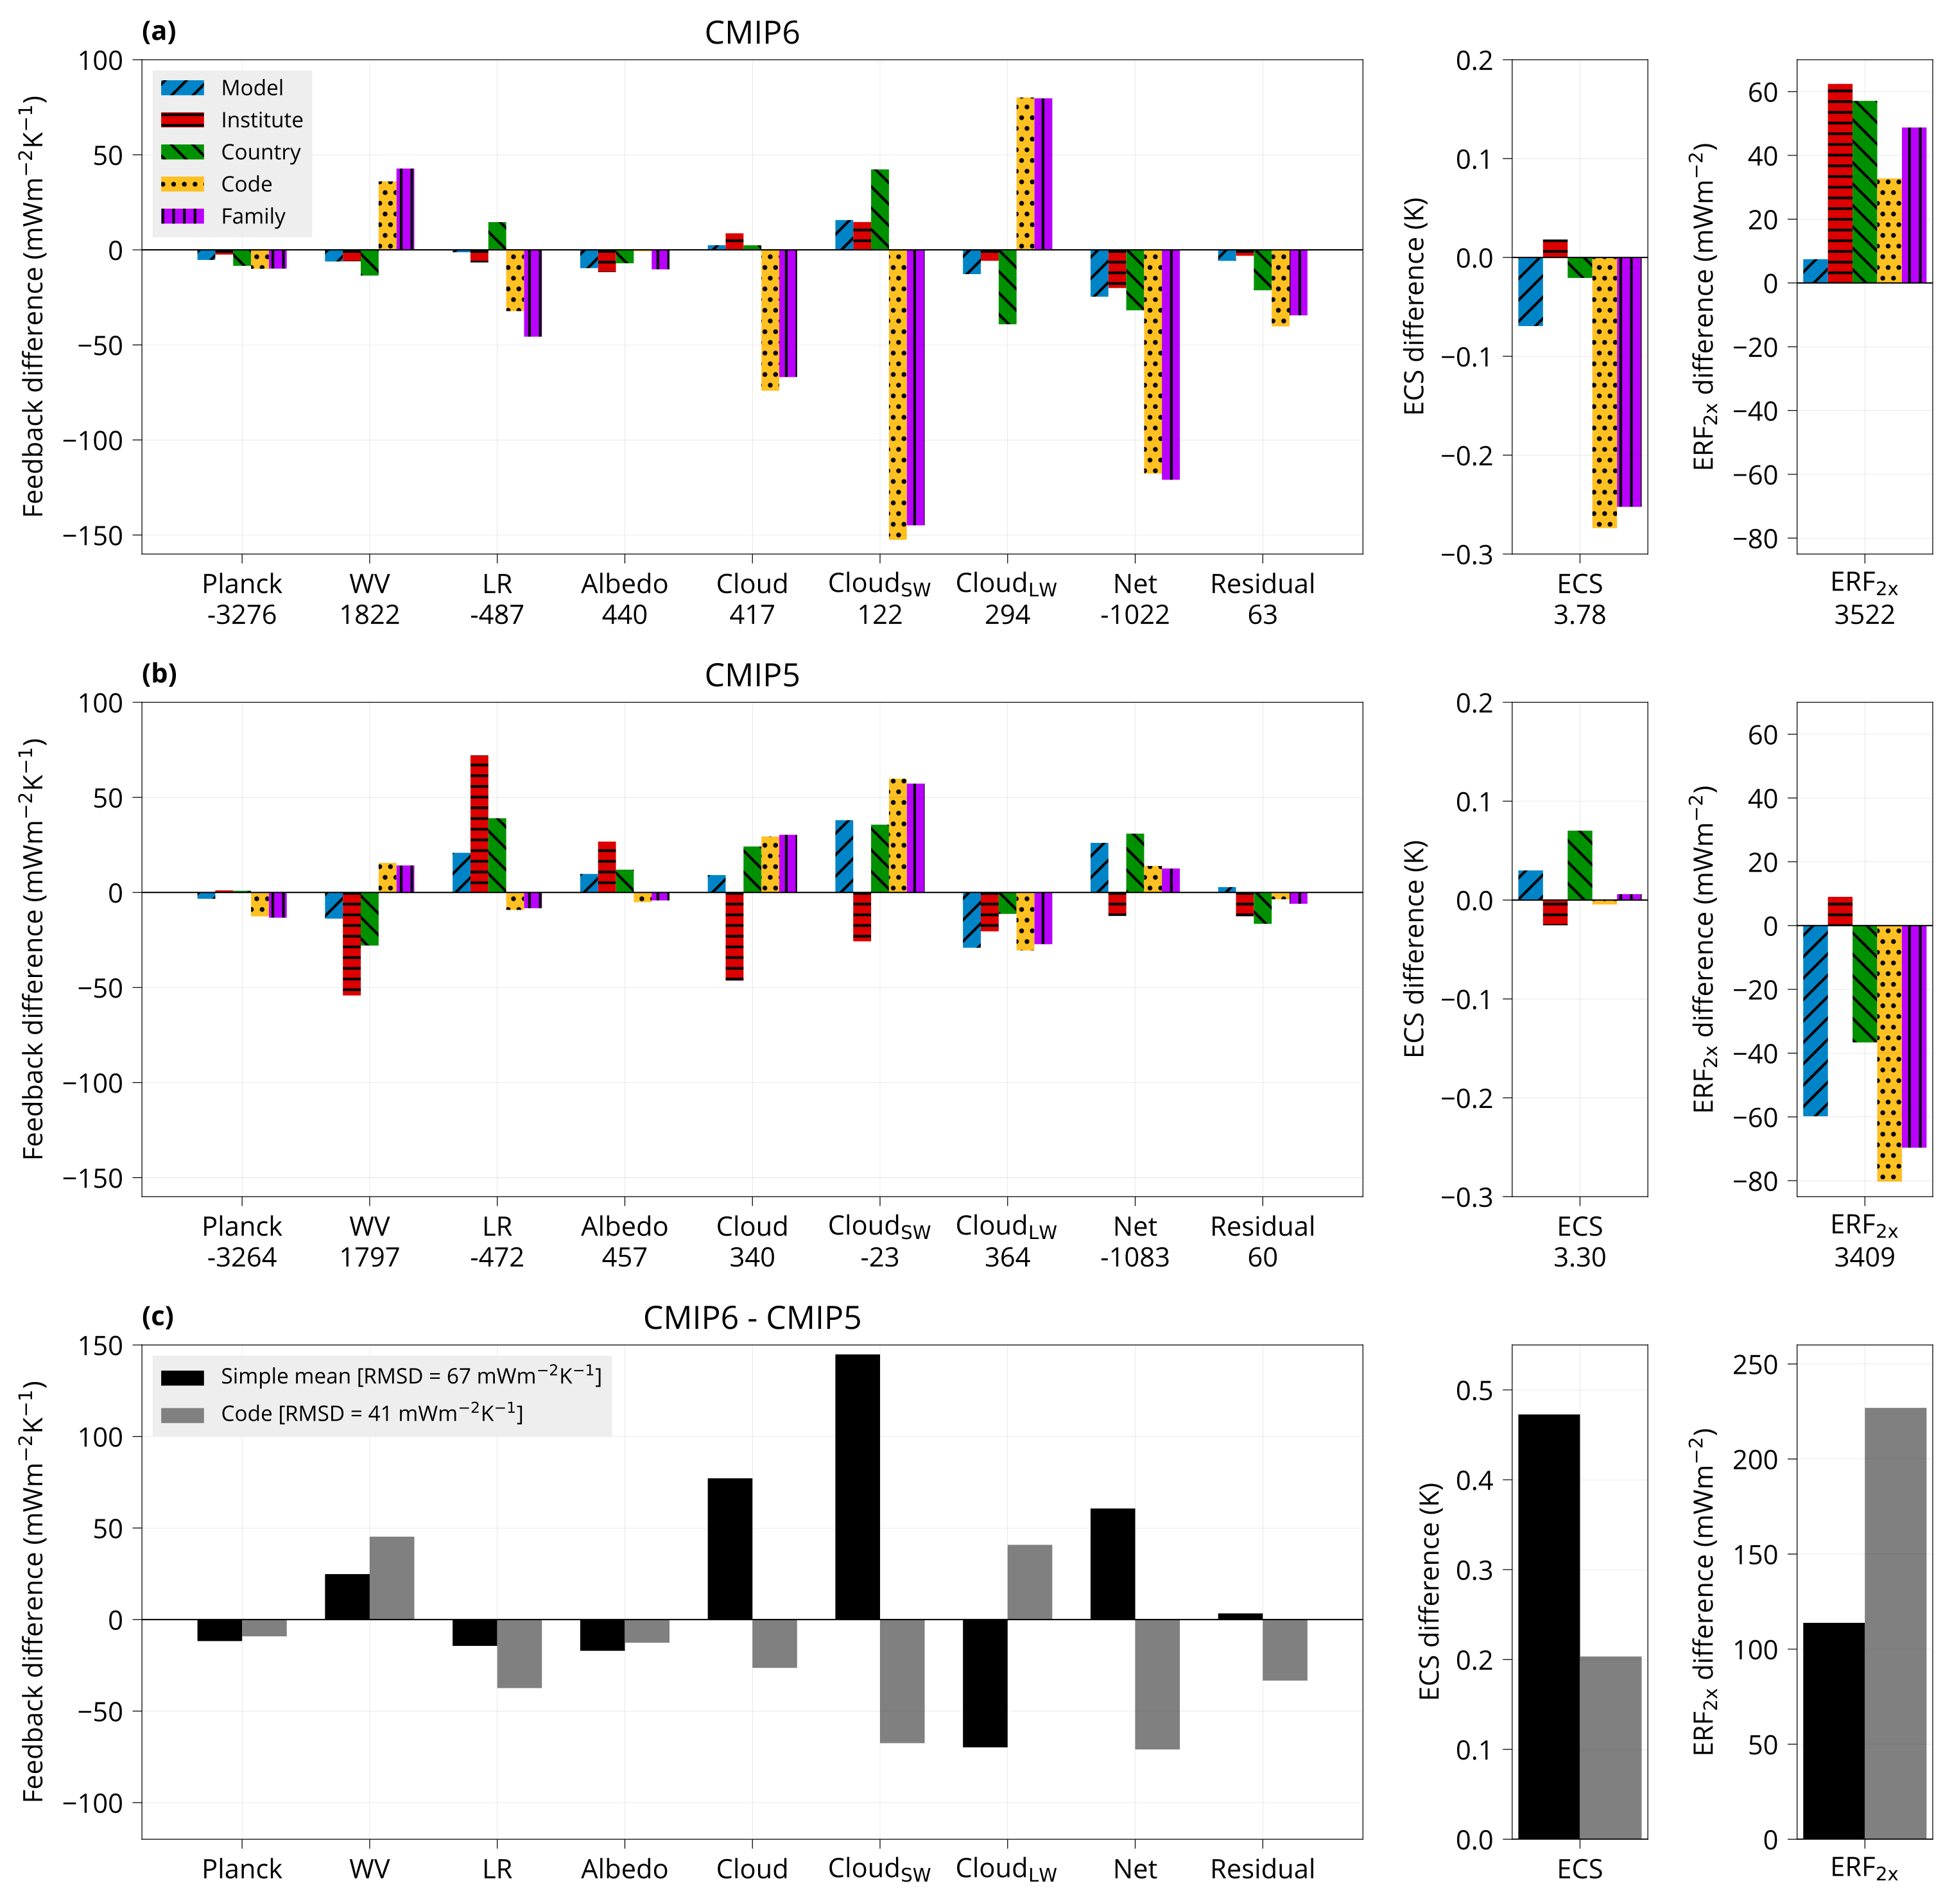
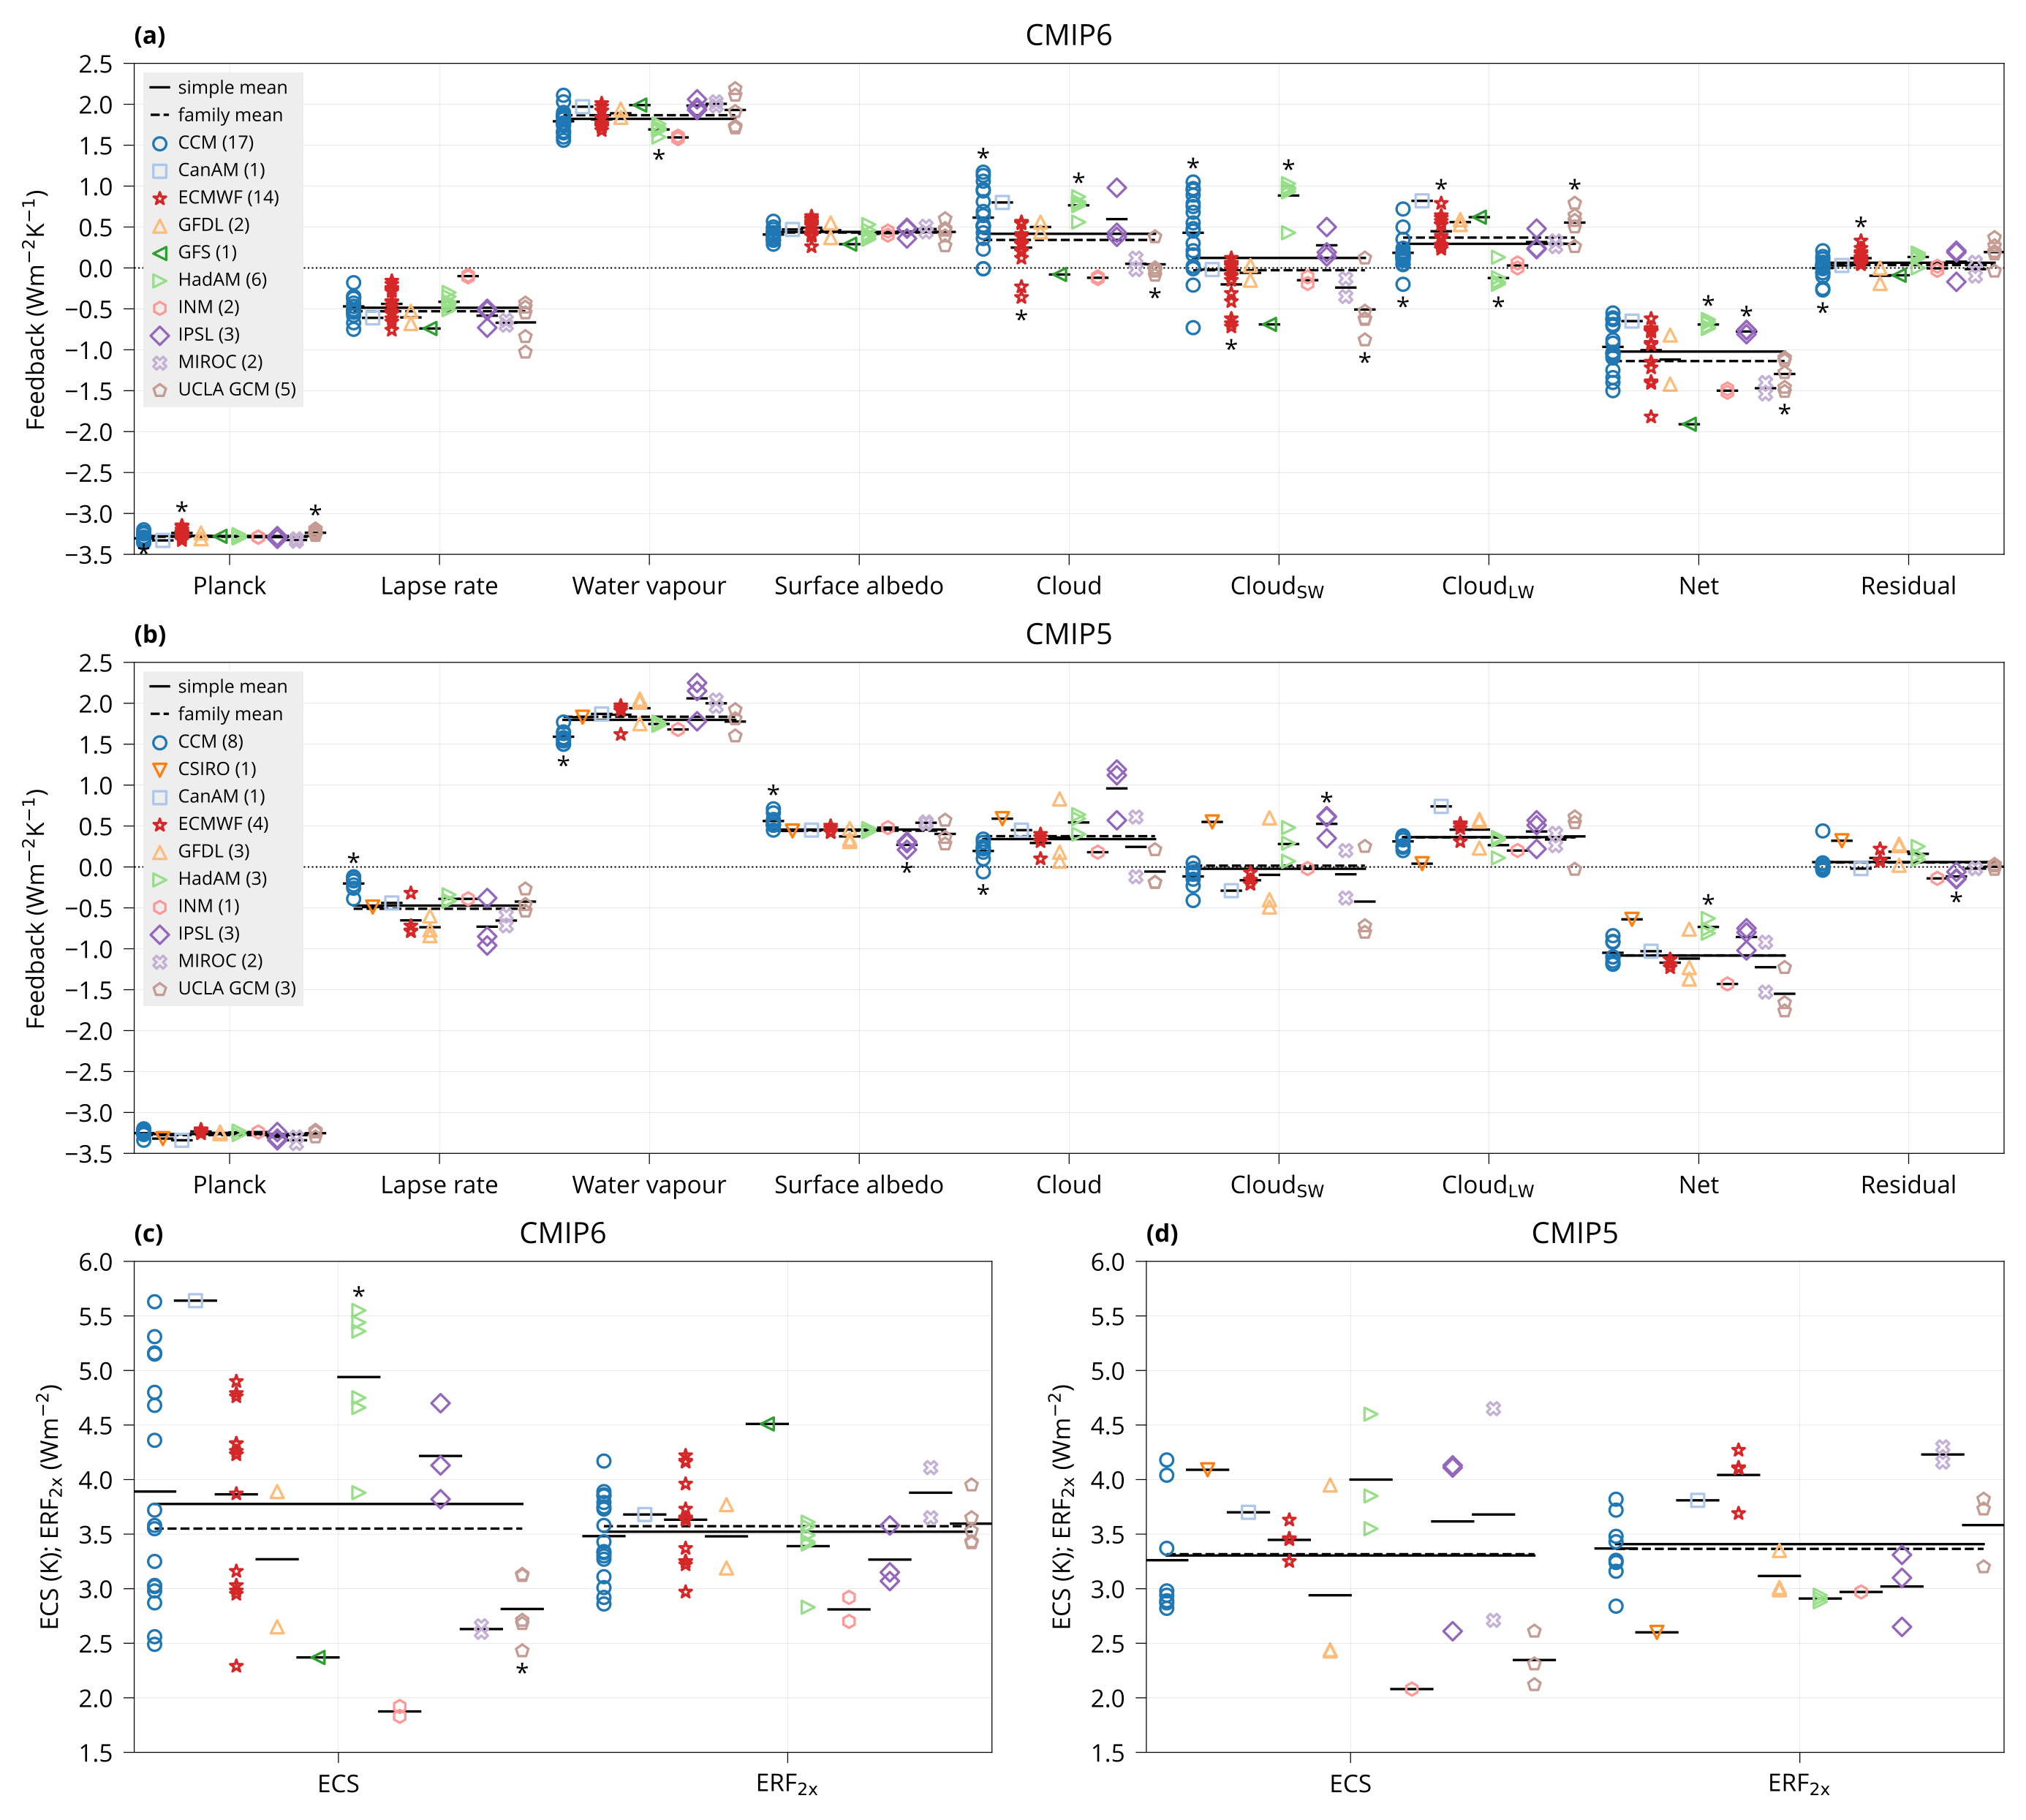
Plot bar plot with model feedbacks.

Usage: plot_feedbacks MODELS CMIP5 CMIP6 OUTPUT

Arguments:

  MODELS        Table of all models (CSV).
  CMIP5, CMIP6  Input data (CSV). The table should contain a column "Model" identifying the model, and columns to calculate statistics for.
  OUTPUT        Output plot (PDF).

Examples:

bin/plot_feedbacks input/models.csv input/CMIP{5,6}_ECS_ERF_fbks.csv plot/feedbacks.pdf
Plot bar plot with model feedbacks by model group (family or country).

Usage: plot_feedbacks_by_group GROUP SEP MODELS CMIP5 CMIP6 OUTPUT [OUTPUT_CMIP5 OUTPUT_CMIP6 [BAYES_CMIP5 BAYES_CMIP6]]

Arguments:

  GROUP         Group to show. One of: "family", "country".
  SEP           CMIP5 and CMIP6 separate or together. One of "separate", "together".
  MODELS        Table of all models (CSV).
  CMIP5, CMIP6  Input data (CSV). The table should contain a column "Model" identifying the model, and columns to calculate statistics for.
  OUTPUT        Output plot (PDF).
  OUTPUT_CMIP5  CMIP5 plot data output (NetCDF).
  OUTPUT_CMIP6  CMIP6 plot data output (NetCDF).
  BAYES_CMIP5   CMIP5 Bayes test input (NetCDF).
  BAYES_CMIP6   CMIP5 Bayes test input (NetCDF).

Examples:

bin/plot_feedbacks_by_group family separate input/models.csv input/CMIP{5,6}_ECS_ERF_fbks.csv plot/feedbacks_by_family.pdf
bin/plot_feedbacks_by_group family separate input/models.csv input/CMIP{5,6}_ECS_ERF_fbks.csv plot/feedbacks_by_family.pdf data/feedbacks_by_family_cmip{5,6}.nc
bin/plot_feedbacks_by_group family separate input/models.csv input/CMIP{5,6}_ECS_ERF_fbks.csv plot/feedbacks_by_family.pdf data/feedbacks_by_family_cmip{5,6}.nc data/feedbacks_by_family_cmip{5,6}_bayes.nc
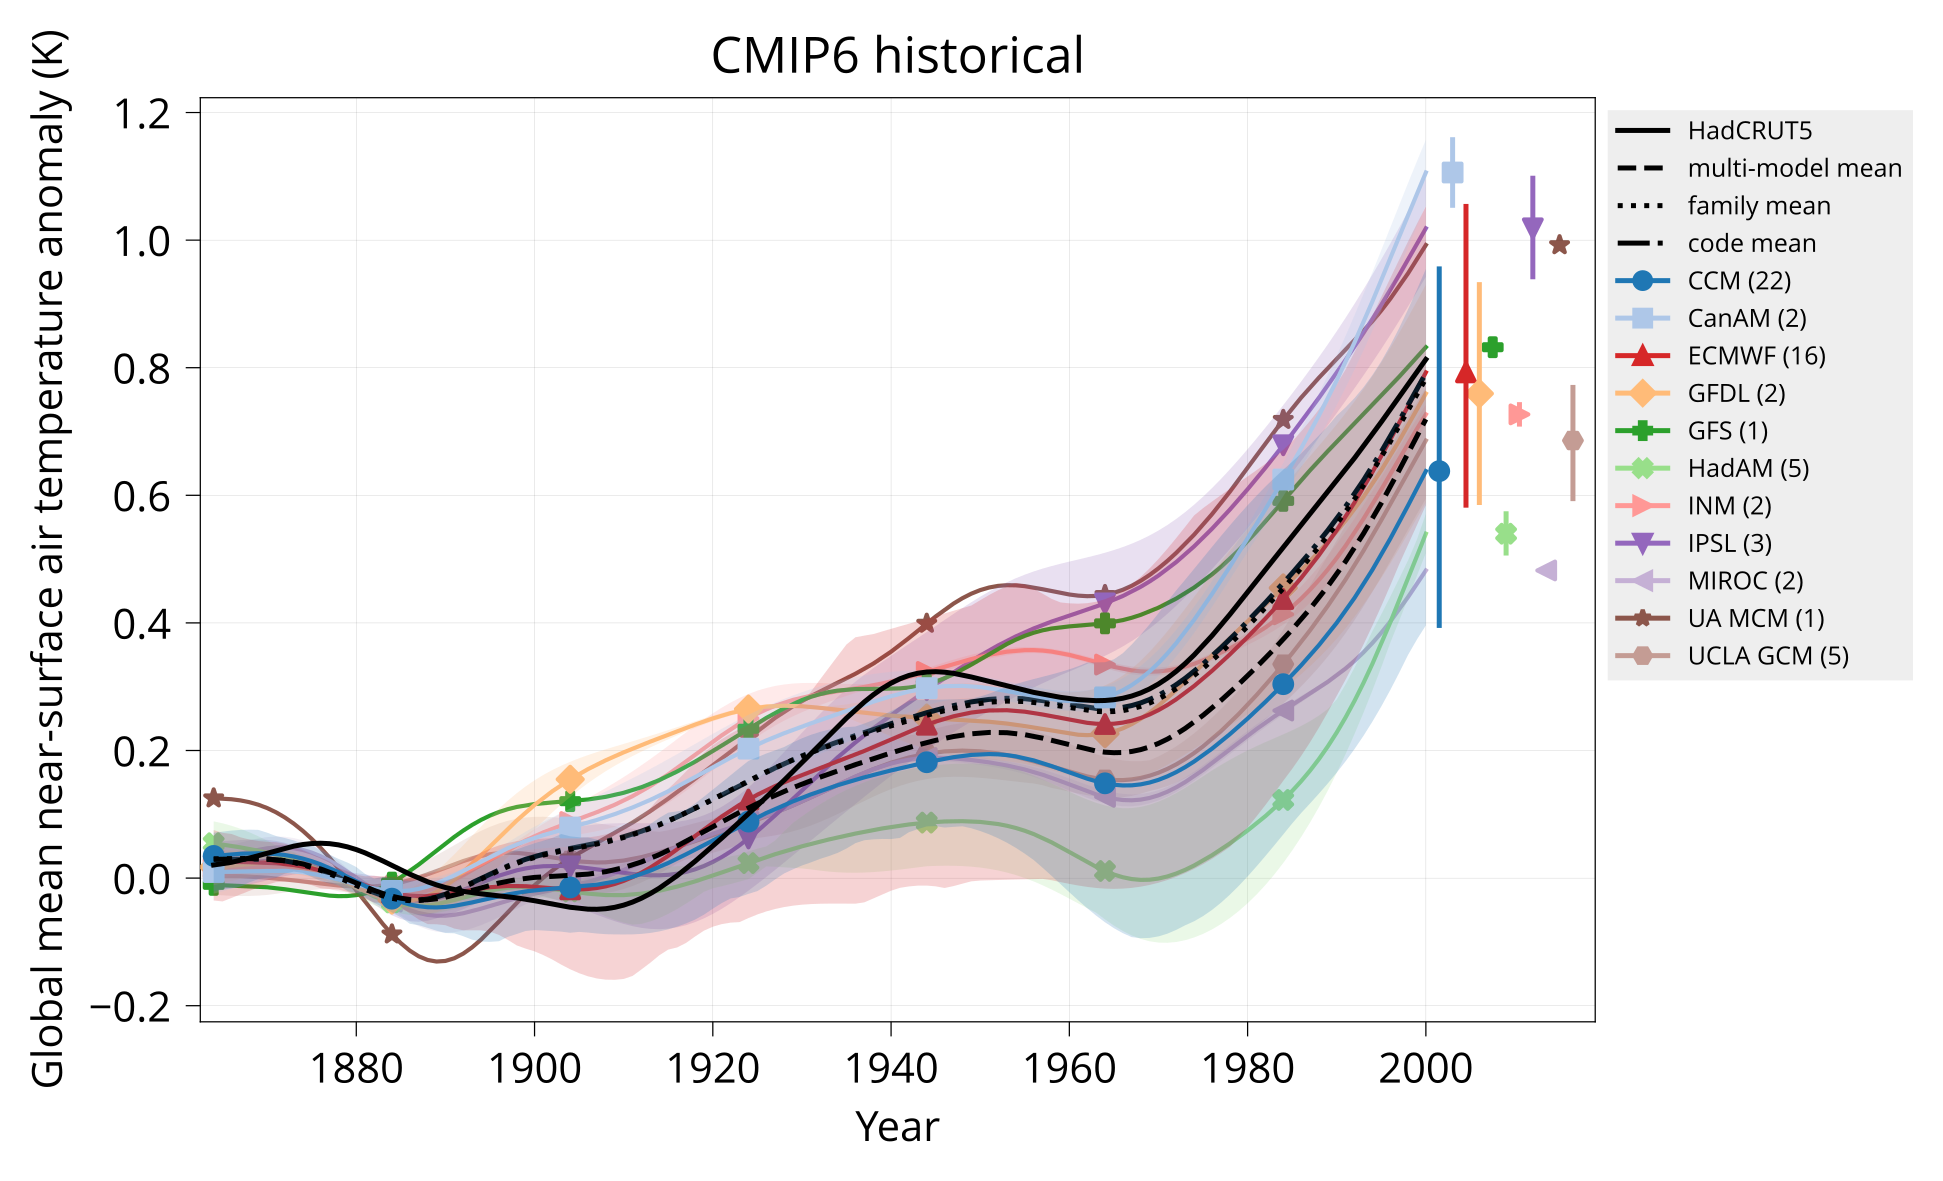
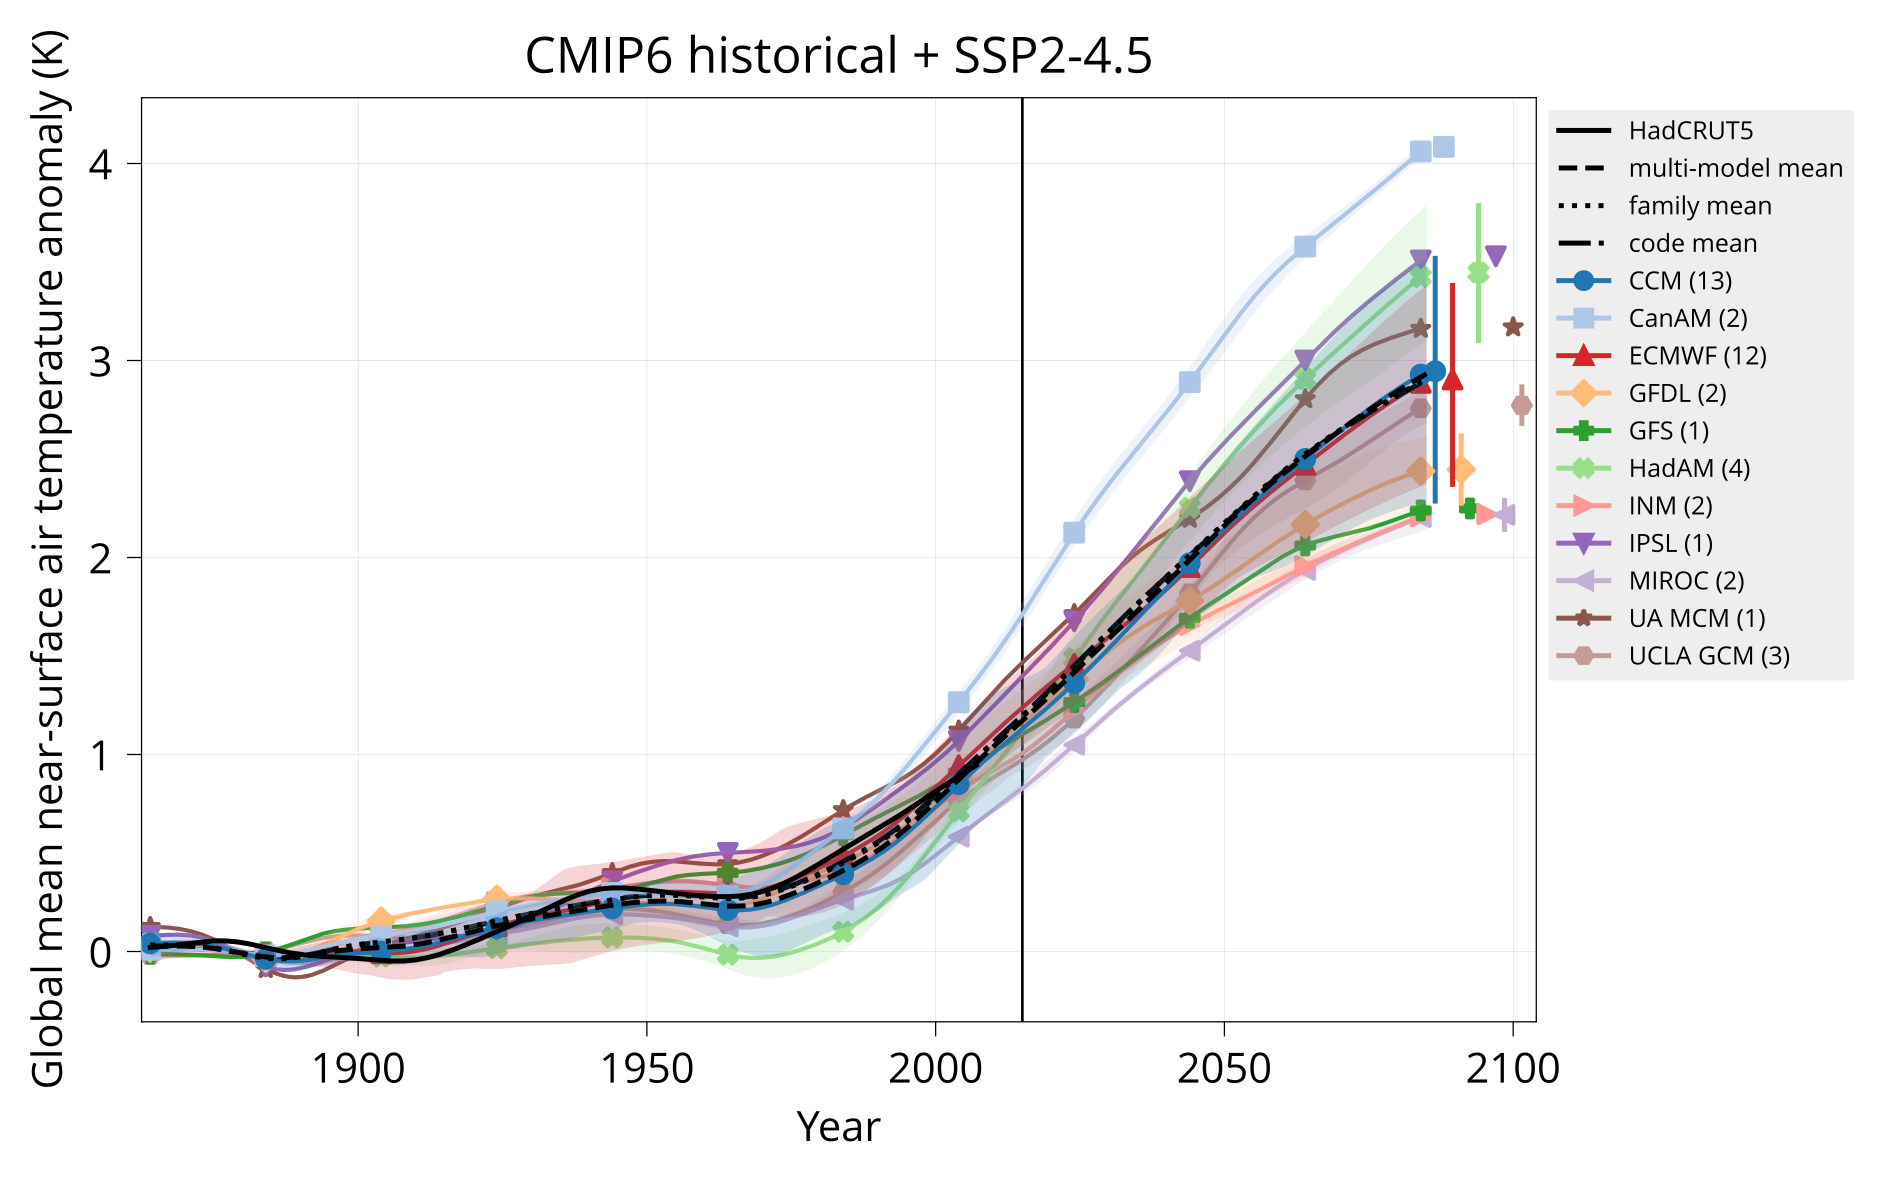
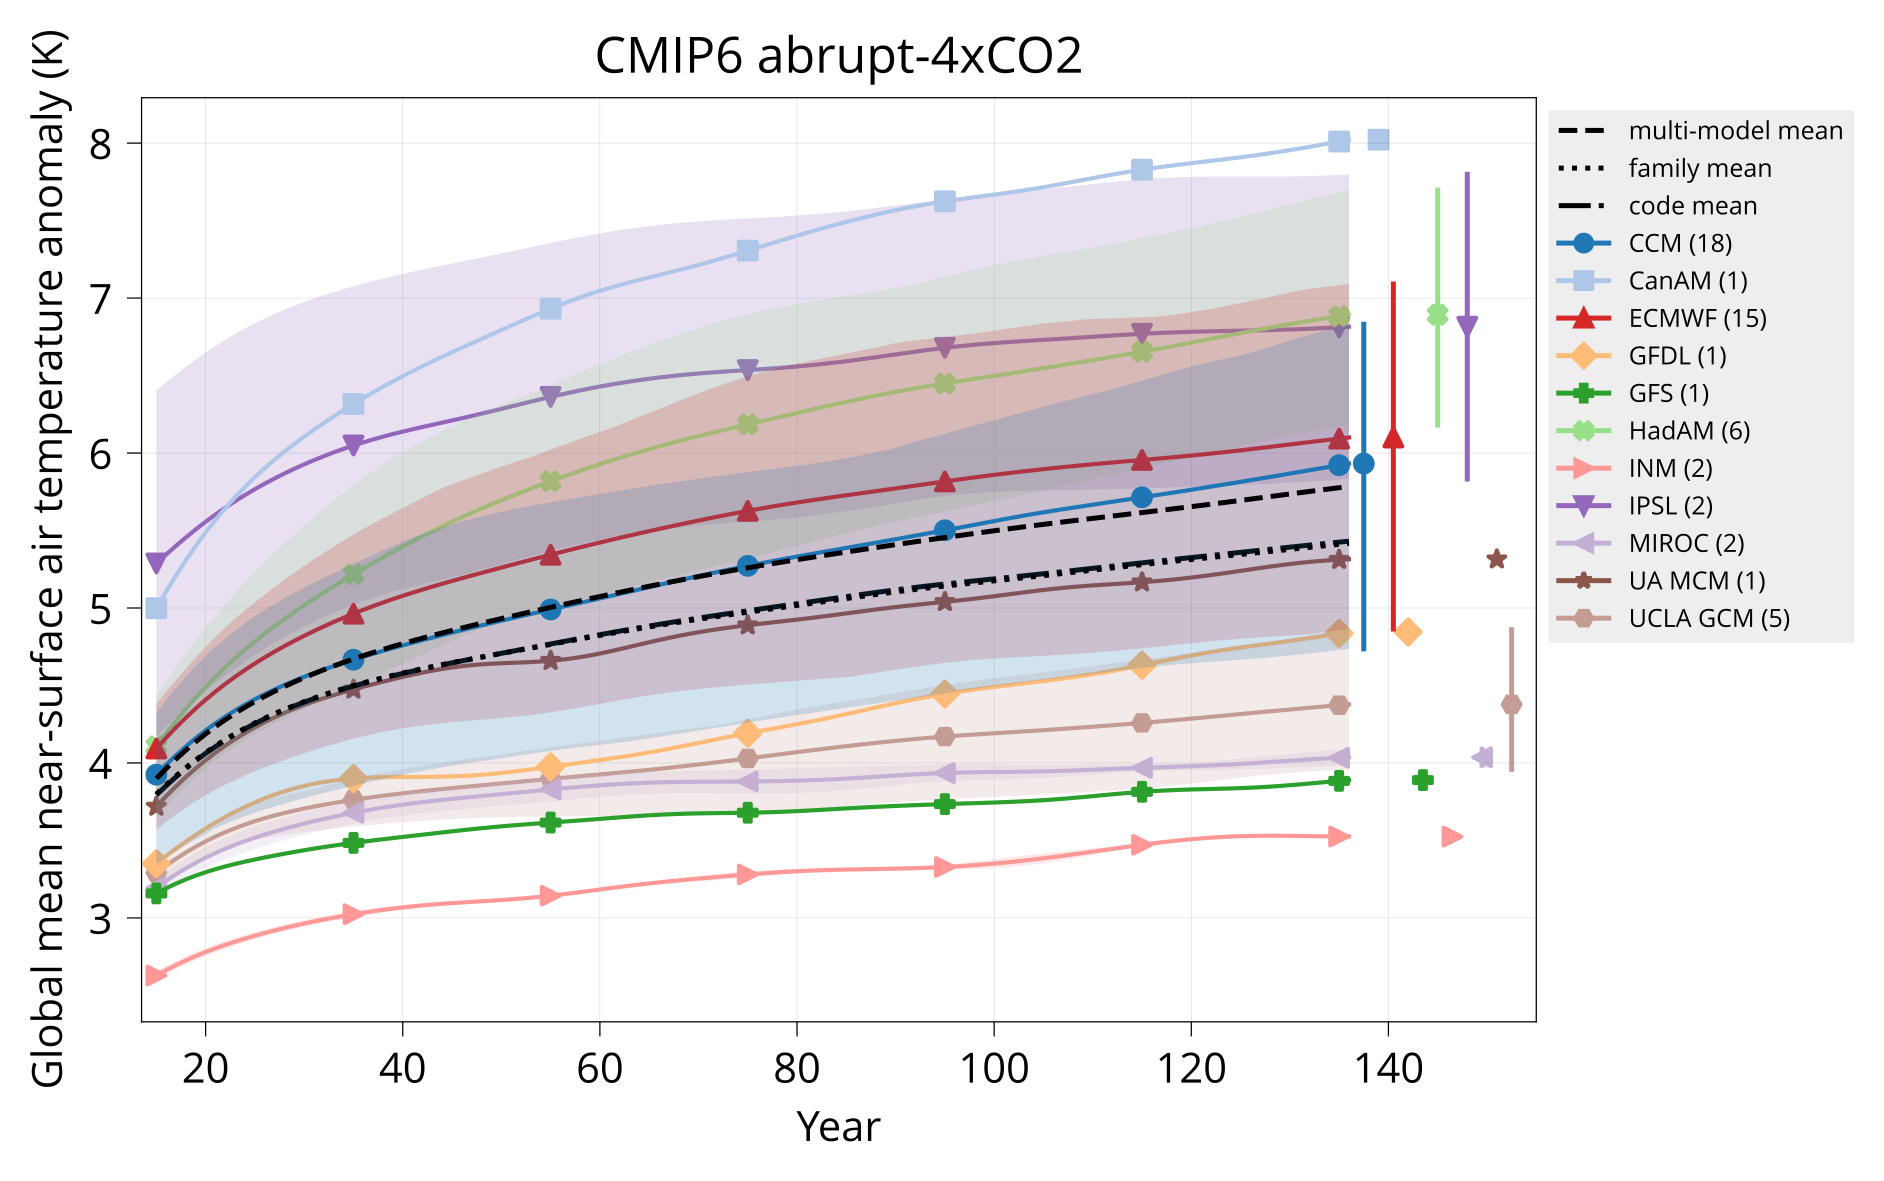
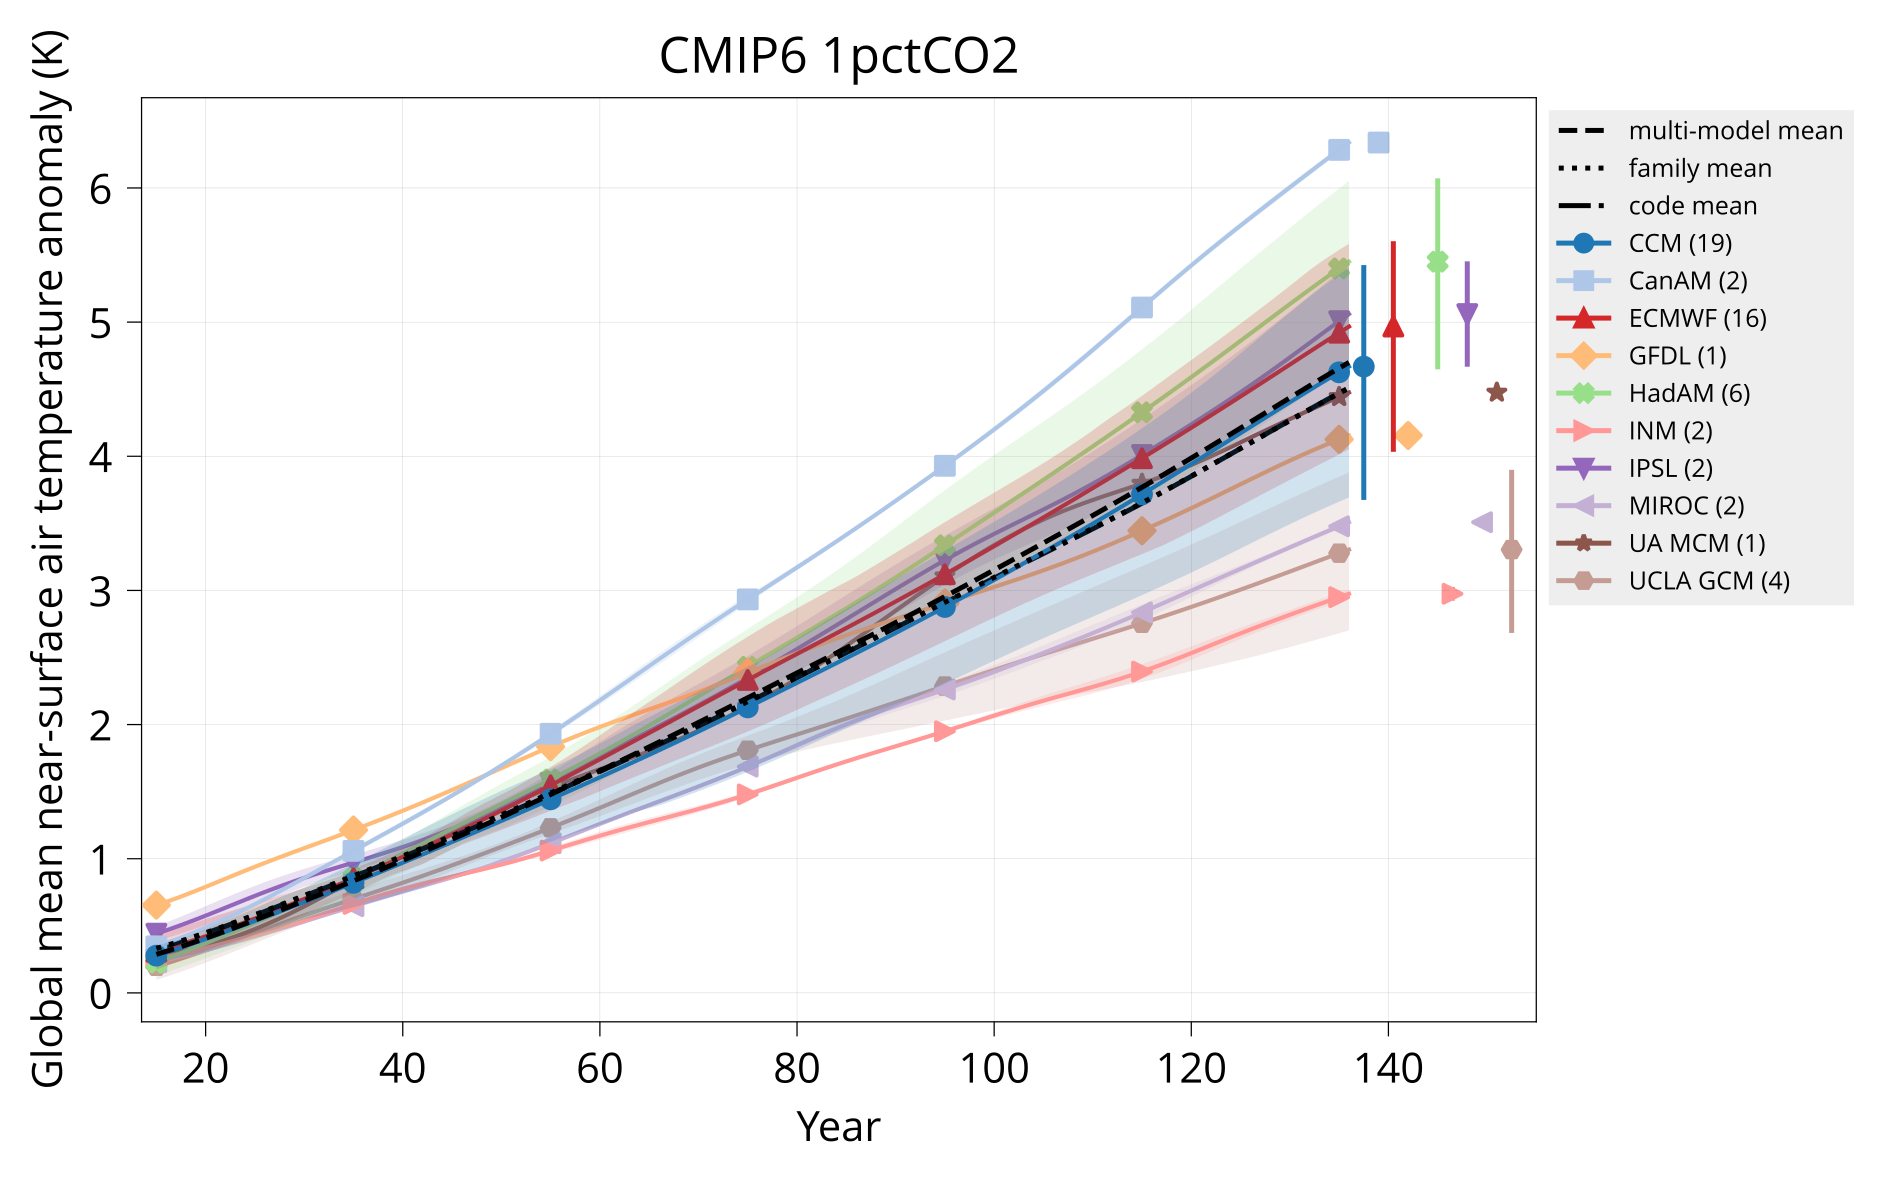
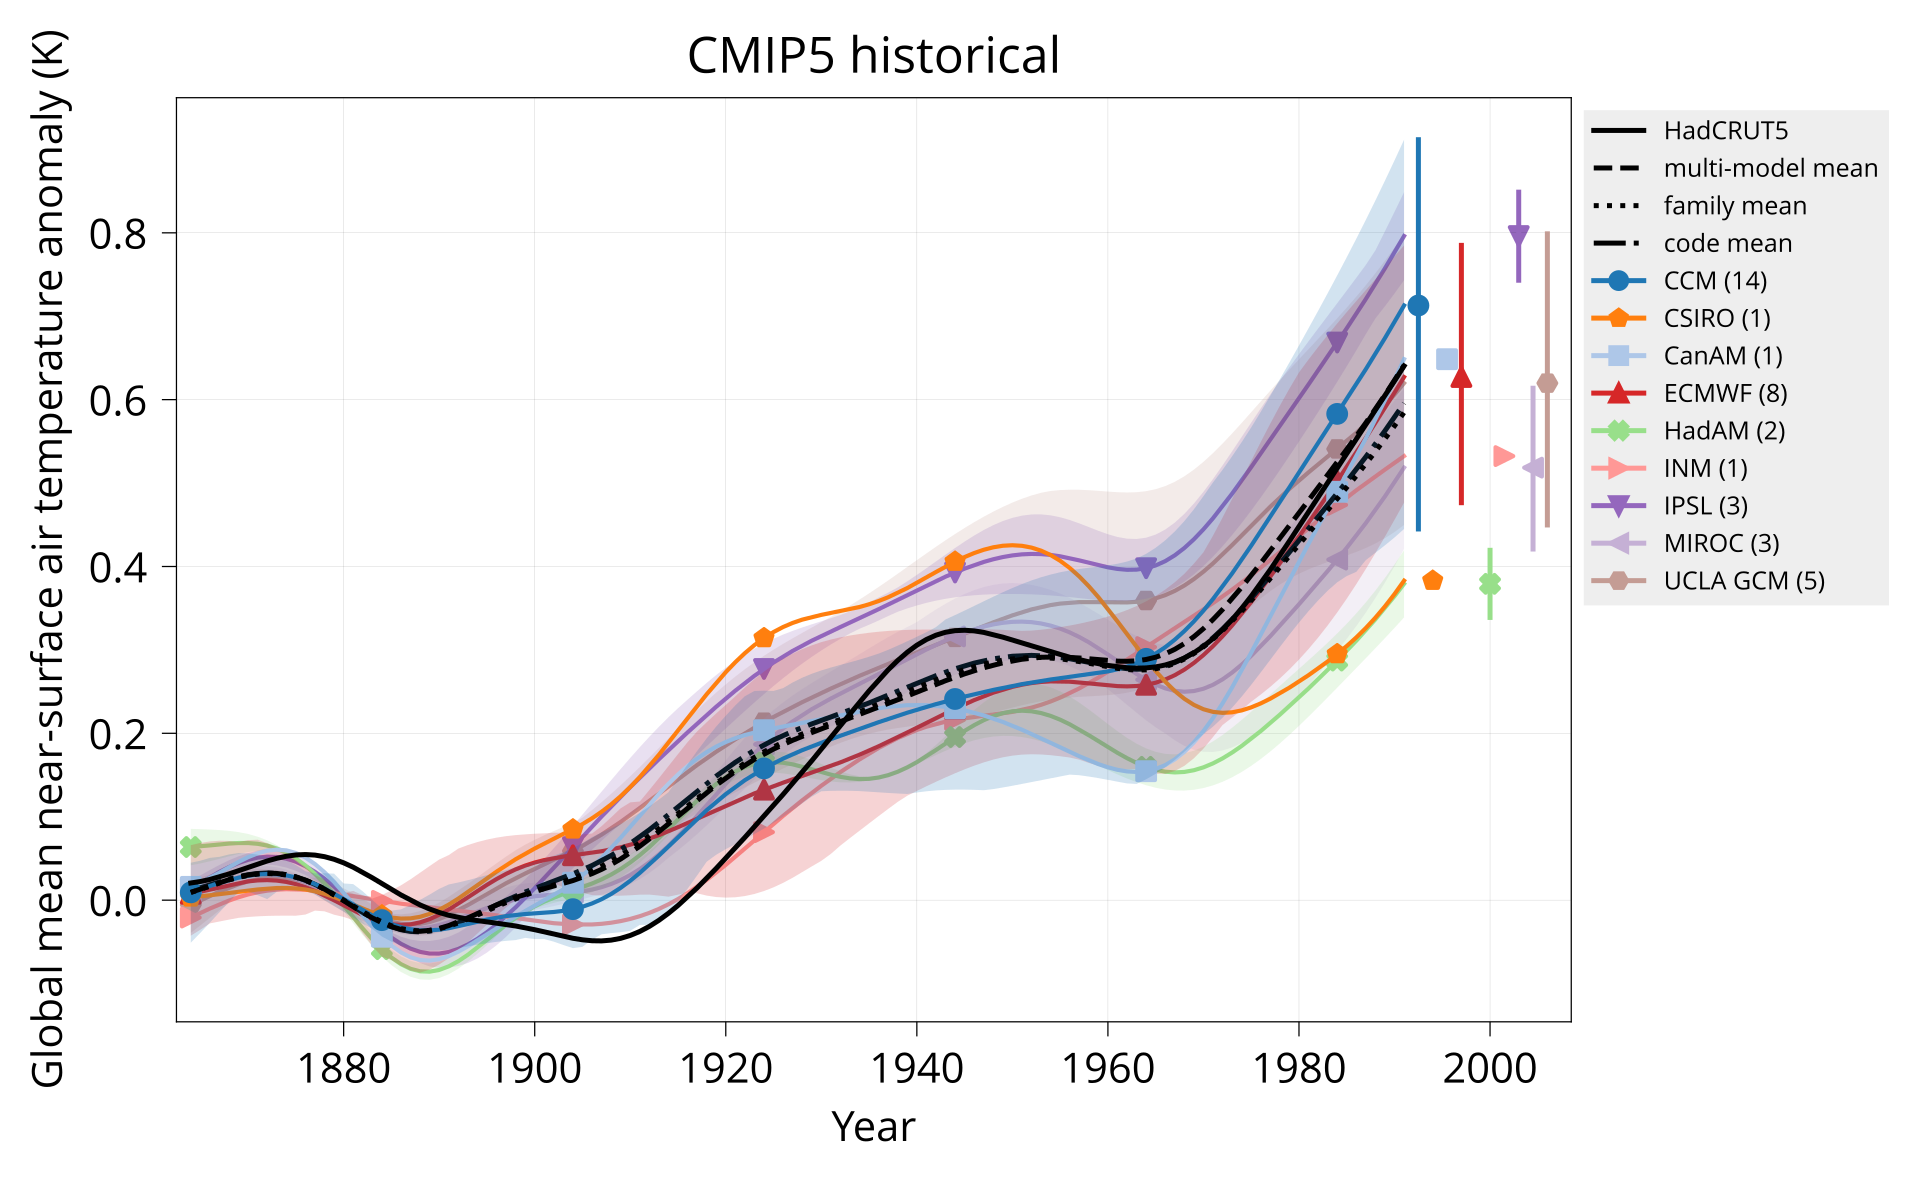
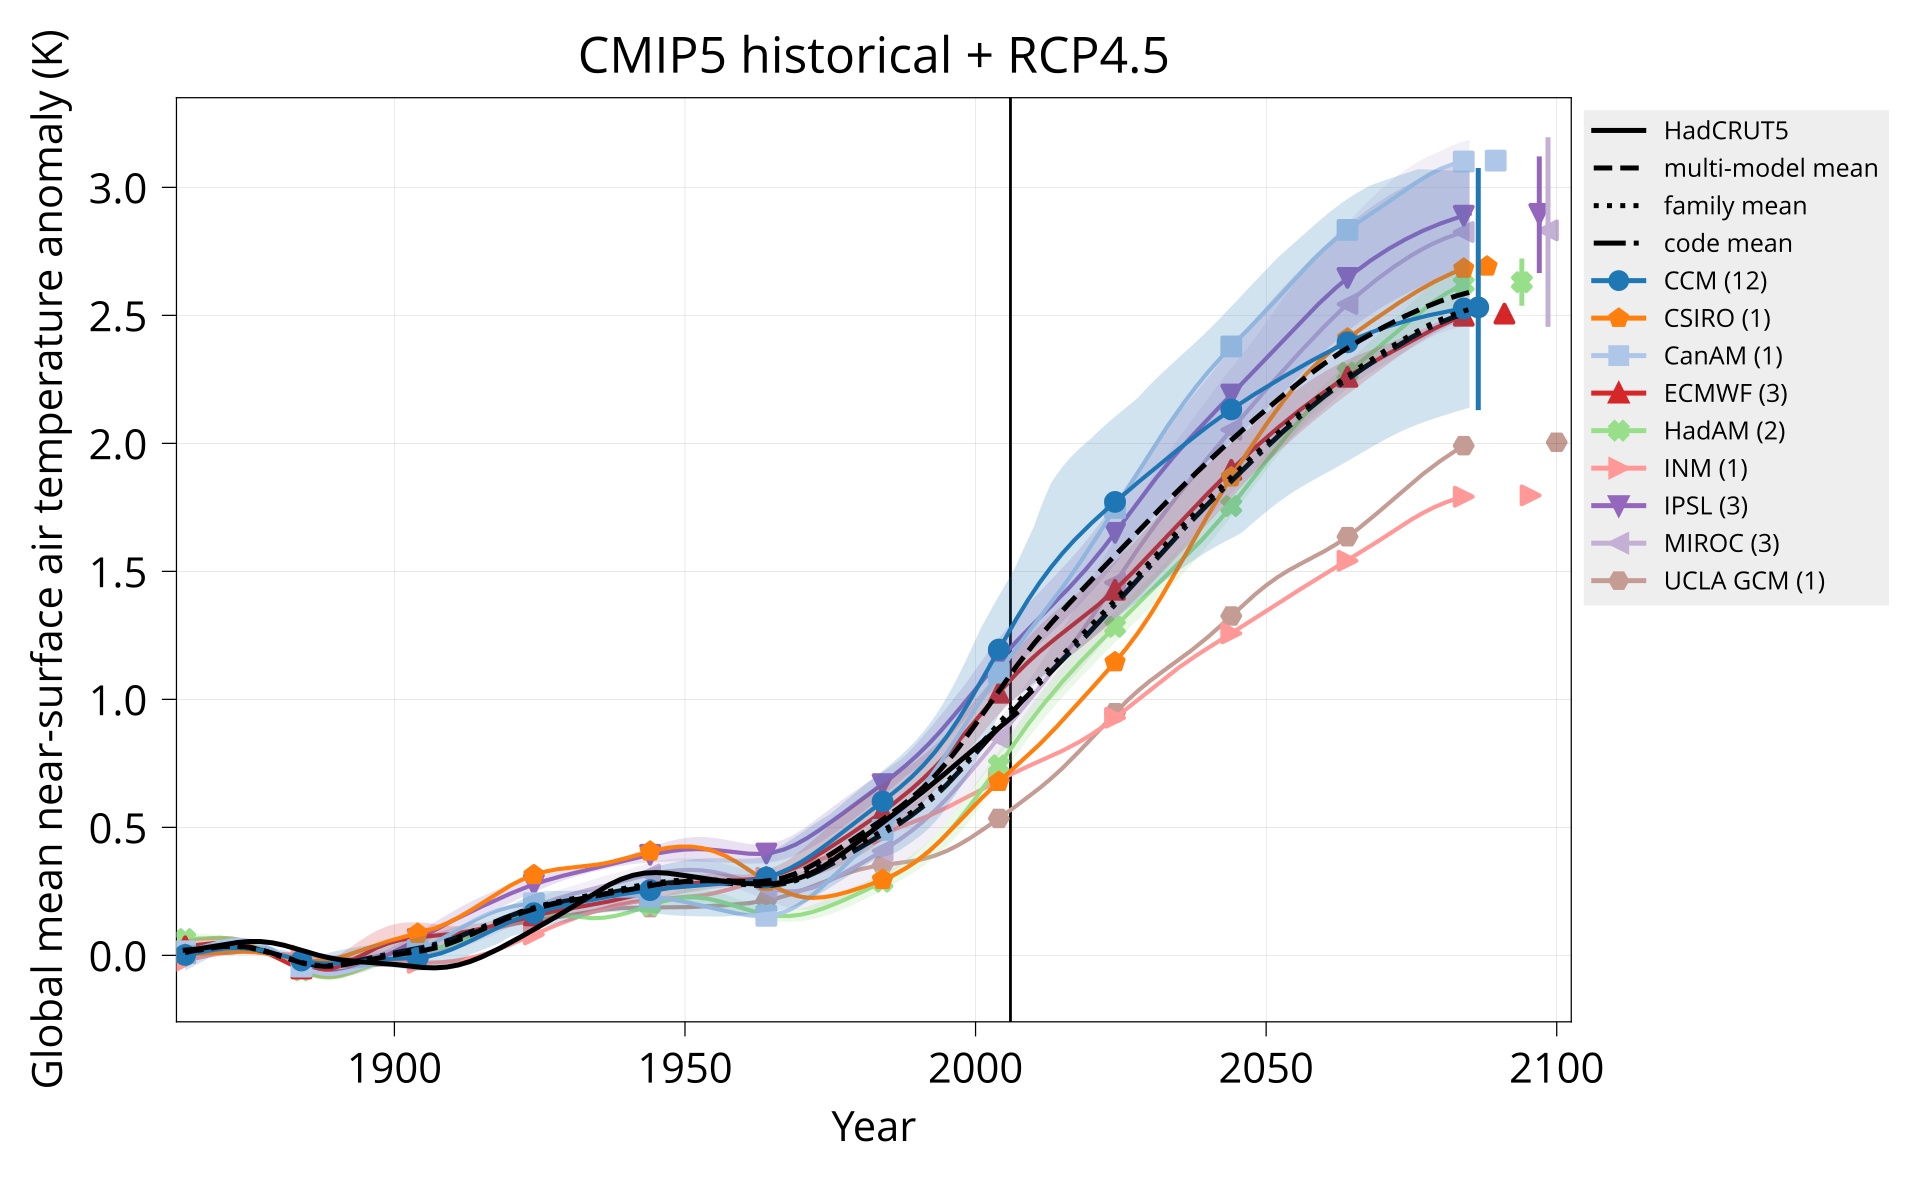
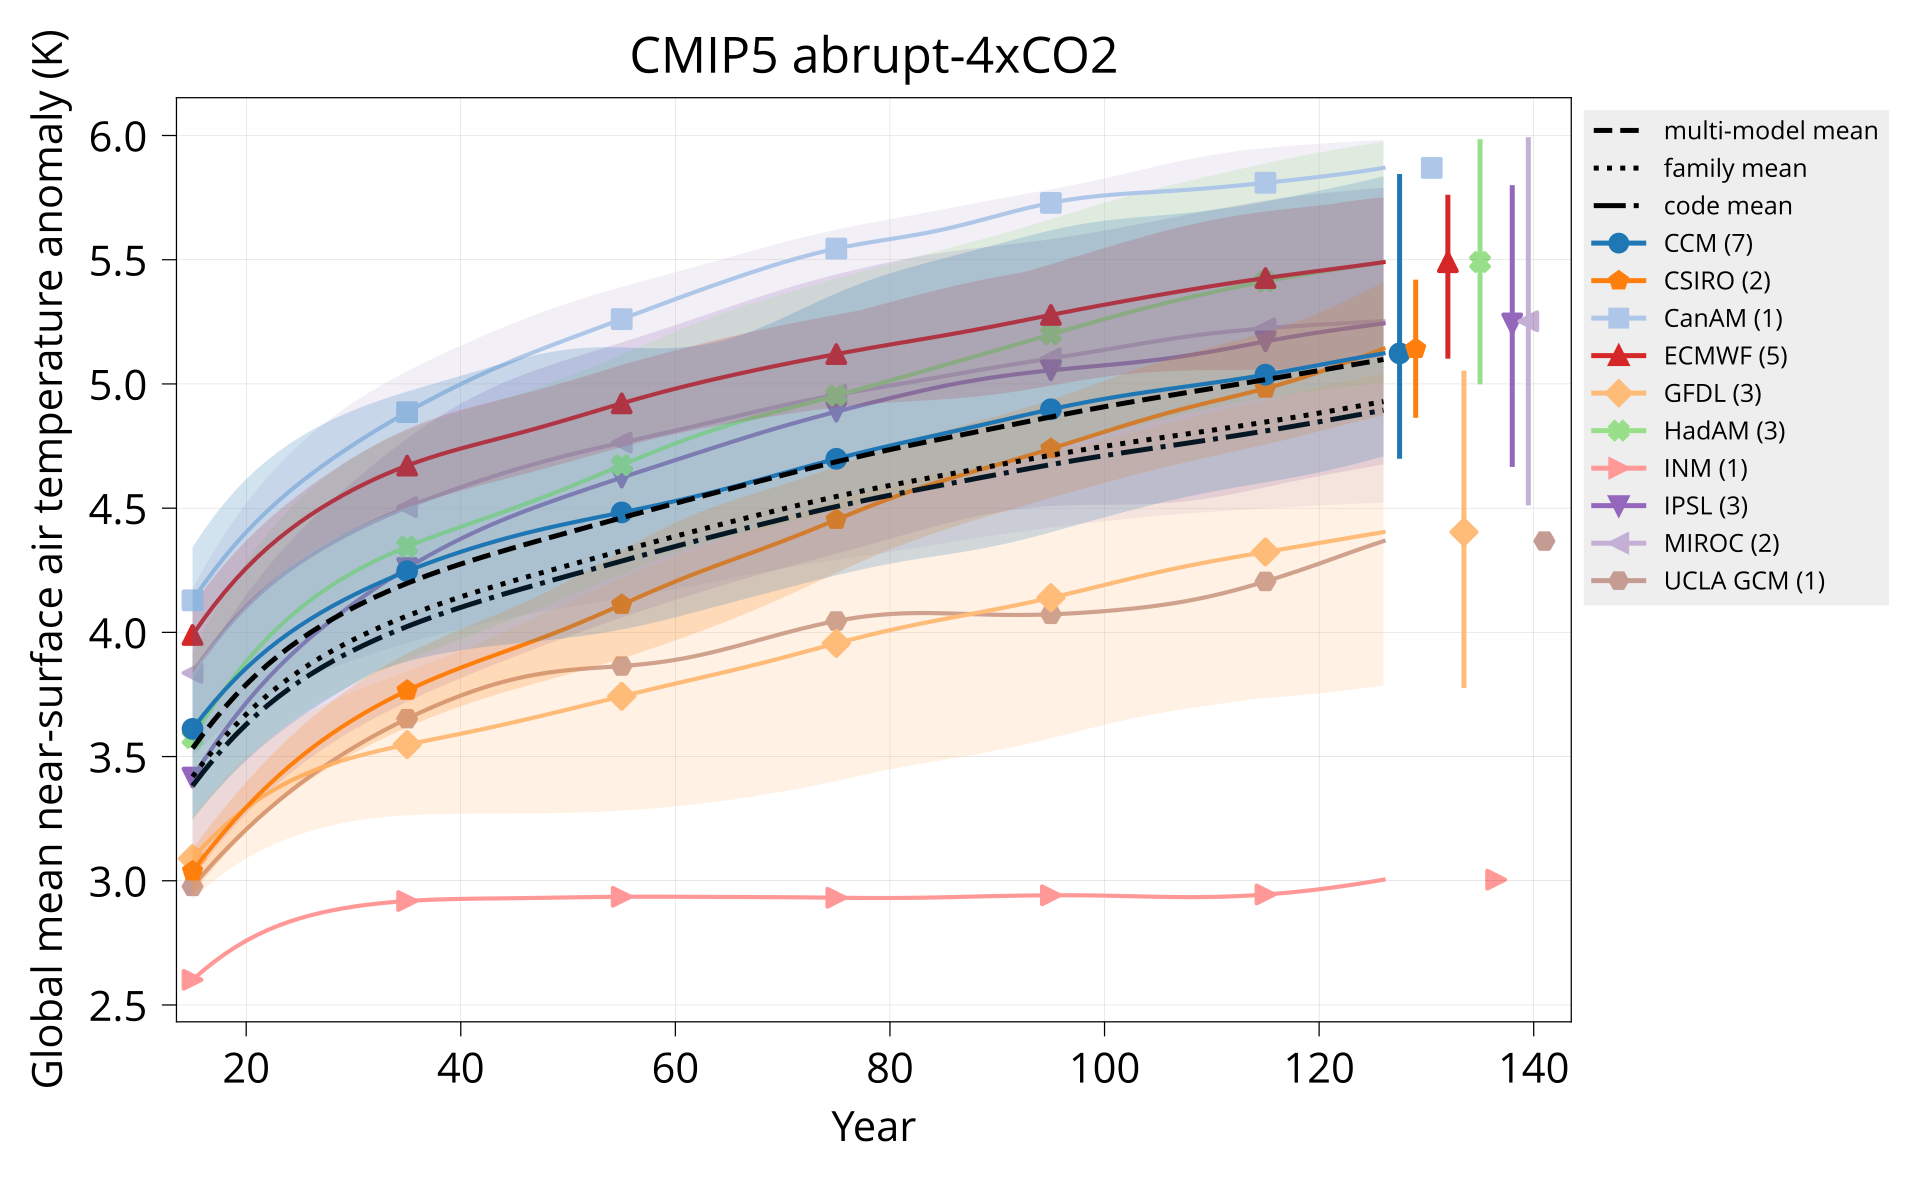
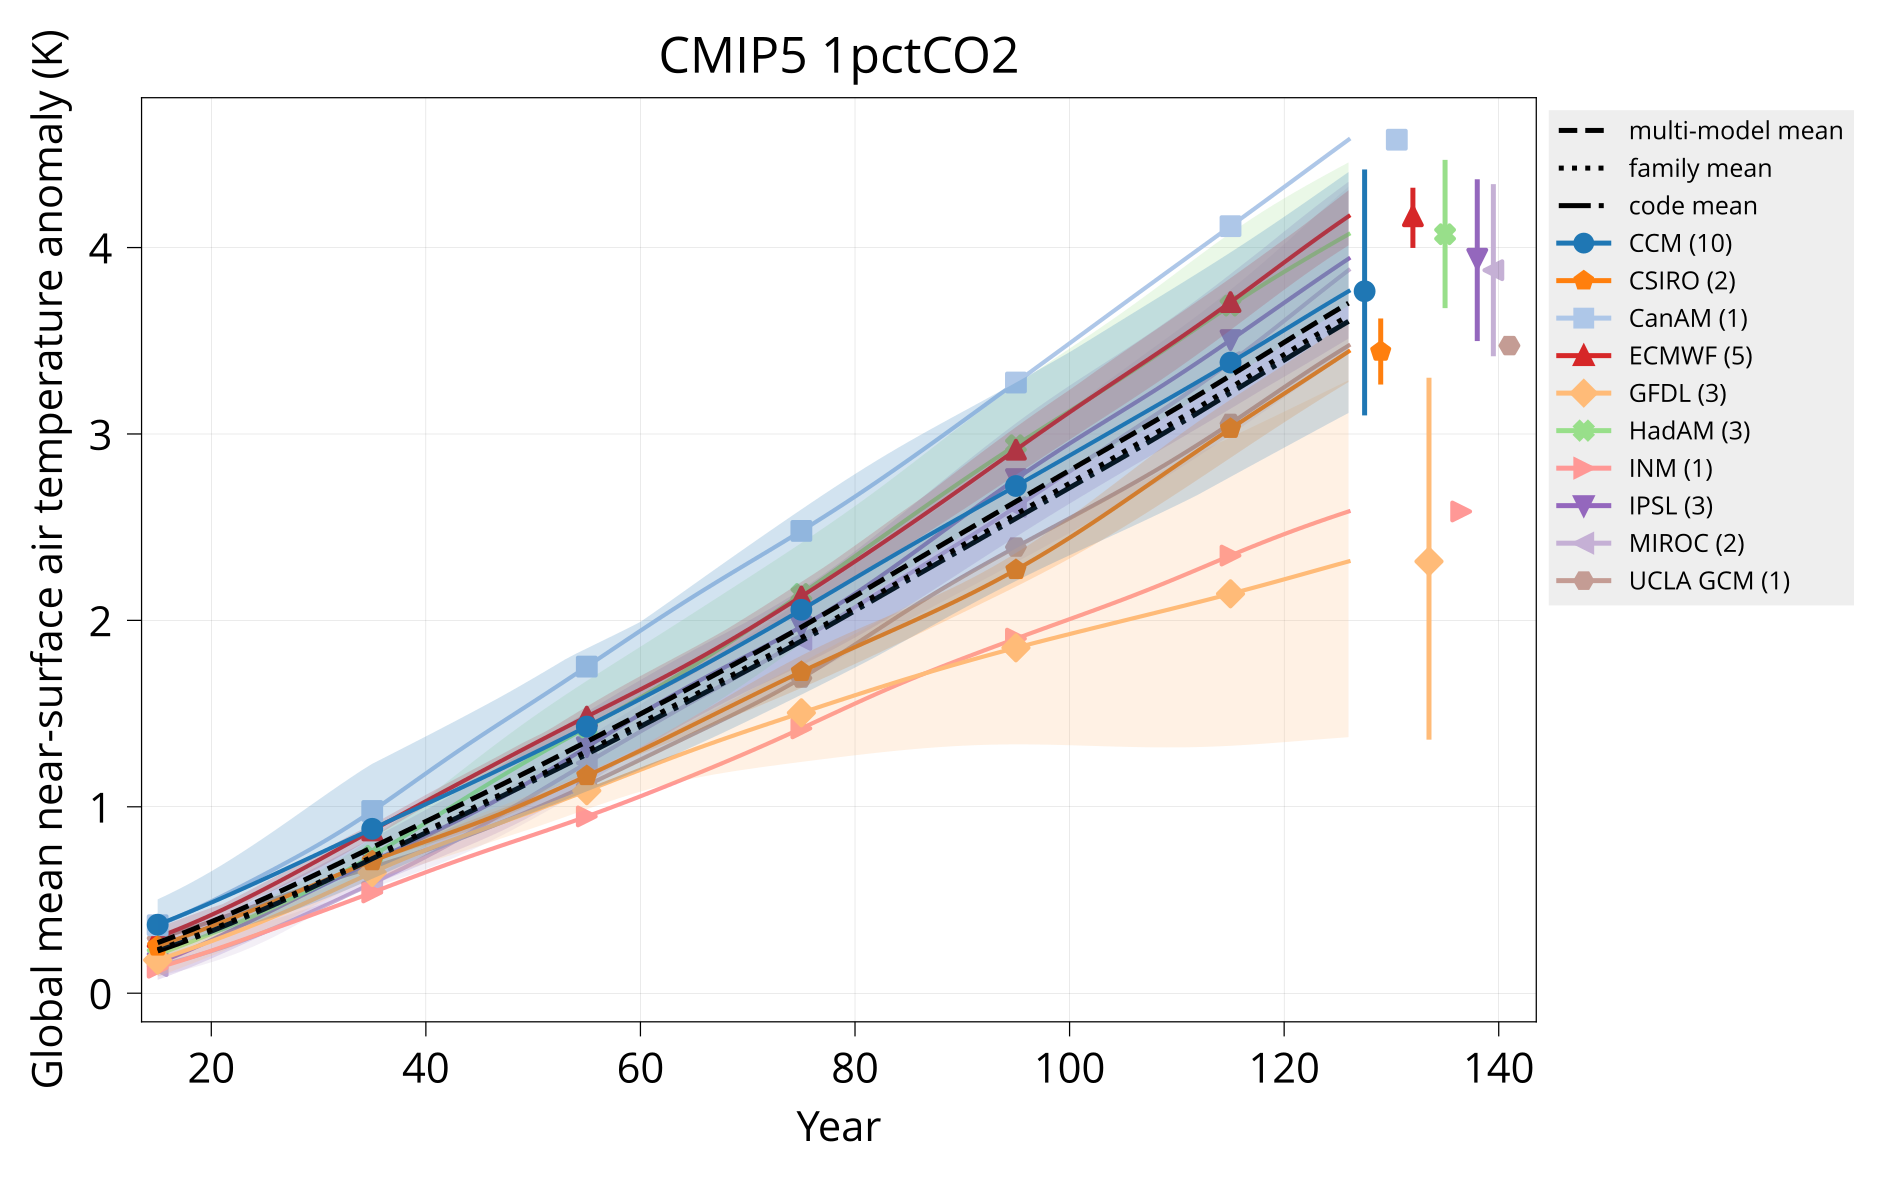
Plot global mean near-surface air temperature.

Usage: plot_tas MODELS CONTROL TAS HADCRUT OUTPUT Y1 Y2 TITLE [OPTIONS]

Arguments:

  MODELS   Table of models (CSV).
  CONTROL  Input directory with model tas - piControl or none (NetCDF).
  TAS      Input directory with model tas - experiment (NetCDF).
  HADCRUT  Input HadCRUT file (NetCDF).
  OUTPUT   Output plot (PDF).
  Y1       Start year.
  Y2       End year.
  TITLE    Plot title.

Options:

  divider: VALUE  Year to plot vertical divider on.

Examples:

bin/plot_tas input/models.csv none input/cmip6/historical/tas input/HadCRUT.5.0.1.0.analysis.summary_series.global.monthly.nc plot/tas_cmip6_historical.pdf 1850 2014 'CMIP6 historical'
bin/plot_tas input/models.csv none input/cmip6/historical+ssp245/tas input/HadCRUT.5.0.1.0.analysis.summary_series.global.monthly.nc plot/tas_cmip6_historical+ssp245.pdf 1850 2099 'CMIP6 historical + SSP2-4.5' divider: 2015
bin/plot_tas input/models.csv input/cmip6/{piControl,abrupt-4xCO2}/tas none plot/tas_cmip6_abrupt-4xCO2.pdf 1 150 'CMIP6 abrupt-4xCO2'
bin/plot_tas input/models.csv input/cmip6/{piControl,1pctCO2}/tas none plot/tas_cmip6_1pctCO2.pdf 1 150 'CMIP6 1pctCO2'
bin/plot_tas input/models.csv none input/cmip5/historical/tas input/HadCRUT.5.0.1.0.analysis.summary_series.global.monthly.nc plot/tas_cmip5_historical.pdf 1850 2005 'CMIP5 historical'
bin/plot_tas input/models.csv none input/cmip5/historical+rcp45/tas input/HadCRUT.5.0.1.0.analysis.summary_series.global.monthly.nc plot/tas_cmip5_historical+rcp45.pdf 1850 2099 'CMIP5 historical + RCP4.5' divider: 2006
bin/plot_tas input/models.csv input/cmip5/{piControl,abrupt-4xCO2}/tas none plot/tas_cmip5_abrupt-4xCO2.pdf 1 140 'CMIP5 abrupt-4xCO2'
bin/plot_tas input/models.csv input/cmip5/{piControl,1pctCO2}/tas none plot/tas_cmip5_1pctCO2.pdf 1 140 'CMIP5 1pctCO2'
This code is open source and can be used freely under the terms of an MIT license as detailed in the file LICENSE.md.
The data in the input directory come from various external sources as linked
in the Input files section above, except for the files
models.csv and subset.csv which are internal data files of this project.
The data from the external sources can be used according to the conditions set
by the original external source. The internal files and output data files in the
directory data are in the public domain (CC0 1.0 Universal Public Domain
Dedication). To the extent
possible under law, Peter Kuma has waived all copyright and related or
neighboring rights to the internal data files. Attribution in the form of a
citation of the
manuscript is
welcome.
This documentation (README.md), the image files in the img directory,
and the output plots in the directory plot are licensed under the Creative
Commons Attribution 4.0 International license (CC BY
4.0). A copy of this license is
included in this repository in the file LICENSE_CC.txt.
