This repository contains a data source plugin for Grafana to allow the plotting of time-series data that's stored in Zed lakes.
- Installation
- Zed & CORS
- Best Practices
- Configuration
- Example Usage in Dashboards
- Debugging
- Contributing
- Join the Community
As the plugin has not yet been signed and distributed, these installation instructions effectively show how to get the plugin running in a way that would allow for its further development. The instructions below show how to do this with macOS.
- Install Grafana and needed development tools
brew update
brew install grafana nvm yarn
nvm install 16.14.2
nvm use 16.14.2
- Clone the plugin repo
mkdir -p $HOME/grafana-plugins
git clone https://github.com/philrz/zed-datasource.git $HOME/grafana-plugins/zed
- Build the plugin
cd $HOME/grafana-plugins/zed
yarn install
yarn dev
- Start Grafana, while setting the necessary config variables to point to the plugin directory
/usr/local/opt/grafana/bin/grafana-server \
    --config /usr/local/etc/grafana/grafana.ini \
    --homepath /usr/local/opt/grafana/share/grafana \
    --packaging=brew \
    cfg:default.paths.logs=/usr/local/var/log/grafana \
    cfg:default.paths.data=/usr/local/var/lib/grafana \
    cfg:default.paths.plugins="$HOME/grafana-plugins" \
    cfg:default.plugins.allow_loading_unsigned_plugins=grafana-zed-datasource
Grafana should now be listening on http://localhost:3000 and you can login with
username admin and password admin.
Unfortunately, due to CORS, this plugin cannot currently interact with the API for an out-of-the-box Zed lake. Issue zed/4297 tracks the proper enhancement to address this. In the meantime, it's possible to work around the issue by building Zed from the grafana-cors-hack branch.
To compile and start the Zed service:
git clone -b grafana-cors-hack https://github.com/brimdata/zed.git $TMPDIR/zed
cd $TMPDIR/zed
make build
./dist/zed serve -lake scratch
A Zed lake is not a purpose-built time-series database. However, as a general data platform, it can absolutely be used for storage and query of time-series data at moderate scale.
In its current state, the plugin relies on the use of Zed queries that prepare data for easy transformation to the data frames that Grafana ultimately uses for rendering plots. Some best practices that help achieve this:
-
The field used as the timestamp for your time-series data should ideally be your pool key.
With this pool configuration, the time range portion of queries initiated via the Grafana dashboard will scan only the minimal number of data objects in the Zed lake relevant to the query.
-
If possible, use
tsas the name for your timestamp field.This field name matches the "out of the box" default settings for the plugin. However, the plugin can easily be configured to adapt to a different field name.
-
Your time-series data should be of a single shape.
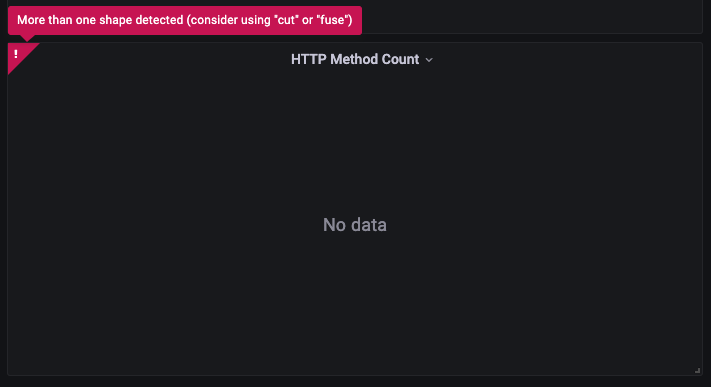
Grafana's columnar data frames need to be constructed with a specific list of expected fields. Therefore the count of shapes returned by a query is first checked by the plugin and an error is shown if more than one shape is detected. If this occurs, the easiest way to address it is likely to use the
cutoperator to trim the set of fields returned by the query or thefuseoperator to combine the entire query result into a single, wider shape. -
Store data in top-level fields of primitive types.
Of the fields in a response to a Zed query, the values passed on to Grafana by the plugin will be top-level fields of Zed's primitive types. If you need to use values from complex types in Grafana, modify your Zed query to make them available as top-level fields, e.g., by using the
putoperator.
Next we'll walk through some real world examples that leverage these best practices.
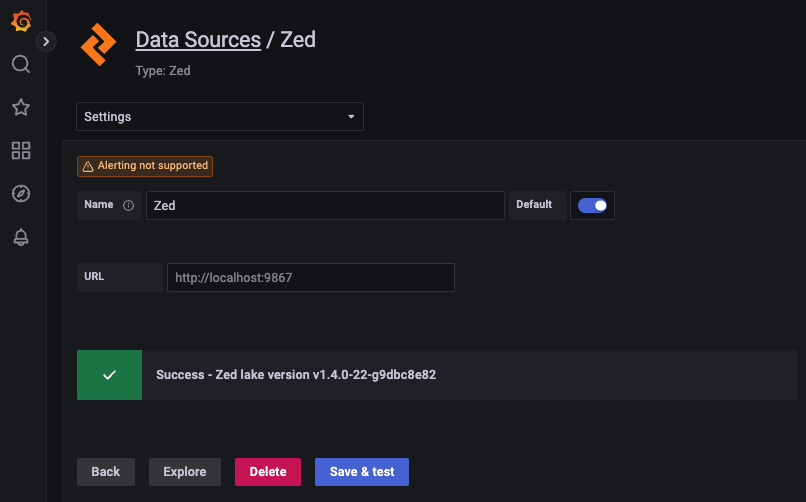
The Zed data source can be added in Grafana via the
Configuration > Data Sources menu. If a lake service is listening locally
on the default TCP port 9867 (as is typical for the lake launched by the
Brim/Zui app or when
zed serve is run by hand) the default URL setting can
be used. If your lake is listening elsewhere (e.g., with Zui Insiders
it's at http://localhost:9988) change the URL setting appropriately. When
Save & test is clicked, the plugin will attempt to return the value from
the lake's /version endpoint. If successful, the version will be shown and
the plugin is ready for use in dashboard panel queries.
As described here, different schema approaches are often used for storing time-series data. The Zed plugin can adapt to multiple approaches, but the Zed query used in the Grafana panel will differ. In each of the following sections we'll plot some sample time-series data to illustrate the concepts.
An example that uses this approach is the Weekly fuel prices (all data) link in the Italian fuel price data that's freely available under the IODL 2.0 license. We'll start by downloading a copy with the English language column headers and peek at the data in its original form.
$ curl -o all_prices.csv \
  -H 'Accept-Language: en-US' \
  'https://dgsaie.mise.gov.it/open_data_export.php?export-id=4&export-type=csv'

$ head -10 all_prices.csv
SURVEY_DATE,PRODUCT_ID,PRODUCT_NAME,PRICE,VAT,EXCISE,NET,CHANGE
2005-01-03,1,"Euro-Super 95",1115.75,185.96,558.64,371.15,-1.57
2005-01-03,2,"Automotive gas oil",1018.28,169.71,403.21,445.36,-0.33
2005-01-03,3,"Heating gas oil",948.5,158.08,403.21,387.21,-22.55
2005-01-03,5,LPG,552.5,92.08,156.62,303.8,0.22
2005-01-03,6,"Residual fuel oil",553.25,50.3,166.84,336.11,-12.21
2005-01-03,8,"Heavy fuel oil",229.52,0,31.39,198.13,-5.37
2005-01-10,1,"Euro-Super 95",1088,181.33,558.64,348.03,-27.75
2005-01-10,2,"Automotive gas oil",1004.39,167.4,403.21,433.78,-13.89
2005-01-10,3,"Heating gas oil",947.94,157.99,403.21,386.74,-0.56
Per the approach, we see that the date stamp is repeated for the measurement of
each of the six different fuel types. Also, being CSV data, this date field
begins life as a mere string and therefore should be transformed to the Zed
time type as we store it in the lake. This will allow the values
to be used in time range selections in Grafana that will then be used in the
generated Zed queries that gather points for plotting.
Taking this into account, we'll perform some preprocessing with zq to
prepare the timestamp field and also isolate a subset of the fields, then
ultimately load the data into a pool in our Zed lake. For convenience, we'll
use ts as the name of the transformed time field since this is the plugin's
default.
$ zed create prices1
pool created: prices1 2KkHUfmYz7FDdix6WRf7XEjkRfO

$ zq 'cut ts:=time(SURVEY_DATE),PRODUCT_NAME,PRICE' all_prices.csv \
  | zed -use prices1 load -
(2/1) 75.95KB 75.95KB/s
2KkHZEIfCdlCQJcgO9TAGT8cNpz committed
Reading back a sampling of our data, we can see the successful transform.
$ zed query -Z 'from prices1 | sample'
{
    ts: 2023-01-16T00:00:00Z,
    PRODUCT_NAME: "Automotive gas oil",
    PRICE: 1863.68
}
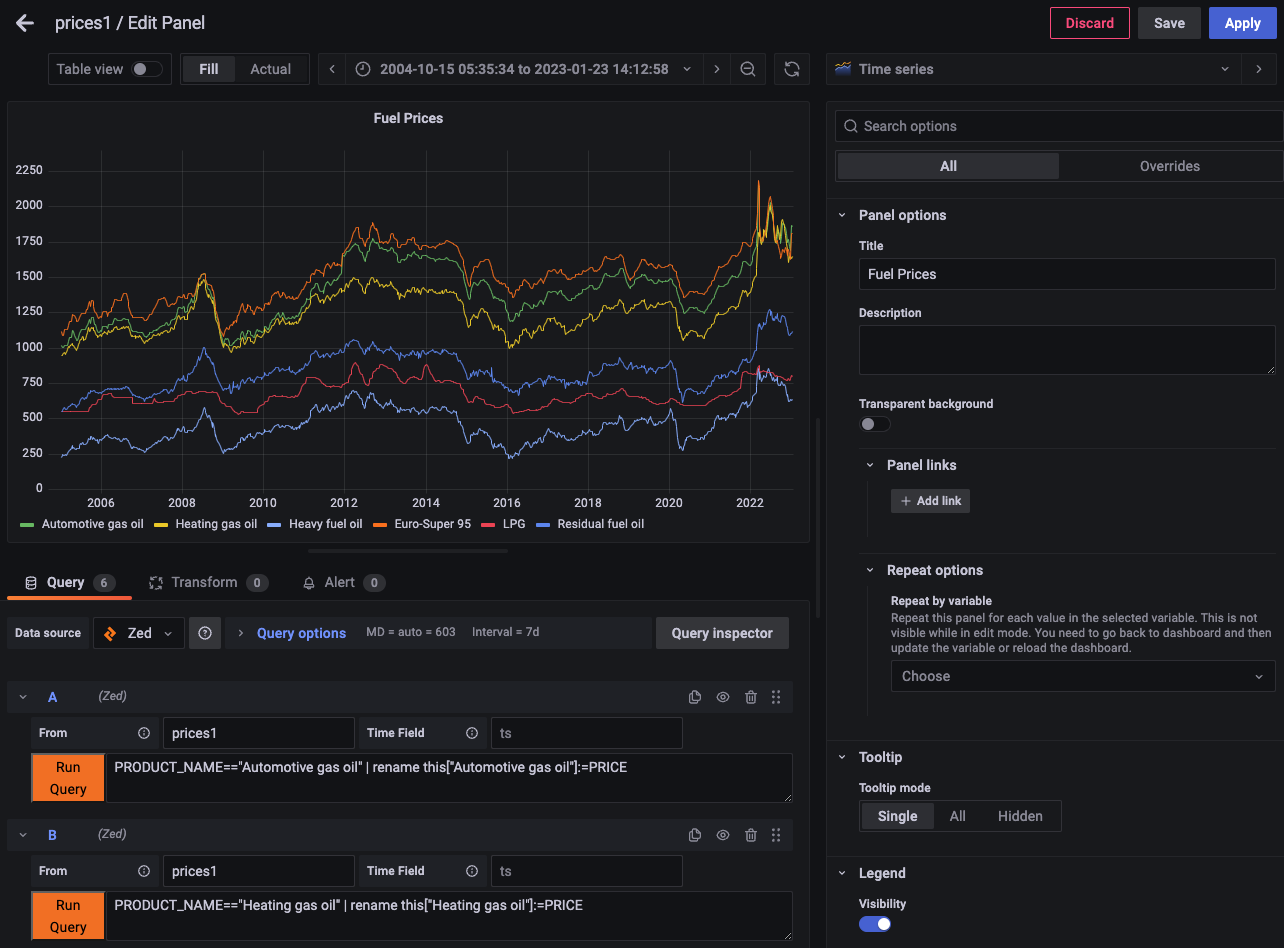
To plot the data for all six fuel types in the same panel, we can construct
six queries, each of which filters by category. Since the legend would
otherwise show "PRICE" for all six, we'll use Zed's
rename operator to
assign a unique field name for each before the data is handed off to Grafana.
Because we want to construct field names with spaces, we use
field dereferencing with indexing.
Below is an example of one of the six queries, followed by the completed panel shown in Grafana.
PRODUCT_NAME=="Automotive gas oil" | rename this["Automotive gas oil"]:=PRICE
If our data happens to be in the format with multiple metrics per row, it becomes easy to plot with a single query. We can observe this by working with the data in the Weekly fuel prices link at the same page we just used.
$ curl -o prices2.csv \
  -H 'Accept-Language: en-US' \
  'https://dgsaie.mise.gov.it/open_data_export.php?export-id=1&export-type=csv'

$ head -4 prices2.csv
SURVEY_DATE,EURO-SUPER_95,AUTOMOTIVE_GAS_OIL,LPG,HEATING_GAS_OIL,RESIDUAL_FUEL_OIL,HEAVY_FUEL_OIL
2005-01-03,1115.75,1018.28,552.5,948.5,553.25,229.52
2005-01-10,1088,1004.39,552.57,947.94,554.22,238.37
2005-01-17,1088.14,1004.31,551.88,952.42,562.78,245.89
As we see, there's now a separate column in the CSV file for each category of fuel
and each row of measurements appears with a single, shared date stamp. We'll
create a separate pool and once again transform the date stamp to a Zed time
field as we load it into our lake.
$ zed create prices2
pool created: prices2 2KkJGc9sgl2T7eq5rB0WSff26IV

$ zq 'rename ts:=SURVEY_DATE | ts:=time(ts)' prices2.csv \
  | zed -use prices2 load -
(2/1) 30.29KB 30.29KB/s
2Kbf3eLGvItvbxLA2TMQyaCab2W committed

$ zed query -Z 'from prices2 | head 1'
{
    ts: 2023-01-16T00:00:00Z,
    "EURO-SUPER_95": 1813.58,
    AUTOMOTIVE_GAS_OIL: 1863.68,
    LPG: 799.71,
    HEATING_GAS_OIL: 1651.57,
    RESIDUAL_FUEL_OIL: 1120.82,
    HEAVY_FUEL_OIL: 636.78
}
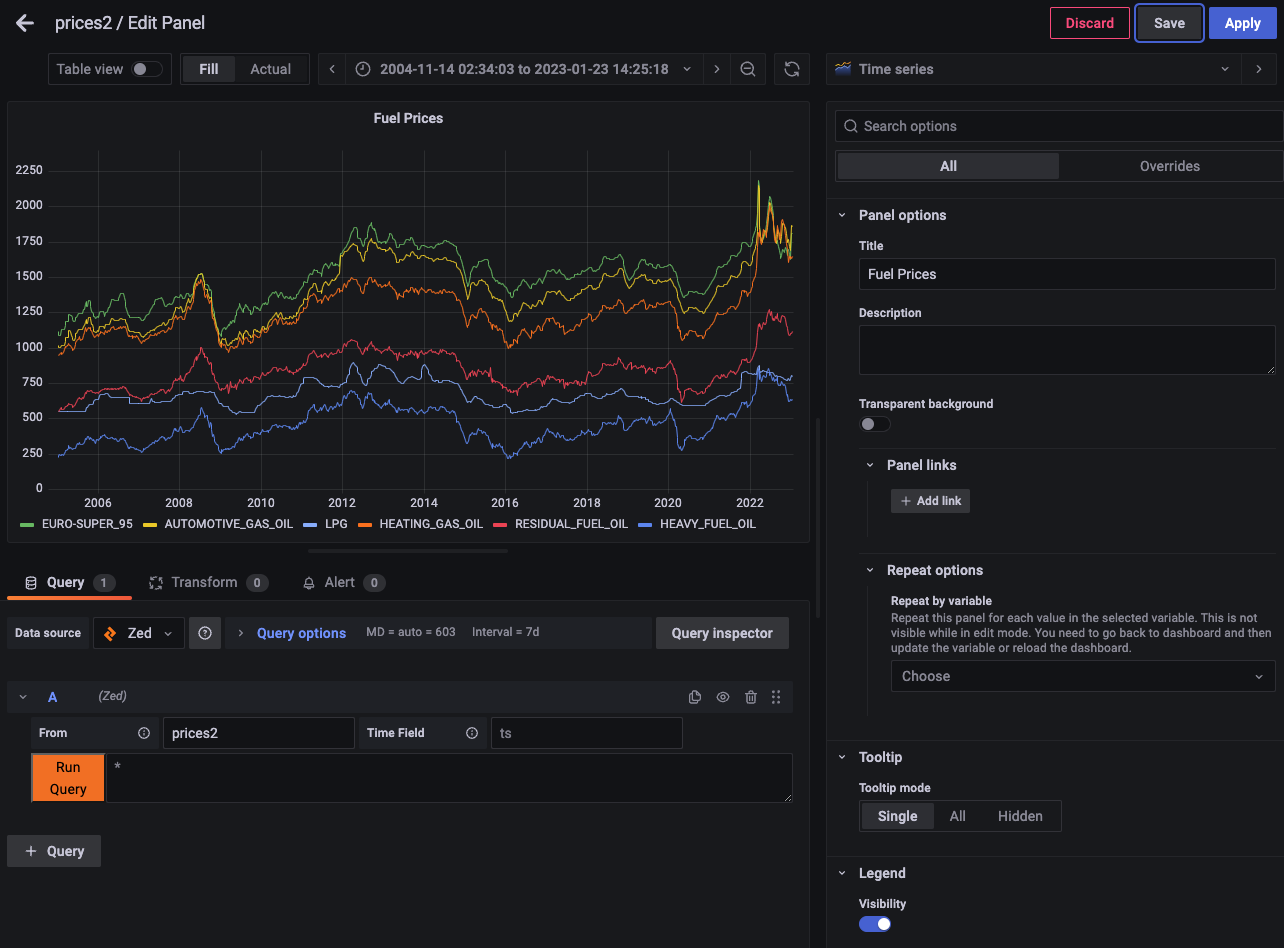
Because Grafana defaults to plotting all numeric fields, all six appear on our
chart if we let the plugin use its default Zed query (*) that pulls all points
from the pool. The only setting we had to change in our panel configuration was
to specify the pool name "prices2".
If we wanted prettier names in the legend, we could add a Zed query to our panel config such as:
rename this["Euro Super 95"] := this["EURO-SUPER_95"],
       this["Automotive Gas Oil"] := this["AUTOMOTIVE_GAS_OIL"],
       this["Heating Gas Oil"] := this["HEATING_GAS_OIL"],
       this["Residual Fuel Oil"] := this["RESIDUAL_FUEL_OIL"],
       this["Heavy Fuel Oil"] := this["HEAVY_FUEL_OIL"]
Now that we've seen the second approach makes it easier to plot, if you find yourself with data that's already stored using the first approach, you could use Zed like what's shown below to transform to the second approach. This idiom could be used to preprocess the data before loading it into yet another pool or you could use it as part of a Zed query in your Grafana panel config.
$ zed query -Z 'from prices1
                | map(|{PRODUCT_NAME:PRICE}|) by ts
                | over map with time=ts => (
                  yield {key:[key],value}
                  | collect(this)
                  | yield collect
                  | unflatten(this)
                  | put ts:=time
                )'

{
    LPG: 799.71,
    "Euro-Super 95": 1813.58,
    "Heavy fuel oil": 636.78,
    "Heating gas oil": 1651.57,
    "Residual fuel oil": 1120.82,
    "Automotive gas oil": 1863.68,
    ts: 2023-01-16T00:00:00Z
}
...
In the future this functionality may be made available in more succinct Zed syntax. Issue zed/4332 tracks this enhancement.
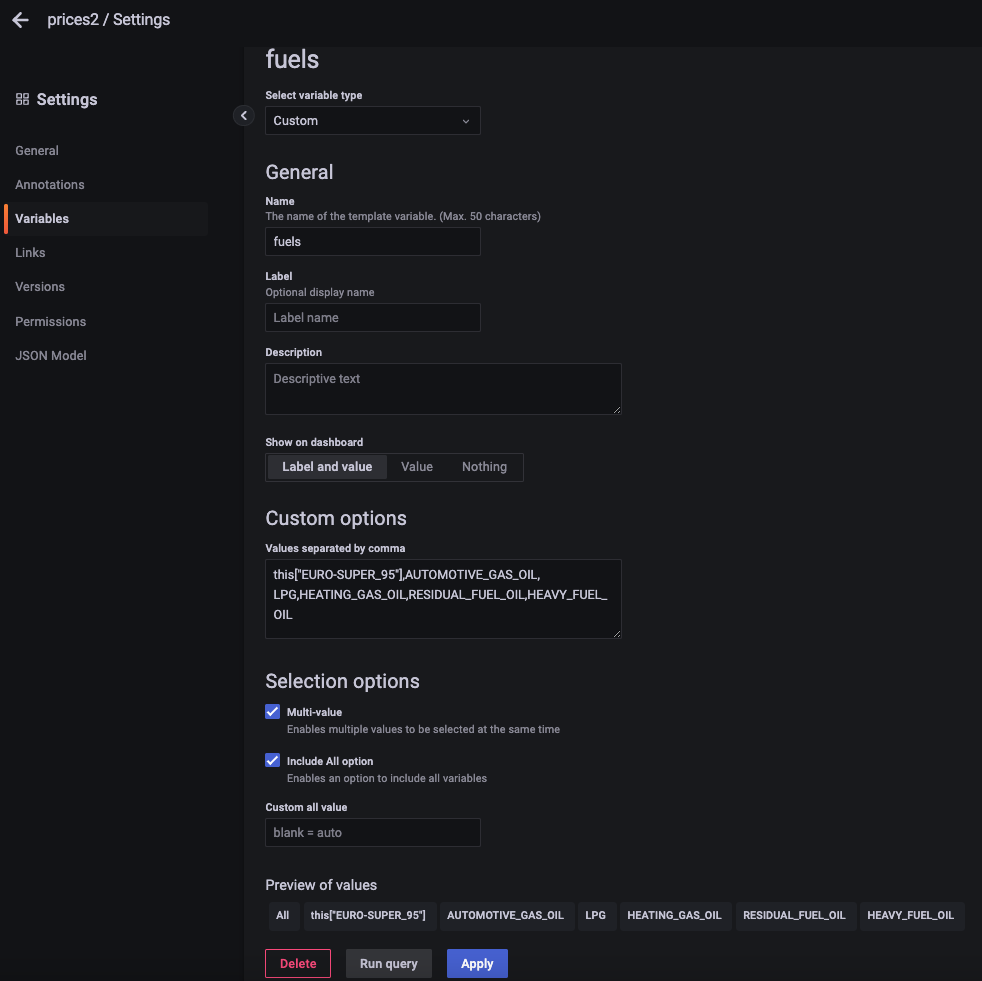
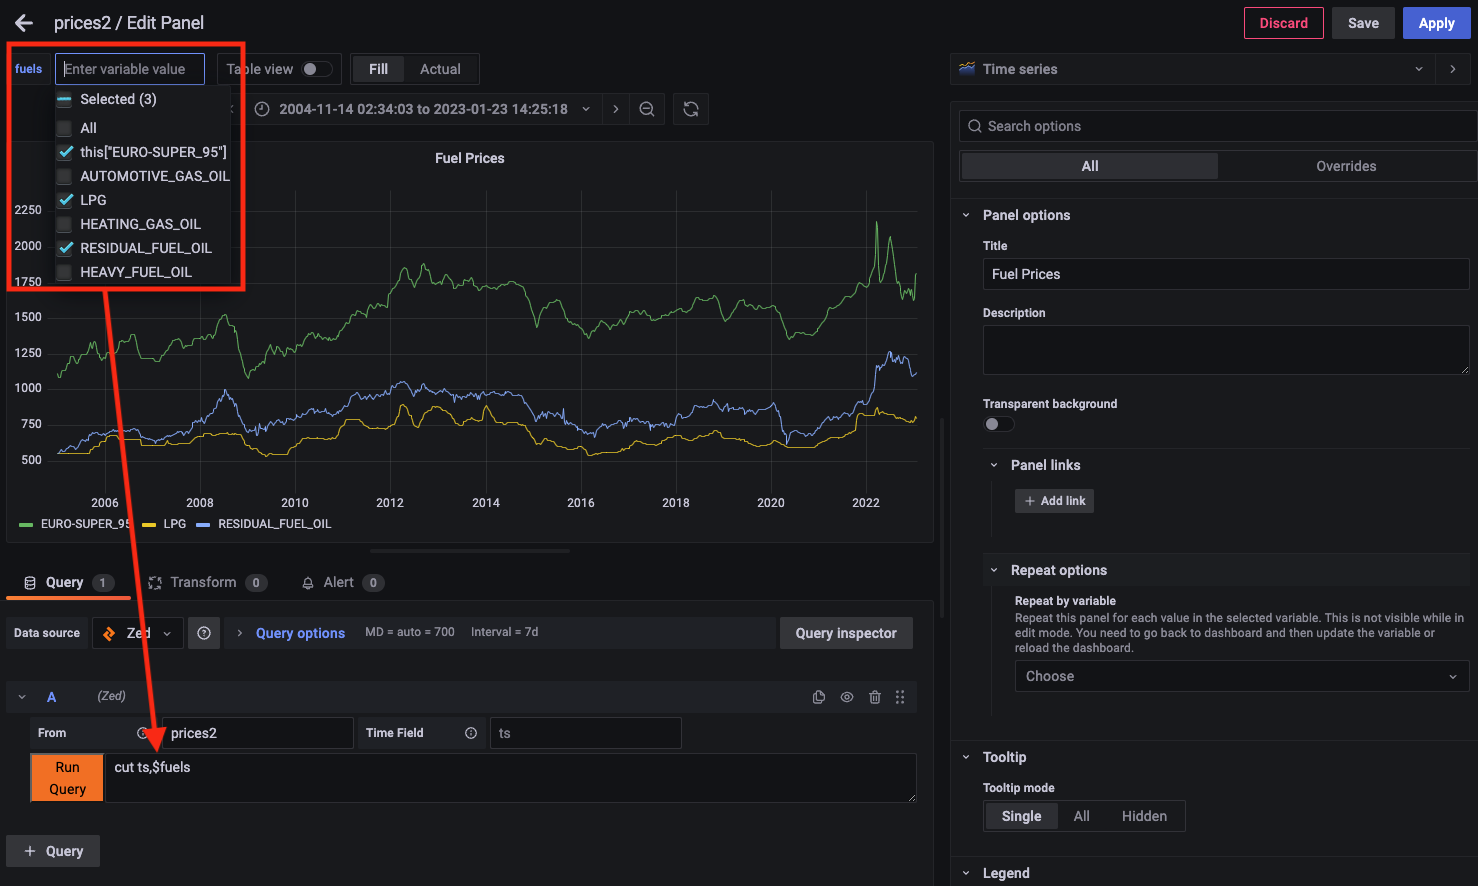
The plugin does not yet support query variables to populate dashboard variables with values pulled from a pool using Zed queries. However, in the meantime, queries in panels can use variables made up of custom values defined in the dashboard settings as long as the set of picked values can be expanded into syntactically correct Zed.
Building on our prior example, here we've defined a multi-value variable called "fuels" made up of the six categories of our data.
Returning to our dashboard, we now can enter a Zed query that uses
cut operator to
isolate only the timestamp field and variable reference that expands into a
comma-separated field list required by cut. Notice that we once again made
use of field dereferencing with indexing
for the field EURO-SUPER_95 since it can't be referenced as an identifier due
to its use of the character -.
The examples shown thus far assume that all points in the selected time range
should be plotted at their precise values. However, in practice, screen width
and/or volume of data may make this undesirable or impossible. In these
situations it's typical to summarize
time-bucketed sets of points into single values that can populate a smaller
number of pixels rendered in a chart. This summarization is done by applying
an aggregate function such
as avg(),
min(),
max(),
count(), or
sum() to each set of
raw points.
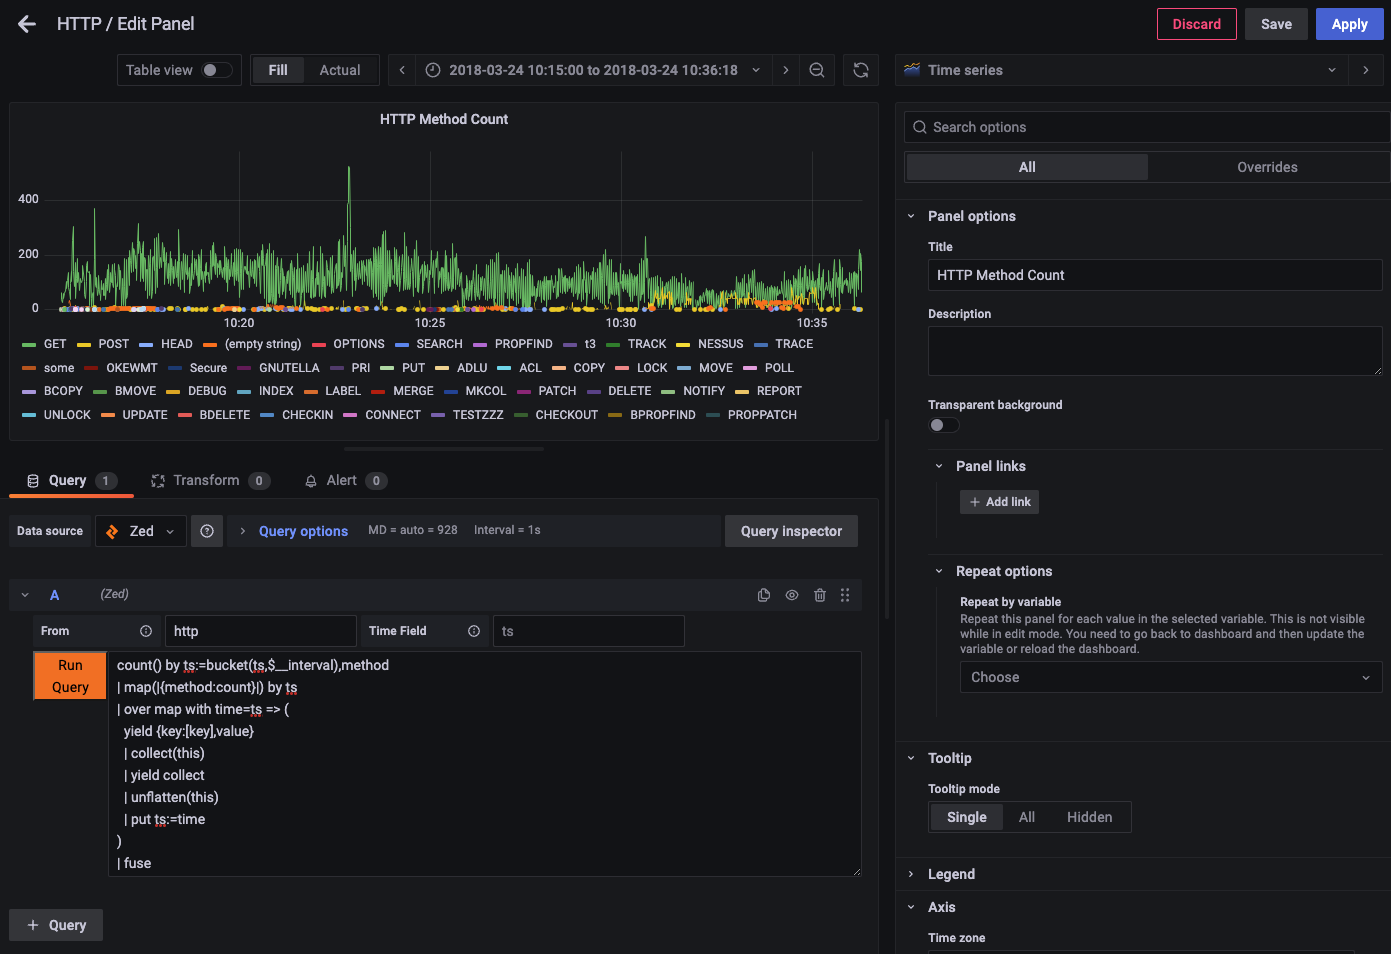
To illustrate this example, we'll use a data source of logged HTTP traffic found in the zed-sample-data repository. In our example we'll plot the count of HTTP methods in observed requests over time.
In the query we'll construct, the use of Grafana's built-in
$__interval
variable is essential. The value for this variable is changed automatically by
Grafana based on the current plot width and slides easily into the span
parameter of Zed's bucket() function.
We'll once again start by creating a pool and loading our raw test data. Since
this data already has a time-typed field called ts, we don't need to
perform the same preprocessing of the timestamp we did previously.
$ zed create http
pool created: http 2KkaG0Ms5mNM68kwXYbSj8tRciG

$ zq "get https://github.com/brimdata/zed-sample-data/blob/main/zeek-default/http.log.gz?raw=true" \
  | zed -use http load -
(1/1) 8.30MB 8.30MB/s
2KbzmcybYySkykAkYxTdYsNbL5o committed
Below is our example aggregation query, followed by the completed panel shown in Grafana.
count() by ts:=bucket(ts,$__interval),method
| map(|{method:count}|) by ts
| over map with time=ts => (
  yield {key:[key],value}
  | collect(this)
  | yield collect
  | unflatten(this)
  | put ts:=time
)
| fuse
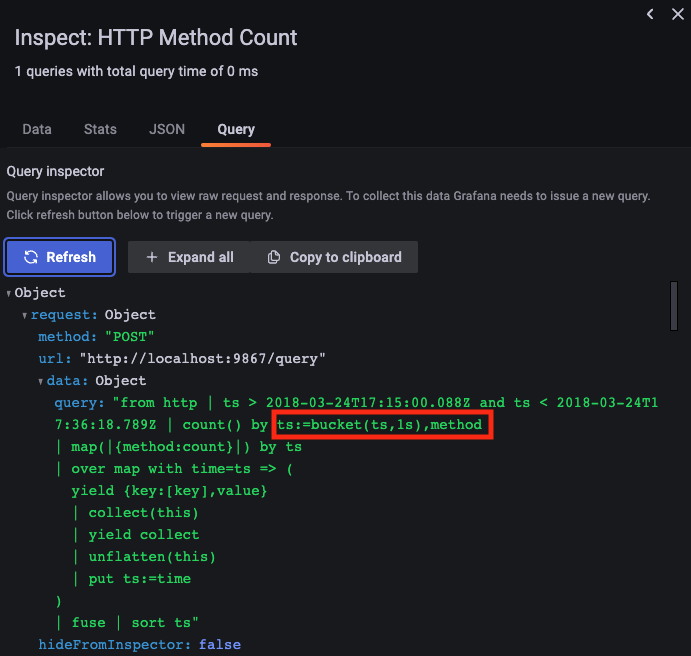
To see the effect of the $__interval variable, click the Query Inspector
button and click Refresh on the Query tab. Here we can see the full
query assembled by the plugin that was sent to the Zed lake API based on the
current panel settings. We can see that the $__interval variable was
replaced with a duration string 1s that reflects 1-second time buckets.
If you zoom in/out to change the current time range for the plot and recheck
the Query Inspector, you'll see this value change.
To understand what the rest of the Zed is doing, let's look at a sample of data from outside Grafana starting with just the aggregation.
$ zed query -z 'from http
                | count() by ts:=bucket(ts,1s),method
                | sort ts'

{ts:2018-03-24T17:15:20Z,method:"GET",count:63(uint64)}
{ts:2018-03-24T17:15:20Z,method:"POST",count:1(uint64)}
{ts:2018-03-24T17:15:20Z,method:"PUT",count:1(uint64)}
{ts:2018-03-24T17:15:20Z,method:"OPTIONS",count:1(uint64)}
{ts:2018-03-24T17:15:21Z,method:"HEAD",count:1(uint64)}
{ts:2018-03-24T17:15:21Z,method:"GET",count:35(uint64)}
{ts:2018-03-24T17:15:21Z,method:"PRI",count:1(uint64)}
...
Two things stand out here:
-
The timestamps are repeated in what's effectively the one row per metric approach discussed above. For this reason in the next several lines of Zed we reuse the idiom shown previously to transform to the approach that consolidates all metrics for a timestamp into the same row.
-
The HTTP methods vary per timestamp, which is different from what we saw with the fuel data where we always saw the same six fuel categories reported for every timestamp. For this reason we apply
fuseat the end of our Zed to widen each record returned in the query response and addnullvalues for methods that did not appear during a time interval. If we'd skipped thefusewe'd be attempting to plot multiple shapes and the plugin would kick back an error message (try it!)
Applying our full query and looking at a few lines of output, we can see the effect.
$ zed query -Z 'from http
                | count() by ts:=bucket(ts,1s),method
                | map(|{method:count}|) by ts
                | over map with time=ts => (
                  yield {key:[key],value}
                  | collect(this)
                  | yield collect
                  | unflatten(this)
                  | put ts:=time
                )
                | fuse
                | sort ts'

{
    POST: 1 (uint64),
    ts: 2018-03-24T17:15:20Z,
    GET: 63 (uint64),
    HEAD: null (uint64),
...
You may notice lots of "dots" in the screenshot above, which are indicative of the
sparse appearance of rarely-used HTTP methods surrounded by many null points.
To consider options for representing such data, refer to Grafana's
documentation for the
connect null values
setting.
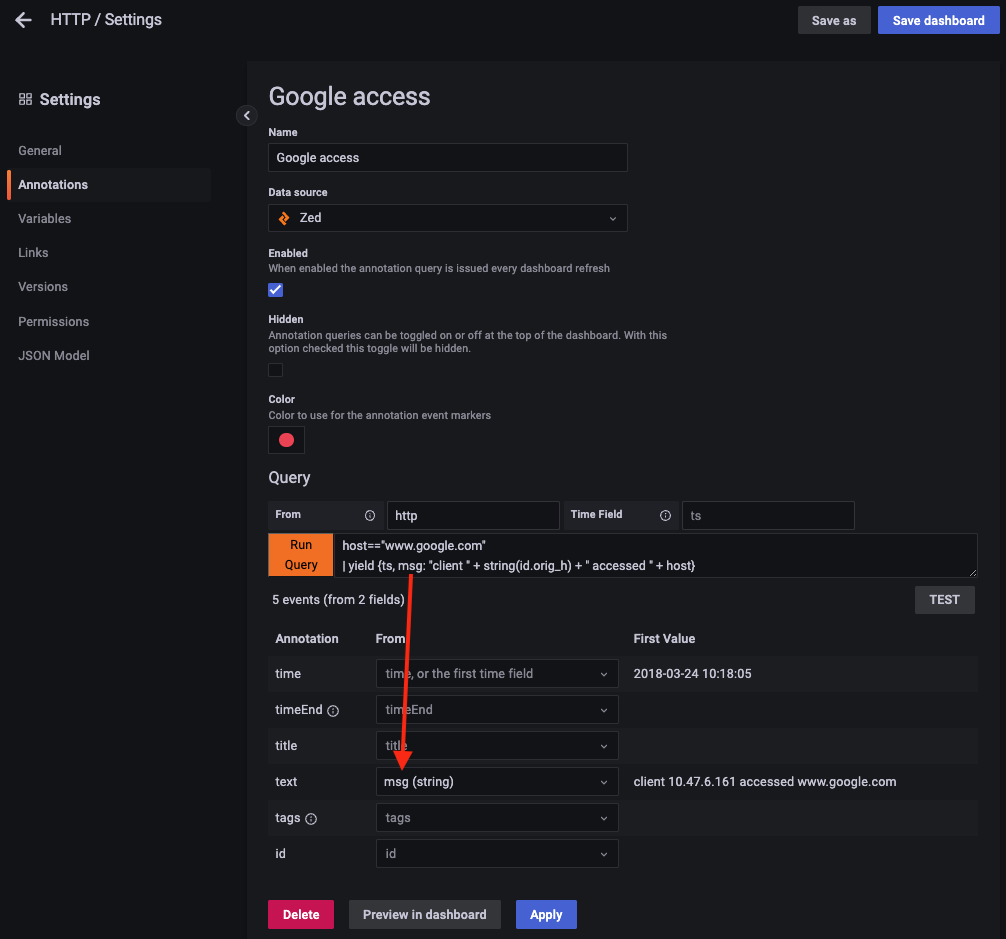
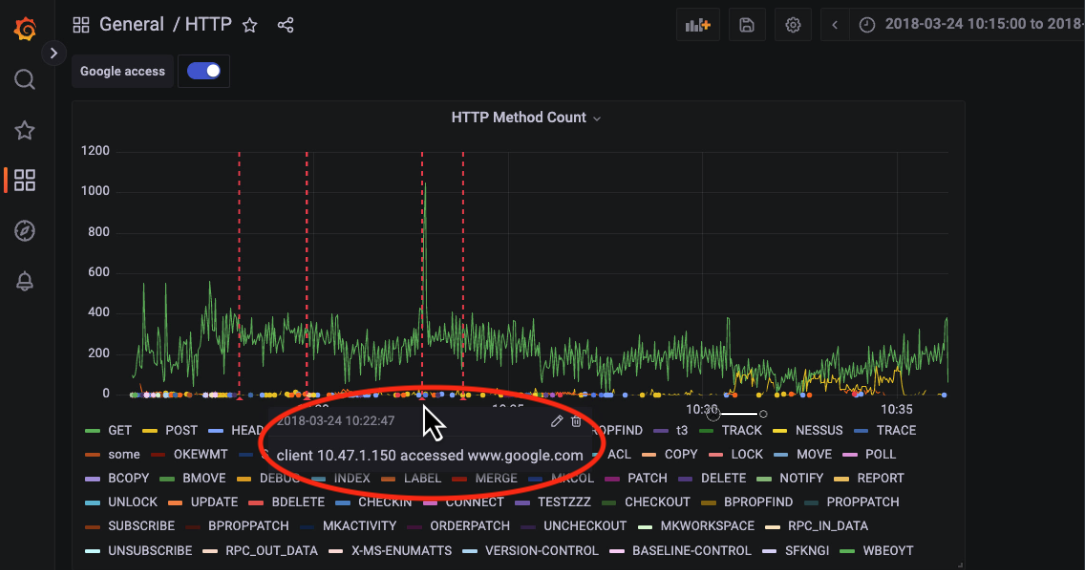
Grafana's annotations feature can be used to overlay details pulled from a Zed lake onto a time-series plot.
As an example that builds on top of our plot of counted HTTP methods, the
following query creates a custom timestamped field called msg that populates
an annotation marking each time a user accessed the Google web site.
host=="www.google.com"
| yield {ts, msg: "client " + string(id.orig_h) + " accessed " + host}
When we refresh our dashboard panel and hover the mouse pointer over the red marker at the bottom of each dotted vertical line, we can see the custom message.
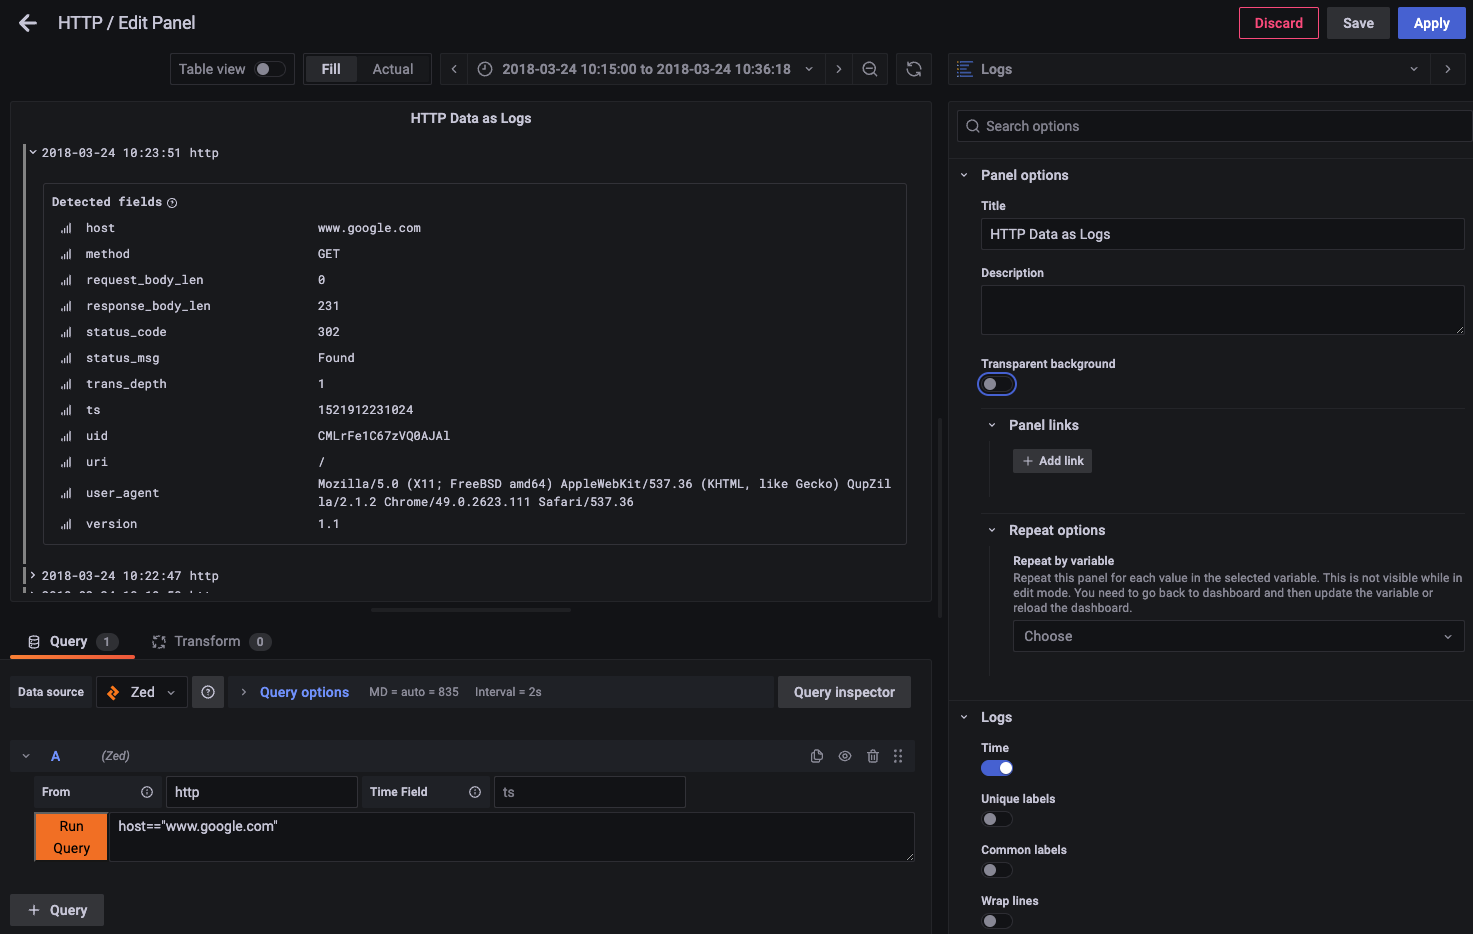
Due to the previously-described limitations with only handling top-level fields of primitive Zed types, the plugin is probably not well-suited for general use with Grafana's Logs panel. However, the plugin is configured to permit this and you may find it useful for examining string-based fields.
In this example we create a simple logs panel that shows the details of the HTTP events for accessing the Google web site that we used as the basis for our annotations query.
When things are going wrong, the first thing to check is for an alert shown when you hover the mouse pointer over a red triangle in the upper-left corner of a panel. The errors you may see here are described in this README and should be self-explanatory.
If you can't make sense of the error message, you may find it helpful to look
in Grafana's Query Inspector as shown above.
The assembled query shown can then be executed outside of Grafana using
zed query or in the Brim/Zui app to narrow down if it's a problem with how
the query is constructed or if it's a bug/limitation in the plugin or Grafana.
If you're still stuck, come talk to us on the #grafana channel on the
Brim public Slack or
open an issue.
Contributions are welcomed! If you need some tips on getting started, this plugin was written while following the Grafana documentation to build a data source plugin. Per common practice, please open an issue before sending a pull request. If you think your ideas might benefit from some refinement via Q&A, come talk to us on Slack.
Join our public Slack workspace for announcements, Q&A, and to trade tips!
