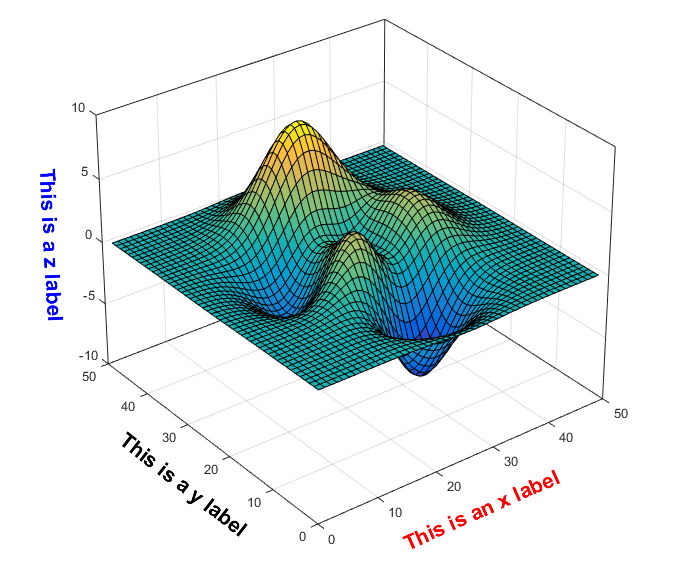
This is a simple MATLAB function for axis label alignment. If you have ever struggled with the label alignment issue in MATLAB's 3-D plots --- by default axis labels are placed horizontally no matter how you rotate the plot --- here is a simple fix.
It still works when Projection mode is Perspective or when DataAspectRatio is not [1 1 1].
-
align_axislabel: it rotates$x$ ,$y$ and$z$ labels to the direction of their corresponding axes and moves the labels to a proper distance from the axes; -
align_axislabel_log: supports log-scale in$z$ axis; -
axislabel_rotation: it performs rotation only; -
axislabel_rotation_angle: it computes the angles of$x$ ,$y$ and$z$ labels to be rotated properly (without performing the actual rotation); -
axislabel_translation: it moves axis labels to a proper distance from the axes; -
axislabel_translation_slider: a GUI slider for setting parametersAXISALIGN_TRANS_AandAXISALIGN_TRANS_B.
Label alignment plus GUI slider:
z = peaks;
figure('color', [1 1 1])
surf(z);
set(gca, 'dataaspectratio', [1 1 0.5], 'projection', 'perspective', 'box', 'on')
xlabel('This is an x label', 'fontsize', 16, 'fontweight', 'bold', 'color', [1 0 0])
ylabel('This is a y label', 'fontsize', 16, 'fontweight', 'bold', 'color', [0 0 0])
zlabel('This is a z label', 'fontsize', 16, 'fontweight', 'bold', 'color', [0 0 1])

% Add the following after you plot your figures
h = rotate3d;
set(h, 'ActionPreCallback', 'set(gcf,''windowbuttonmotionfcn'',@align_axislabel)')
set(h, 'ActionPostCallback', 'set(gcf,''windowbuttonmotionfcn'','''')')
set(gcf, 'ResizeFcn', @align_axislabel)
align_axislabel([], gca)
axislabel_translation_slider;
If you would like to see immediate effect, set align_axislabel as the WindowButtonMotionFcn (callback) of the current figure. You might only want to do this after you clicked your mouse and started rotating the plot. Here's an example:
figure;
axes('box','on','dataaspectratio',[1 1 1],'projection','perspective');
xlabel('This is an x label')
ylabel('This is a y label')
zlabel('This is a z label')

h = rotate3d;
set(h, 'ActionPreCallback', 'set(gcf,''windowbuttonmotionfcn'',@align_axislabel)')
set(h, 'ActionPostCallback', 'set(gcf,''windowbuttonmotionfcn'','''')')
Simply add the last three lines after your own plot. You need to rotate it first to see the effect, or manually call align_axislabel([], gca).
If you set align_axislabel as ActionPostCallback, you will only see the effect after you release the left button of your mouse (after you finished rotating the plot):
h = rotate3d;
set(h,'ActionPostCallback',@align_axislabel)
If you think the labels are placed either too close to or far away from the axes, add this (after setting those callbacks):
axislabel_translation_slider;
See demo.m for more information.
