-
Clone the repository
https://github.com/GoogleCloudPlatform/microservices-demo.git -
CD into the cloned repository on your local machine and create an EKS cluster
eksctl create cluster -
Run the following command to create the resources in the kubernetes-manifests.yaml file
kubectl apply -f ./release/kubernetes-manifests.yaml

-
Check pods
kubectl get pods

-
List all the services in the currently active Kubernetes context
kubectl get service -
Deploy the Metrics Server with the following command
kubectl apply -f https://github.com/kubernetes-sigs/metrics-server/releases/latest/download/components.yaml

-
Verify that the metrics-server deployment is running the desired number of pods with the following command
kubectl get deployment metrics-server -n kube-system

-
Add prometheus Helm repo
helm repo add prometheus-community https://prometheus-community.github.io/helm-charts -
Add grafana Helm repo
helm repo add grafana https://grafana.github.io/helm-charts -
Create a prometheus namespace
kubectl create namespace prometheus -
Upgrade or install the Prometheus chart in the prometheus namespace, and set the storage class for both the Alertmanager and the Prometheus server to gp2
helm install prometheus prometheus-community/prometheus \
    --namespace prometheus \
    --set alertmanager.persistentVolume.storageClass="gp2" \
    --set server.persistentVolume.storageClass="gp2"
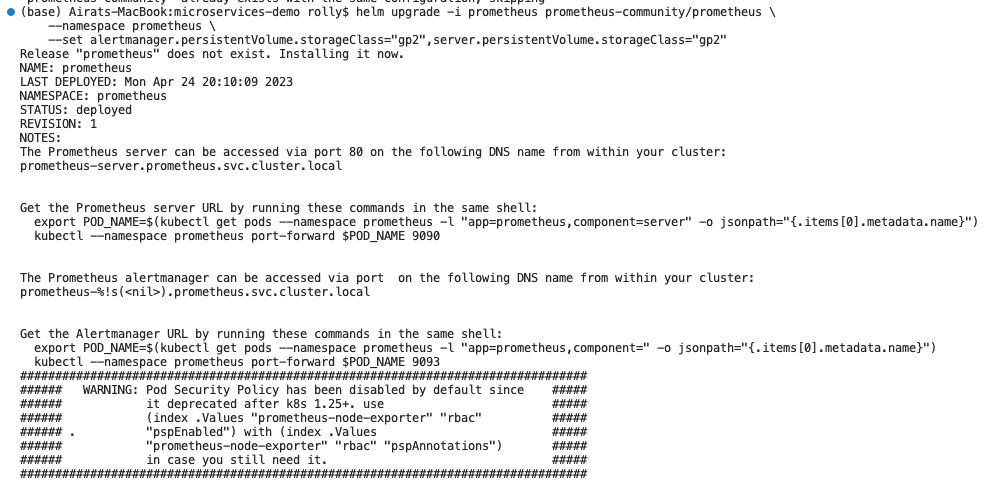
- Check if Prometheus components deployed as expected
kubectl get all -n prometheus

If you notice that the prometheus server and alertmanager are stuck on pending, continue the following
- Create an IAM role and service account for the EBS CSI driver in the kube-system namespace of an EKS cluster, attach the AmazonEBSCSIDriverPolicy IAM policy to the role, and approves the creation of the resources
eksctl create iamserviceaccount \
  --name ebs-csi-controller-sa \
  --namespace kube-system \
  --cluster scrumptious-painting-1682361990 \
  --attach-policy-arn arn:aws:iam::aws:policy/service-role/AmazonEBSCSIDriverPolicy \
  --approve \
  --role-only \
  --role-name AmazonEKS_EBS_CSI_DriverRole

-
You’ll get an error after this, then run the following command to set the oidc_id variable to the value of the OIDC issuer URL for your EKS cluster.
oidc_id=$(aws eks describe-cluster --name scrumptious-painting-1682361990 --query "cluster.identity.oidc.issuer" --output text | cut -d '/' -f 5)

-
Create an IAM OIDC identity provider for your cluster with the following command. Replace my-cluster with your own value
eksctl utils associate-iam-oidc-provider --cluster scrumptious-painting-1682361990 --approve -
Install the
aws-ebs-csi-driver add-on, which is used to provide persistent storage for Kubernetes applications running on EKSeksctl create addon --name aws-ebs-csi-driver --cluster scrumptious-painting-1682361990 --service-account-role-arn arn:aws:iam::556298987240:role/AmazonEKS_EBS_CSI_DriverRole --force

-
Retrieve information about the status of an add-on on an Amazon EKS cluster
eksctl get addon --name aws-ebs-csi-driver --cluster scrumptious-painting-1682361990

-
List all Kubernetes resources in the "prometheus" namespace. Alertmanager and prometheus server should be in the Running state now
kubectl get all -n prometheus

-
Forward traffic from a local port (9090) to the port 9090 of the Prometheus server pod in the "prometheus" namespace. Go to
http://localhost:9090
kubectl port-forward -n prometheus prometheus-server-77df547d88-rk425 9090:9090

-
Create a grafana directory and grafana.yaml file
datasources:
  datasources.yaml:
    apiVersion: 1
    datasources:
    - name: Prometheus
      type: prometheus
      url: http://prometheus-server.prometheus.svc.cluster.local
      access: proxy
      isDefault: true
-
Update the url in the grafana file
http://prometheus-server.prometheus.svc.cluster.local -
Create a grafana namespace
kubectl create namespace grafana -
Install Grafana on the EKS cluster using Helm
helm install grafana grafana/grafana \
    --namespace grafana \
    --set persistence.storageClassName="gp2" \
    --set persistence.enabled=true \
    --set adminPassword='EKS!sAWSome' \
    --values /Users/rolly/Desktop/Learning/ACMP/microservices-demo/grafana/grafana.yaml \
    --set service.type=LoadBalancer
-
Run the following command to check if Grafana is deployed properly
kubectl get all -n grafana -
You can get Grafana ELB URL using this command. Copy & Paste the value into browser to access Grafana web UI.
export ELB=$(kubectl get svc -n grafana grafana -o jsonpath='{.status.loadBalancer.ingress[0].hostname}')
echo "http://$ELB"
-
This returnses a url -
http://a511a298d293d4bbca8ba1078dba53fb-1978344538.us-east-1.elb.amazonaws.com -
Get the password to login to Grafana
kubectl get secret --namespace grafana grafana -o jsonpath="{.data.admin-password}" | base64 --decode ; echo -
Click '+' button on left panel and select ‘Import’.
-
Enter 3119 dashboard id under Grafana.com Dashboard.
-
Click ‘Load’.
-
Select ‘Prometheus’ as the endpoint under prometheus data sources drop down.
-
Click ‘Import


