This repo contains a python notebook that allows to explore an interpolated grid of intensities
The goal of this repo is to provide an easy to use and interactive tool to explore intensity of a few rays with regard to a few variables.
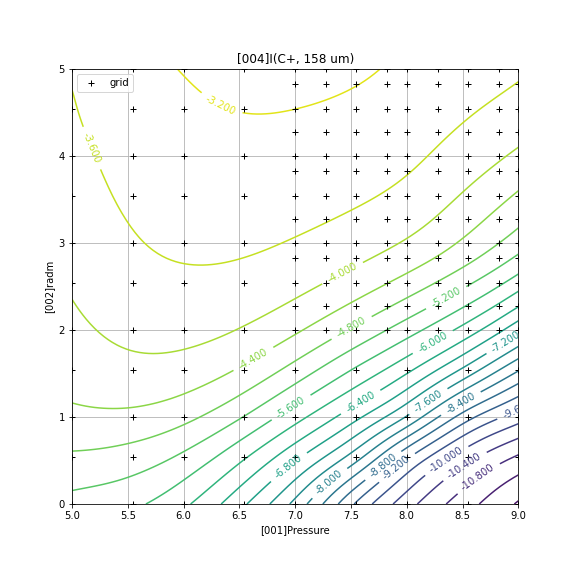
For instance, with the file contained in ./data, one should easely be able to reproduce the following graph :
To use the contour_plots.ipynb notebook, clone the present repository, and then :
cd mis-intensity-isocontours
conda env create -f environment.yml
conda activate contour_plots_env
jupyter notebook
Then open the notebook and run it.
-
all values (for input columns and for intensities) are diplayed in log scale.
-
the interpolation is done using scipy's RBF interpolator (with cubic splines)
-
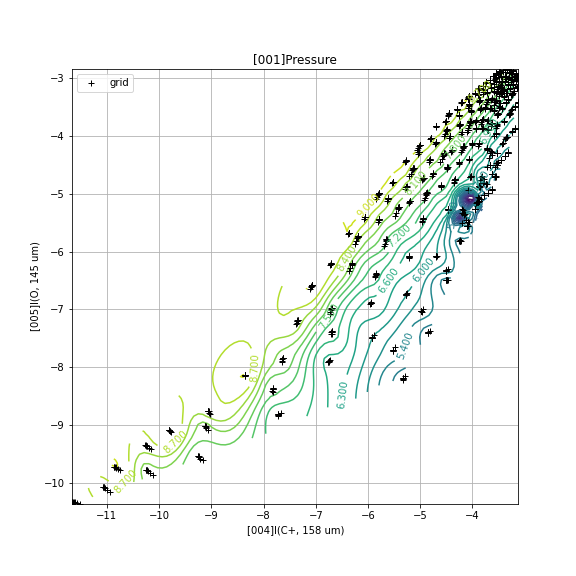
in order not to plot absurd values, plots are restricted to the convex hull formed by the grid. This is not visible when col_x and col_y are set to input parameters, but it is when they are set to intensity rays. For instance :

