minerator-metrics
Visualisations for Minerator using Prometheus/Grafana.
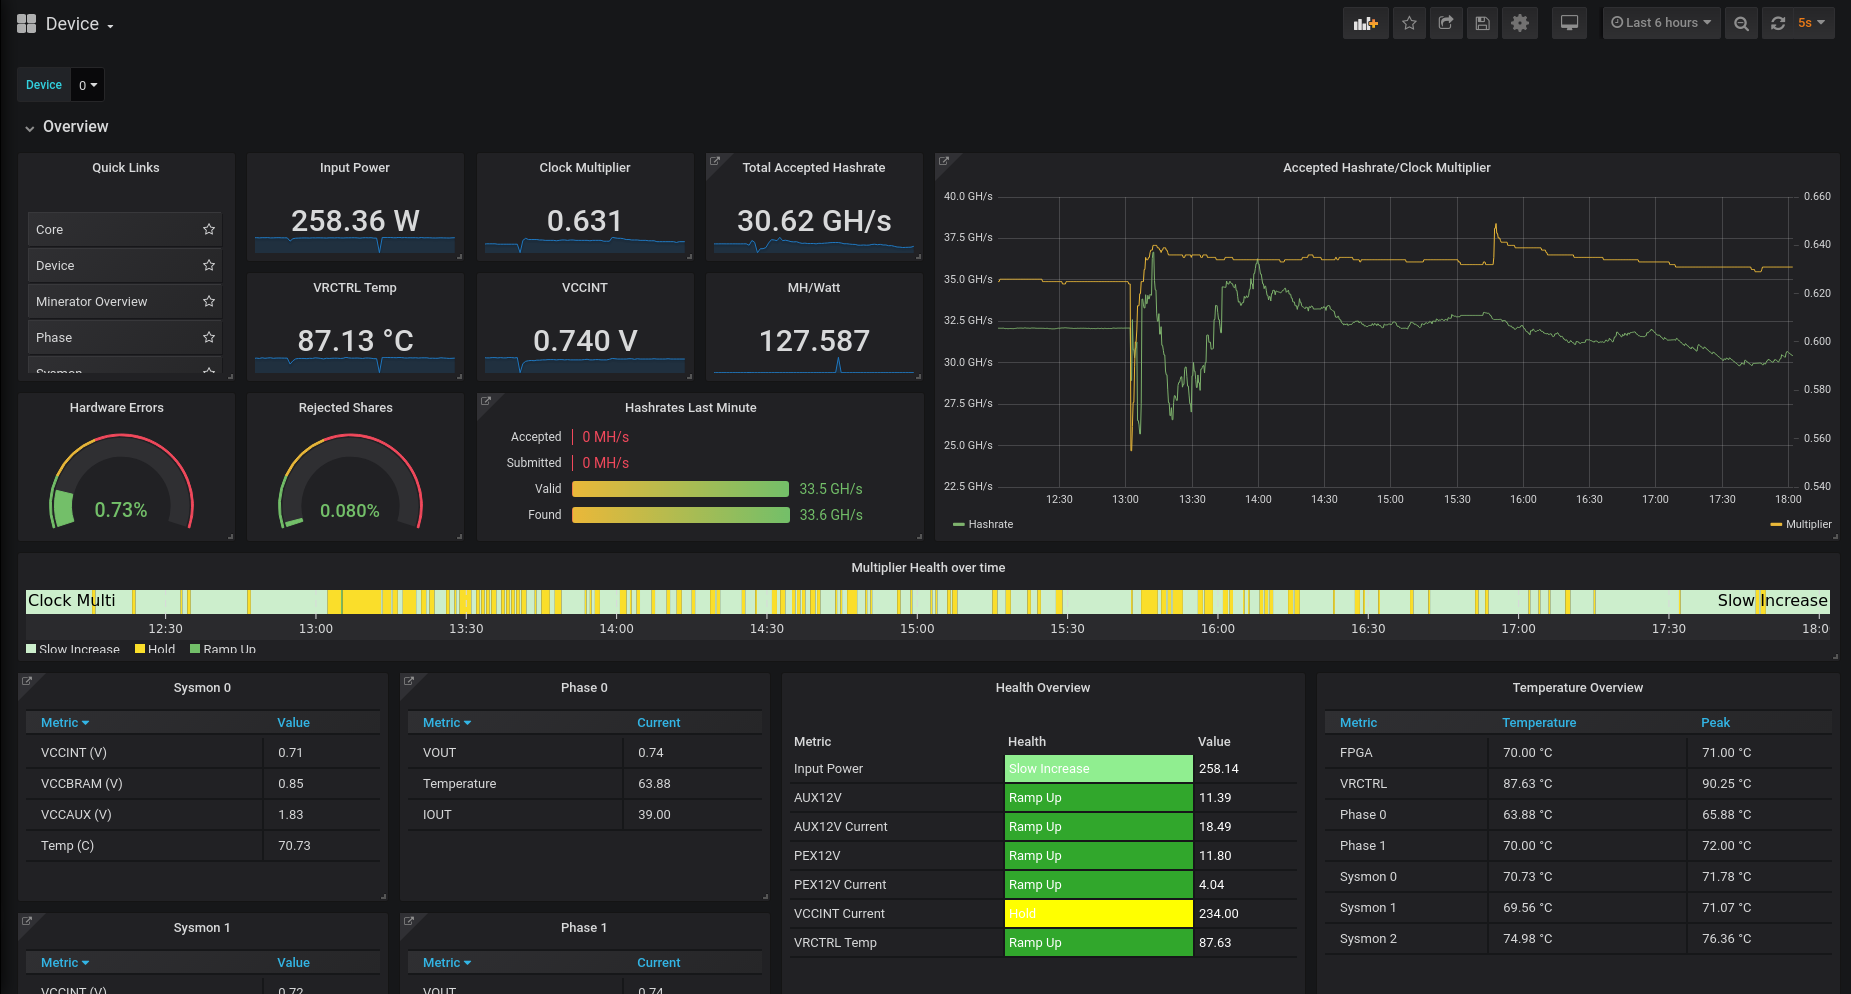
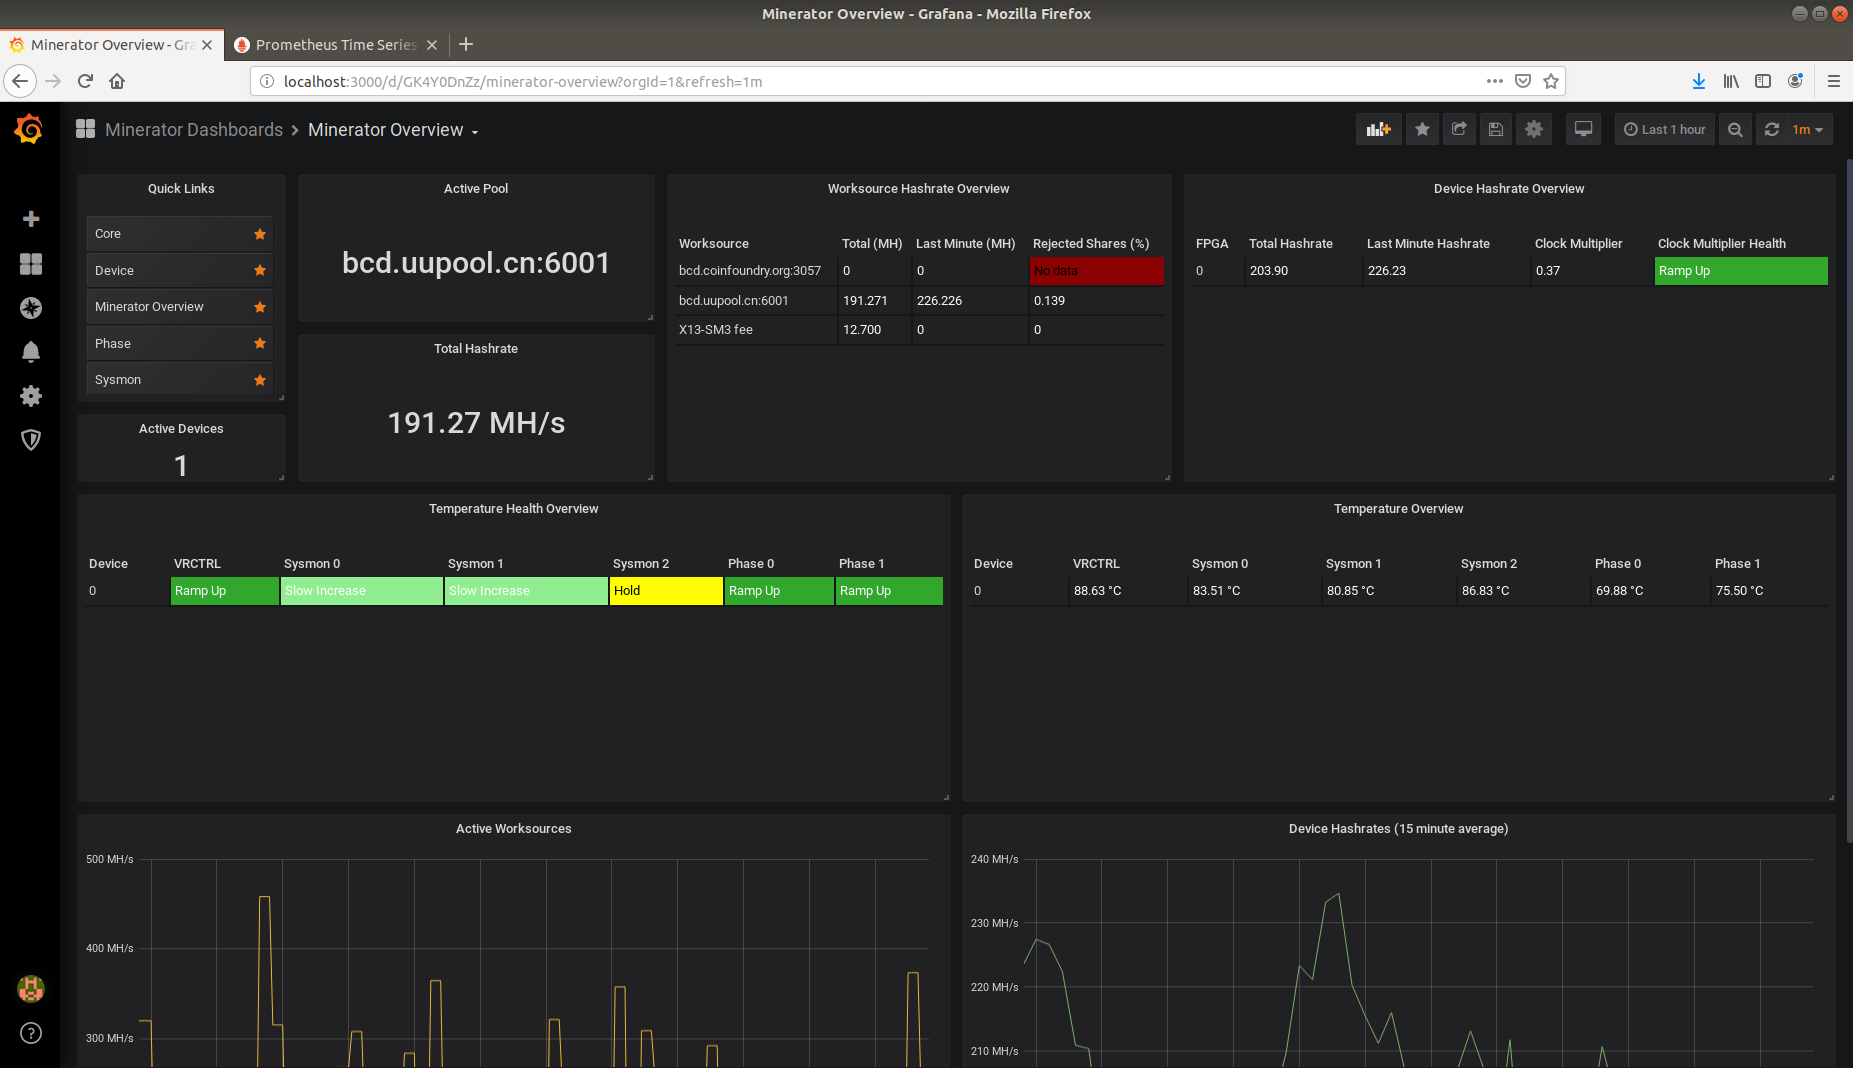
Screenshots
Quick Setup for Ubuntu 18.04 rigs running minerator
Quick setup for running on Ubuntu 18.04 rigs running minerator:
sudo apt-get install git
git clone https://github.com/pigfrown/minerator-metrics
cd minerator-metrics
sudo su
./setup.sh
If you can't access grafana remotely you need to also run ./setup_network.sh (as root).
This script will enable and configure the ubuntu firewall to allow remote connections to grafana/prometheus.
Note: this will automatically start prometheus/grafana/minerator-metrics on boot. disable the relevant systemd services if you don't want this (see script).
For other systems, check the scripts to see what needs installing/configuring.
If you want to run prometheus/grafana on a seperate server you need to manually install prometheus and grafana and edit prometheus.yml to point to your minerator rig(s). minerator-metrics.py needs to be run on each minerator rig.
Confirm Prometheus Installed
Prometheus is only available from the minerator system.
Goto localhost:9090 from your minerator system. You should see Prometheus web interface. Go to Status->Targets and you should see "minerator" target, and it should be up.
Grafana Configuration
Grafana should be up on port 3000 on your minerator box.
Access grafana and log in with default username "admin", password "admin" and change your password.
Add Prometheus Datasource
- Click "Add data source", select "Prometheus".
- set URL to "http://localhost:9090".
- Ensure name is "local_prometheus".
- Click "Save and Test" and Prometheus should be configured with grafana
Alternativly you can use the setup_grafana.sh script to create ths datasource.
Import Dashboards
- On the left hand side of Grafana, click the "+" symbol
- Select Import Dashboard
- make sure you select the prometheus data source that was created earlier
- Click "Upload .json File" and select Device.json from minerator-metrics/dashboards
- Repeat process for Core, Phase, Sysmon, and MineratorOverview dashboards
Setup for other systems
Check the scripts to see what needs installing/configuring.
If you want to run prometheus/grafana on a seperate server you need to manually install prometheus and grafana and edit prometheus.yml to point to your minerator rig(s). minerator-metrics.py needs to be run on each minerator rig.
Multiple rigs
No dashboard for this, but metrics have a "rig" label that could be used to create one.
Troubleshooting
Check prometheus, grafana-server, and minerator-metrics systemd services are all running. Check logs (journalctl -u) for the above services

