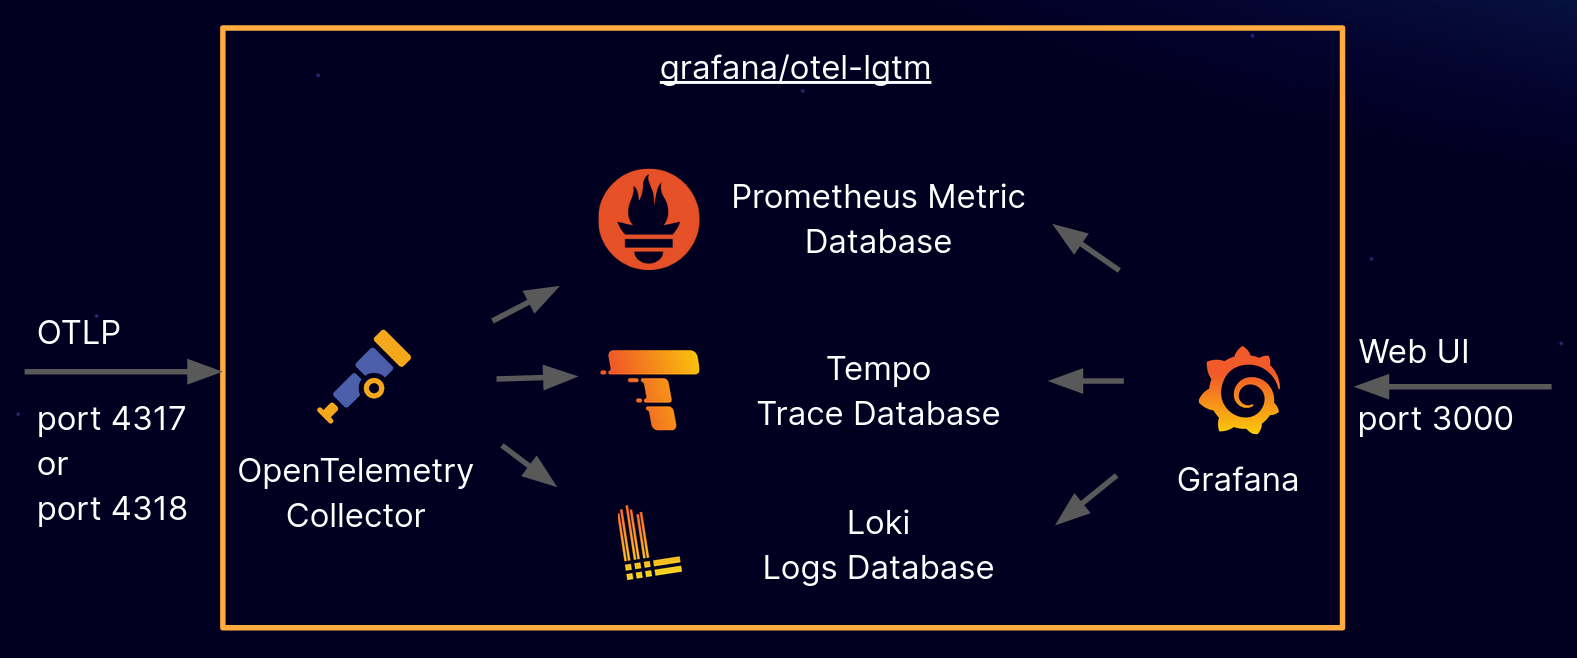
An OpenTelemetry backend in a Docker image.
The grafana/otel-lgtm Docker image is an open source backend for OpenTelemetry that’s intended for development, demo, and testing environments. If you are looking for a production-ready, out-of-the box solution to monitor applications and minimize MTTR (mean time to resolution) with OpenTelemetry and Prometheus, you should try Grafana Cloud Application Observability.
The Docker image is available on Docker hub: https://hub.docker.com/r/grafana/otel-lgtm
./run-lgtm.sh# create k8s resources
kubectl apply -f k8s/lgtm.yaml
# port forwarding
kubectl port-forward service/lgtm 3000:3000 4317:4317 4318:4318There's no need to configure anything: The Docker image works with OpenTelemetry's defaults.
# Not needed as these are the defaults in OpenTelemetry:
export OTEL_EXPORTER_OTLP_PROTOCOL=grpc
export OTEL_EXPORTER_OTLP_ENDPOINT=http://localhost:4317Log in to http://localhost:3000 with user admin and password admin.
cd docker/
docker build . -t grafana/otel-lgtmRun the example REST service:
./run-example.shGenerate traffic:
./generate-traffic.shThe example apps are in the examples/ directory.
Each example has a run.sh script to start the app.
Every example implements a rolldice service, which returns a random number between 1 and 6.
Each example uses a different application port (to be able to run all applications at the same time).
| Example | Service URL |
|---|---|
| Java | curl http://localhost:8080/rolldice |
| Go | curl http://localhost:8081/rolldice |
| Python | curl http://localhost:8082/rolldice |
| dotnet | curl http://localhost:8083/rolldice |
- Metrics, Logs, Traces and Profiles in Grafana: https://github.com/grafana/intro-to-mltp
