- Basic Introduction: Machine Learning Kaggle Competetion containing all the required details in csv file format to predict the price of the house.
- More details can be found here
- If you are new to ML coding
- If you are new to Kaggle Projects
- If you want check out, how to use Pipeline and ColumnTransformer in your ML projects.
- Dataset - Contains all the csv files downloaded from Kaggle (link mentioned above).
- EDA.ipynb - Exploratory Data Analysis of train.csv and test.csv files.
- Feature_Engineering.ipynb - Categorizing the columns and some of my own experimentation (optional).
- Pipeline.ipynb - Final Training and Testing pipeline (Used Column Transformer and Pipelines from sklearn)
- Images - Contains all the plots generated in EDA
- Kaggle Submissions -- Some of my kaggle submission csv files.
- Read the whole README.md file.
- I have summarized the EDA in this file.
- EDA.ipynb - If you want to learn how to generate plots in readme file.
- Feature_Engineering.ipynb can be skipped.
- Pipeline.ipynb - If you want to learn how to use ColumnTransformers, Pipeline (sklearn) and write end to end ML code for prediction on test dataset.
-
Structure Investigation
Structural Parameters Train Data Test Data Number of Entries 1460 1459 Number of Features 79 79 Number of Float Features 3 11 Number of Int64 Features 33 25 Number of Object Features 43 43 -
Splitting the data into Numerical and Categorical columns.
Total number Train Test Numerical Columns 36 36 Categorical Columns 43 43 -
Checking for duplicates and removing them if any
- There exist no duplicates in the train dataset.
-
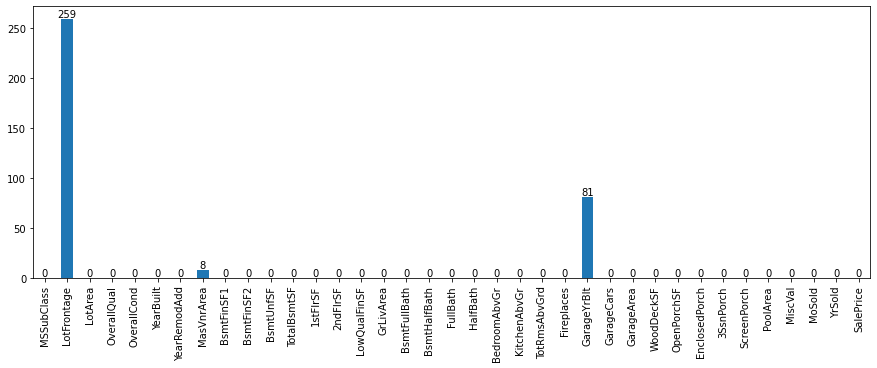
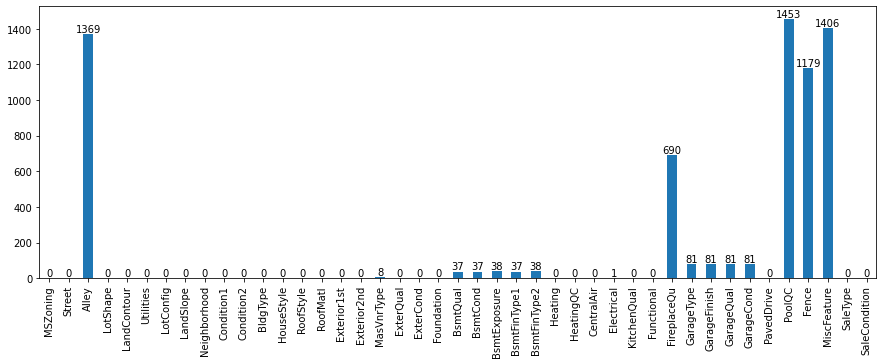
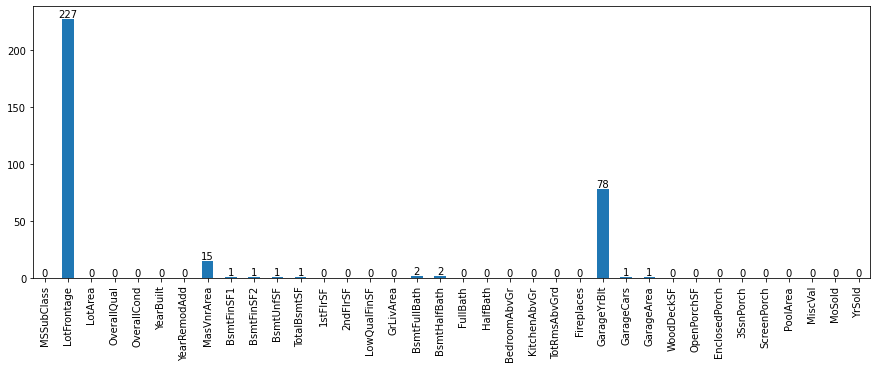
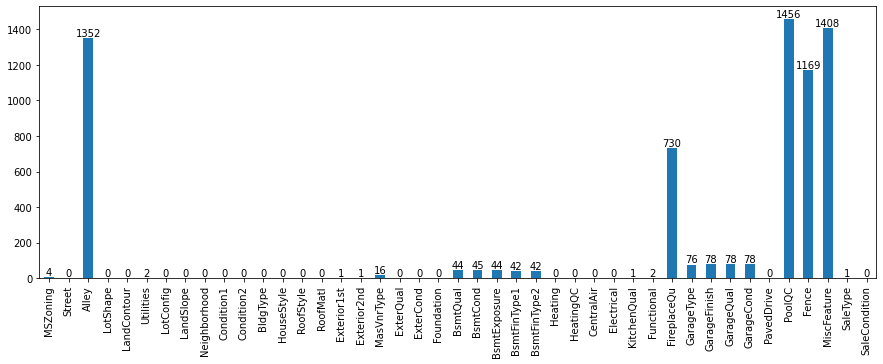
Checking for Null Values
-
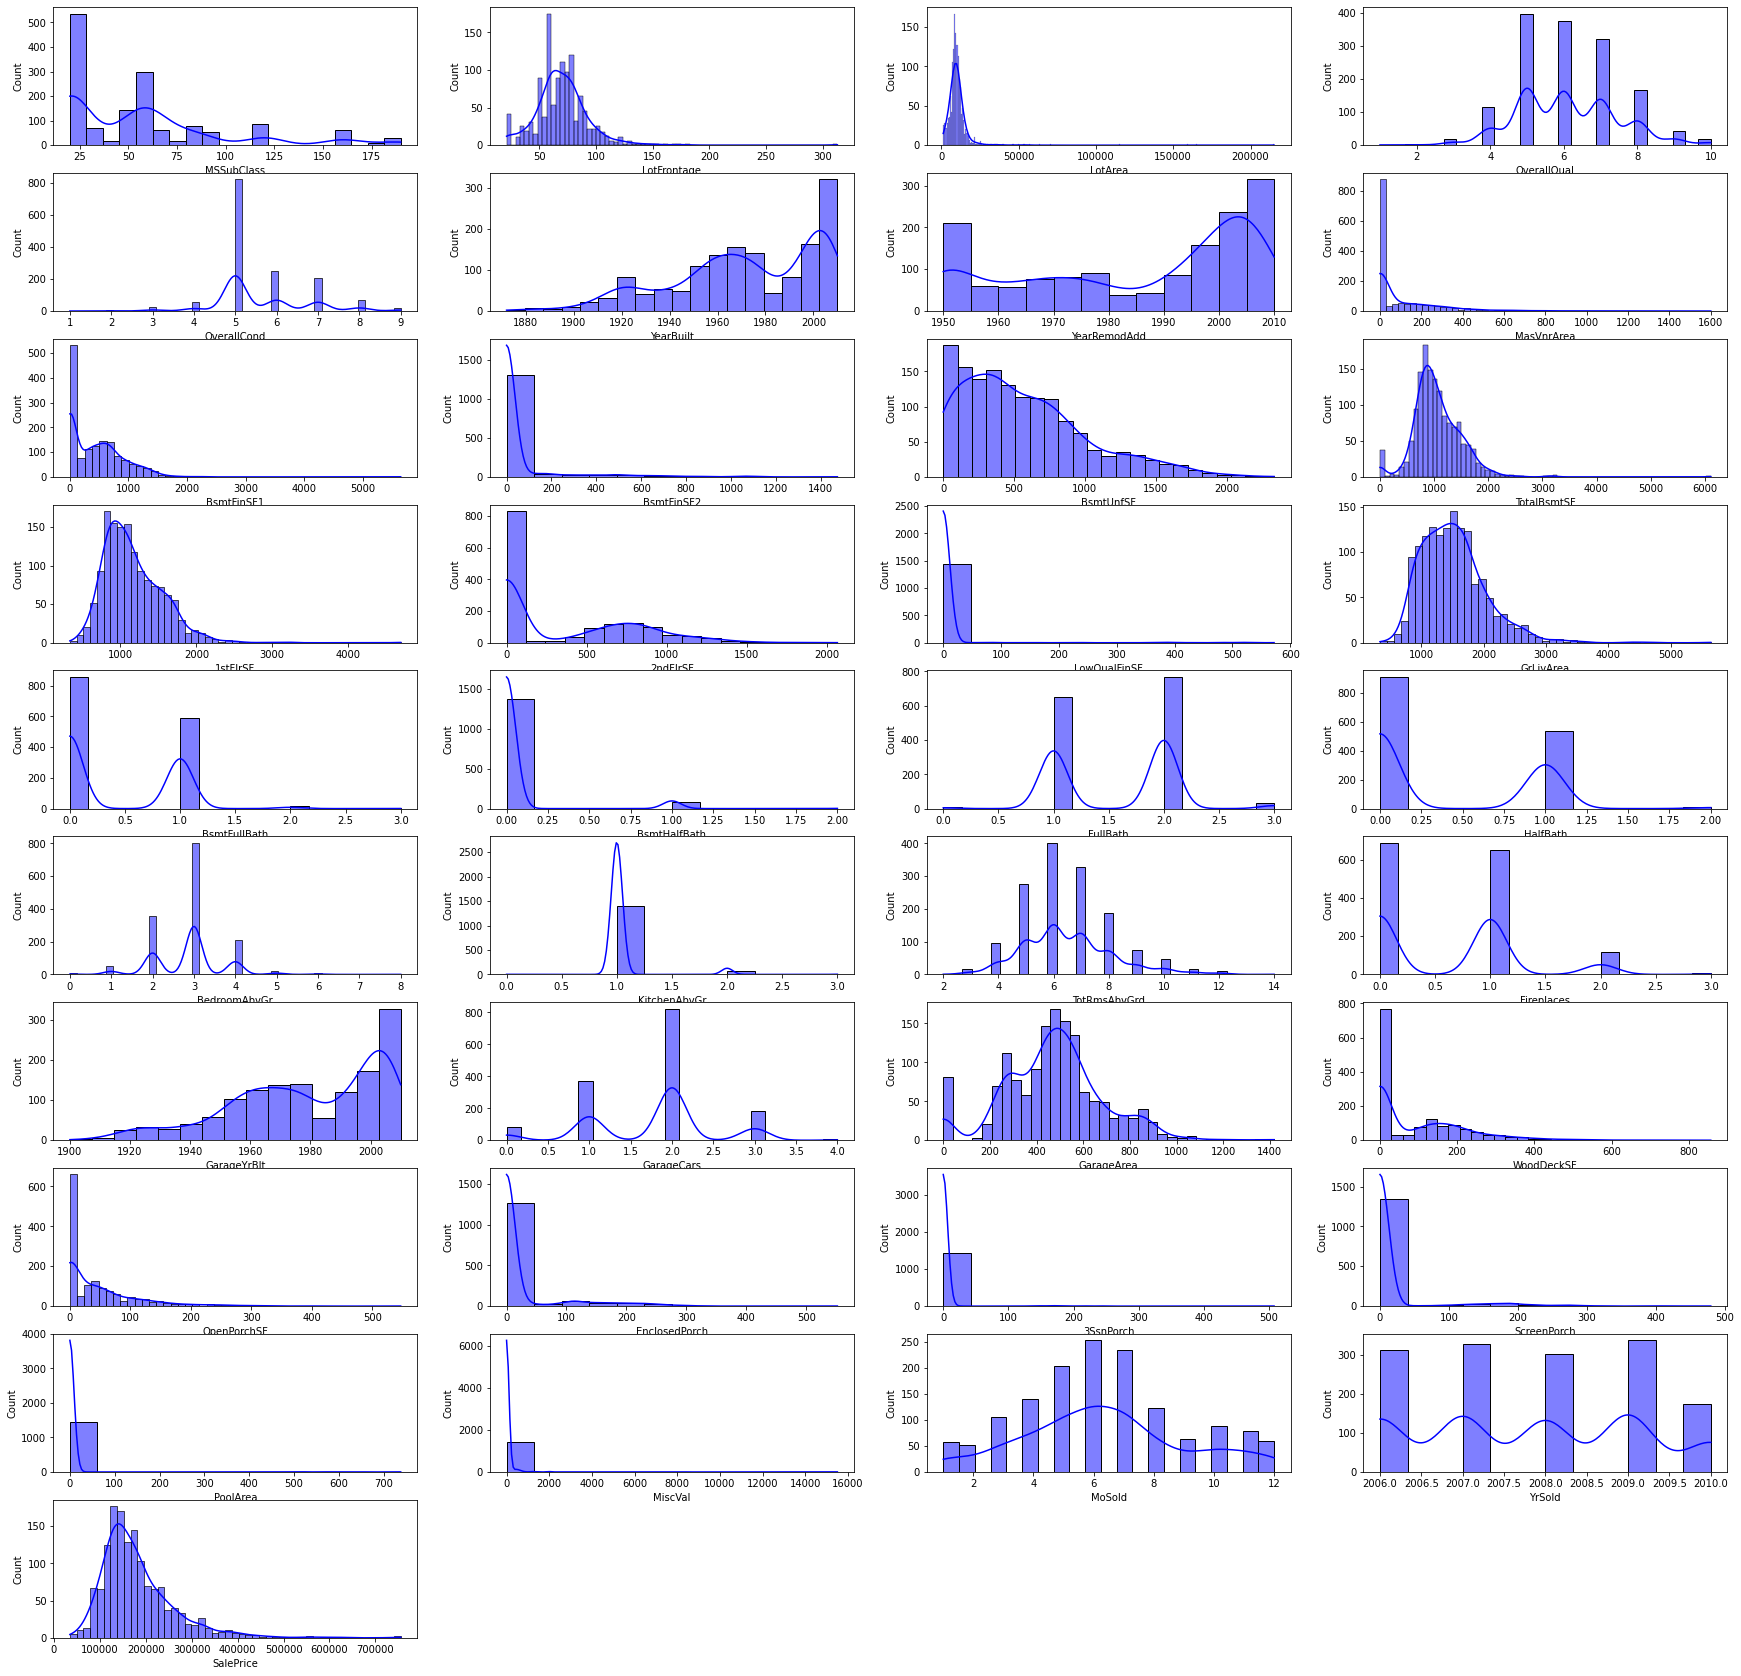
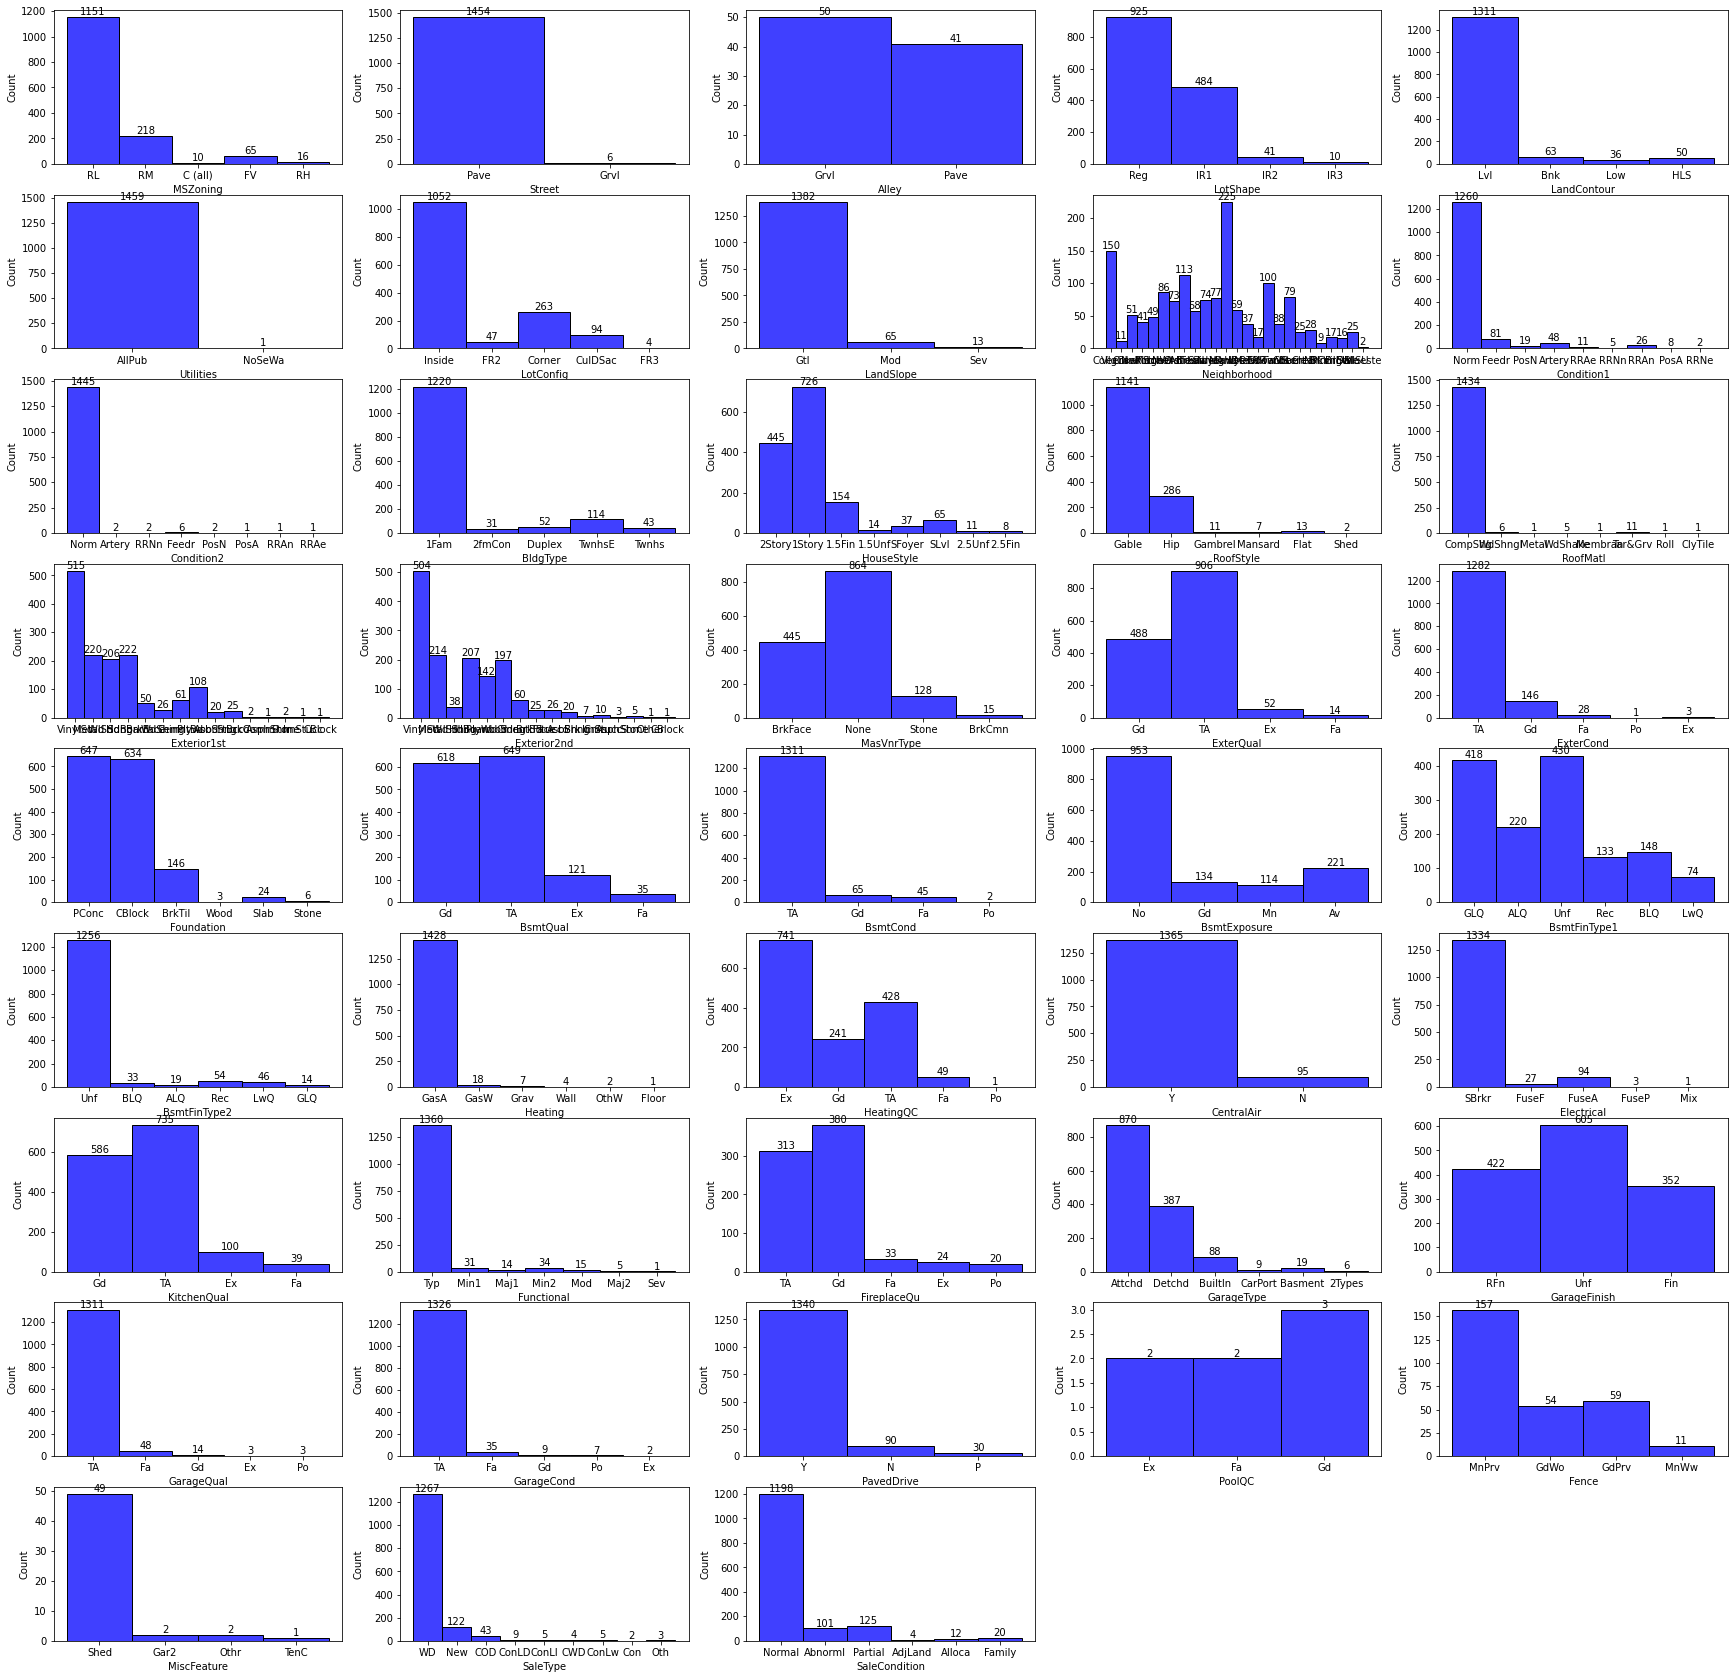
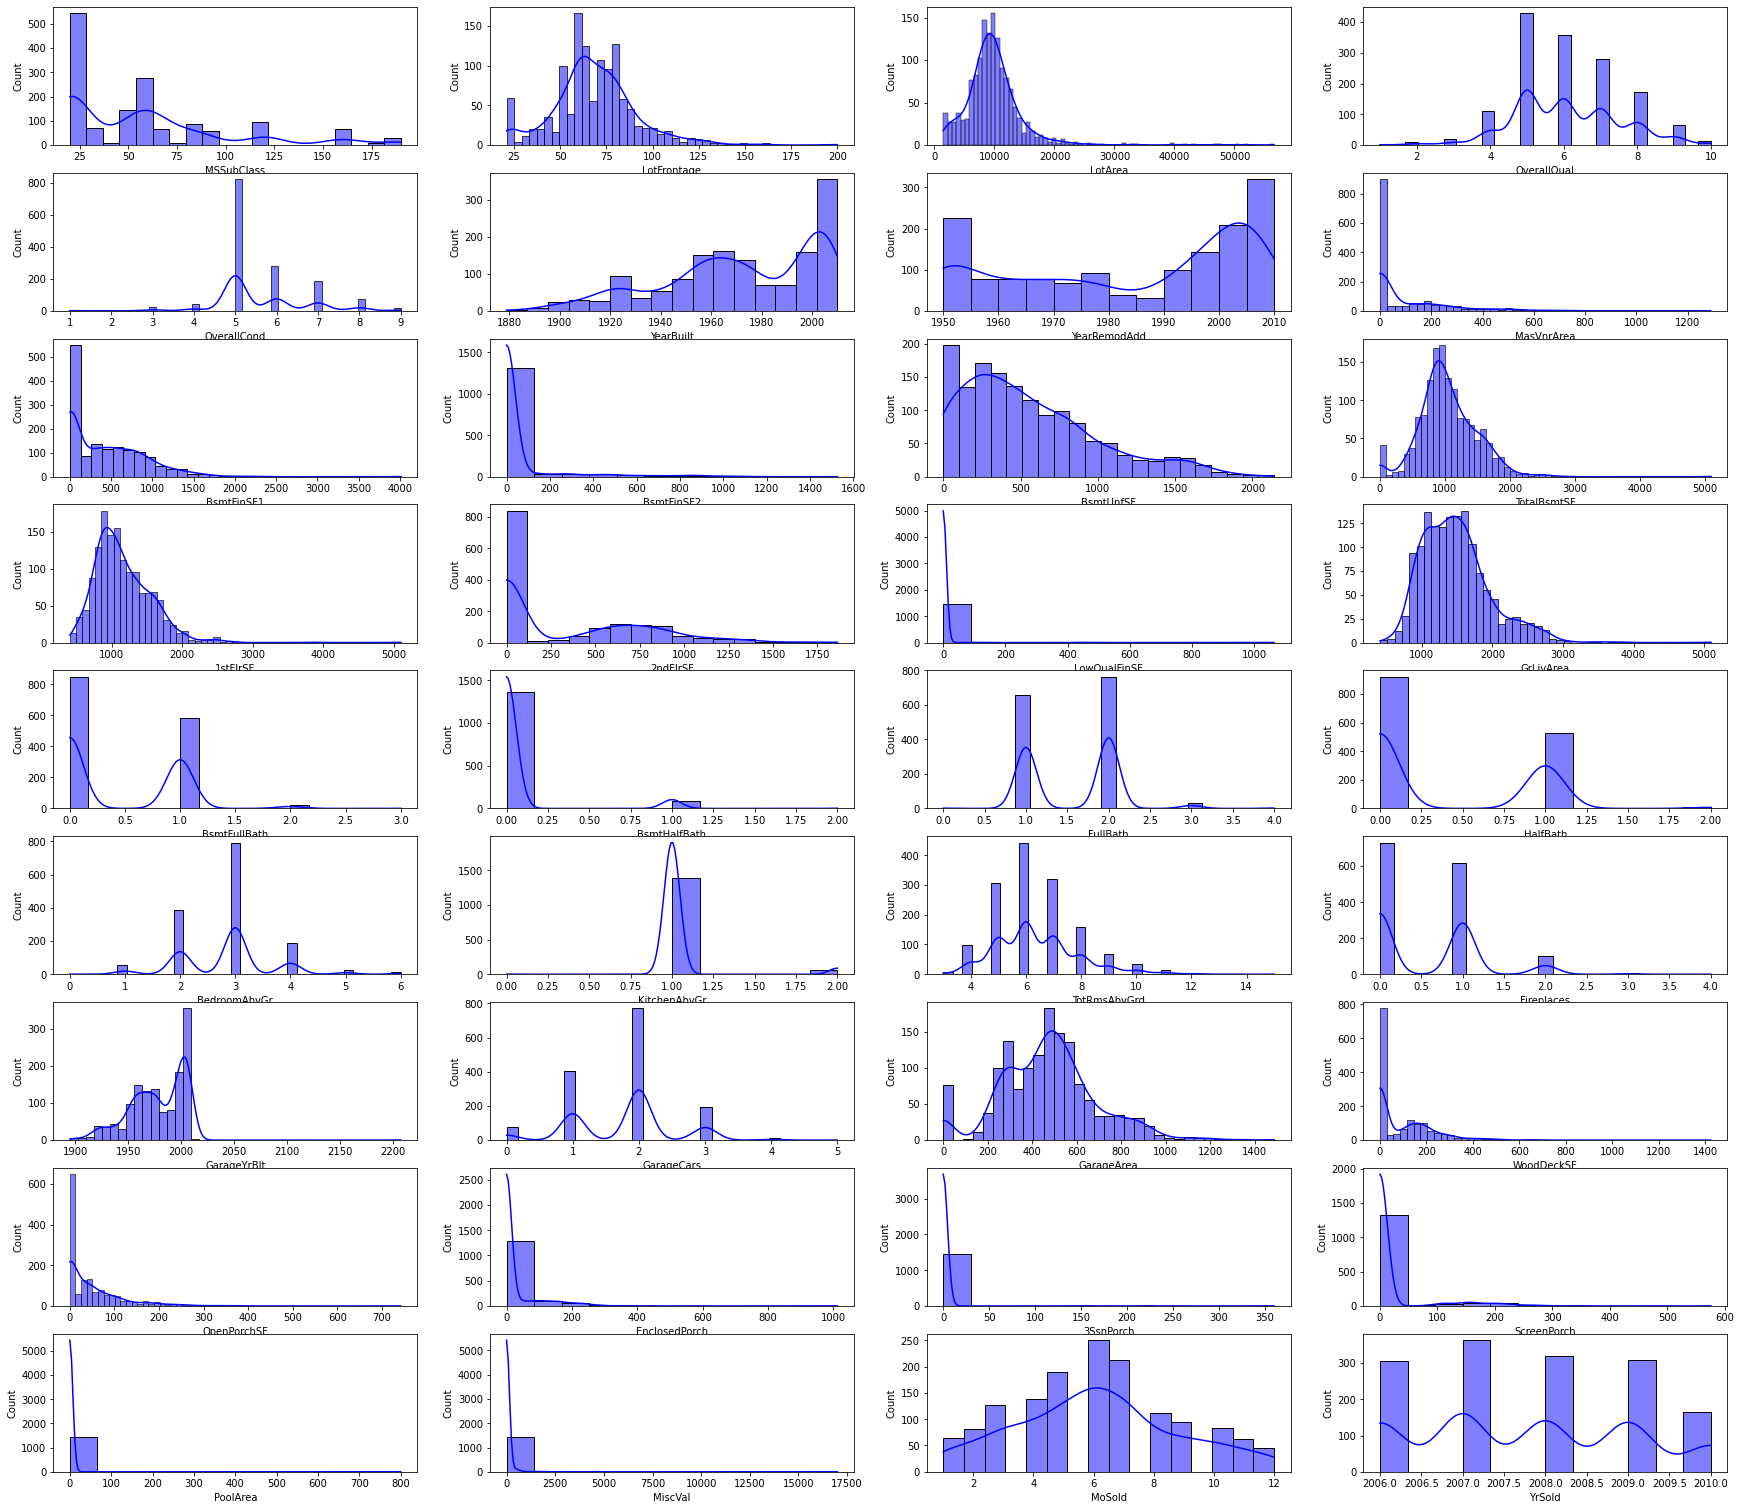
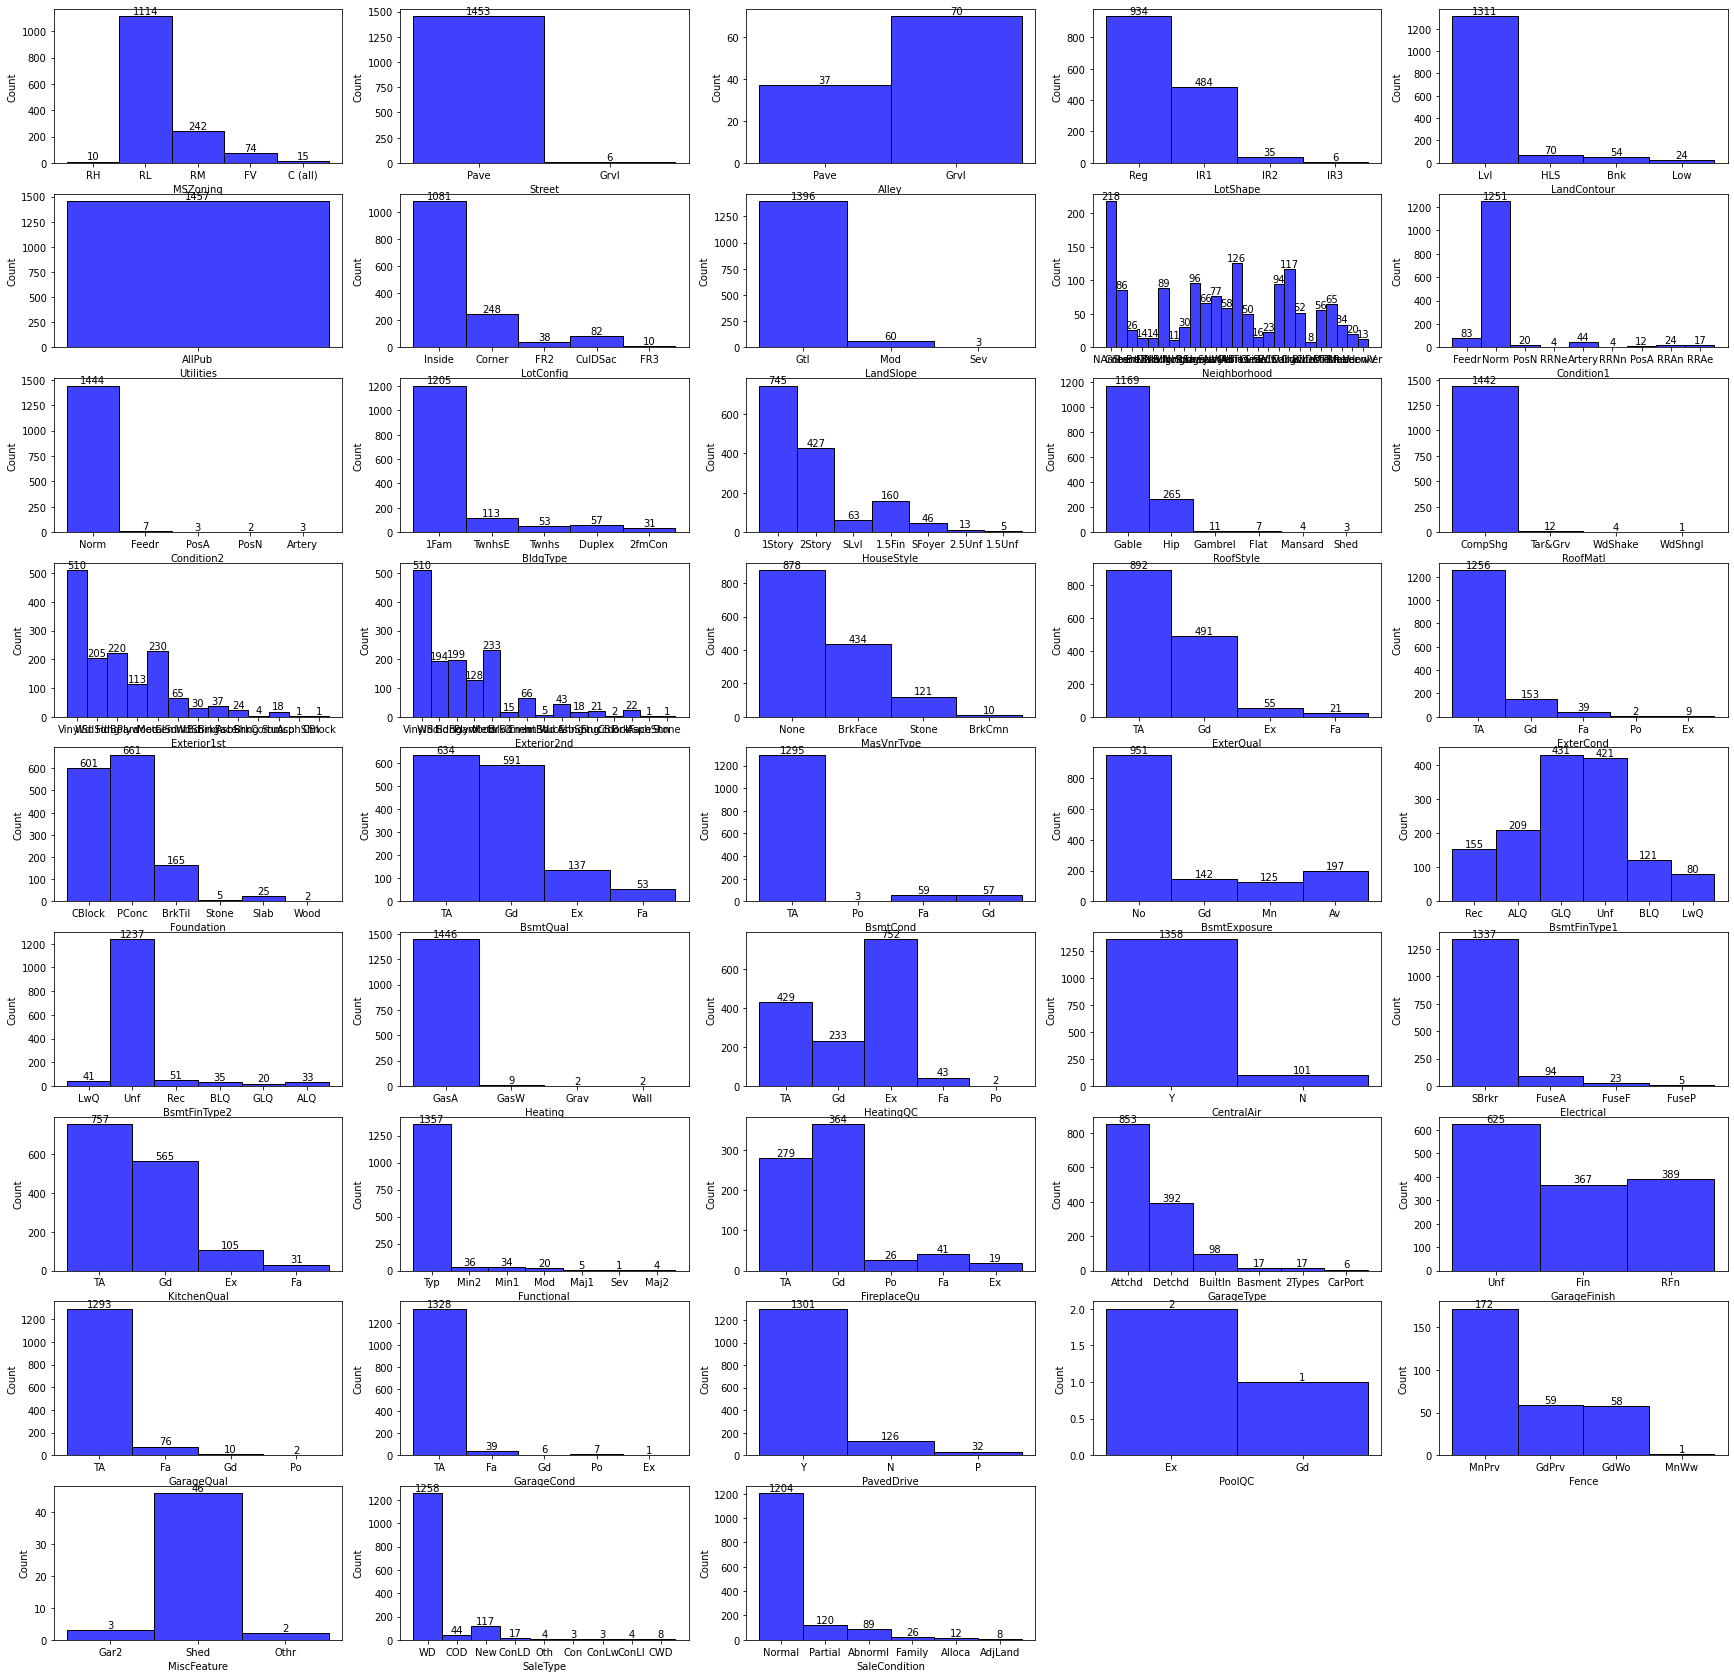
Histograms
-
Skewness
Dataset Features type Features Train Numerical ['LowQualFinSF', '3SsnPorch', 'LotArea', 'PoolArea', 'MiscVal'] Train Categorical ['Street', 'Utilities', 'Condition2', 'RoofMatl', 'Heating'] Test Numerical ['3SsnPorch', 'LowQualFinSF', 'MiscVal', 'PoolArea'] Test Categorical ['Street', 'Utilities', 'Condition2', 'RoofMatl', 'Heating'] -
Numerical Columns
- Skewness in numerical features can be reduced by applying mathematical transformations.
-
Categorical Columns
- Categorical skewed columns can be removed.
-
-
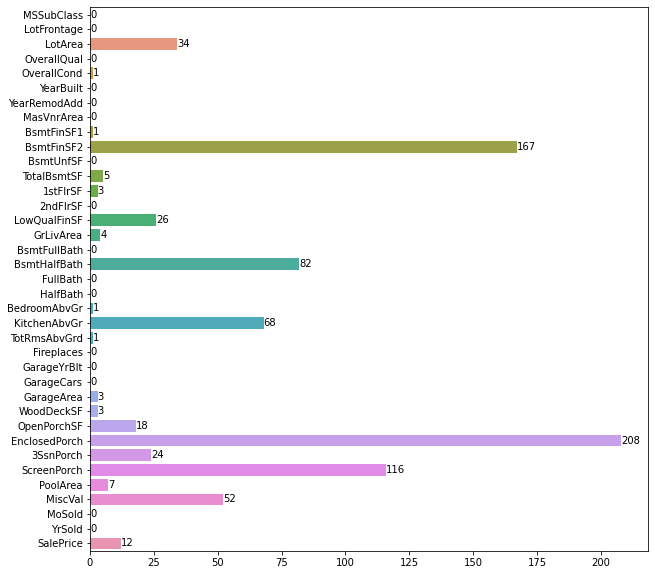
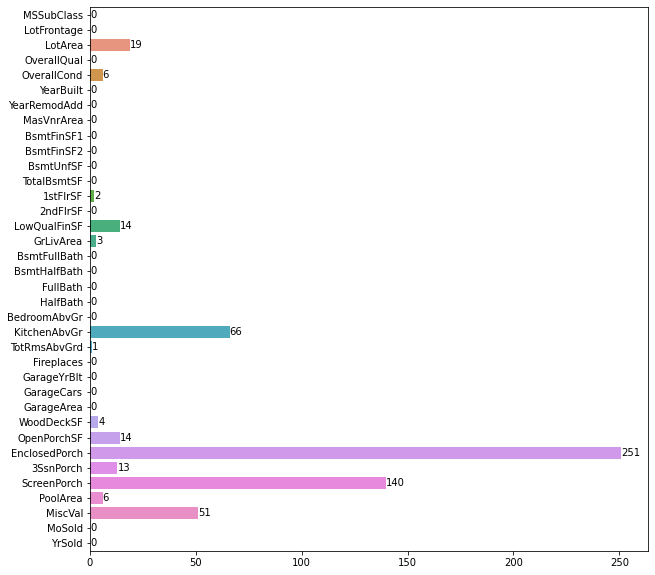
Outliers
- Numerical Columns
Dataset Features type Features Train Numerical ['LotArea', 'OverallCond', 'BsmtFinSF1', 'BsmtFinSF2', 'TotalBsmtSF', '1stFlrSF', 'LowQualFinSF', 'GrLivArea', 'BsmtHalfBath', 'BedroomAbvGr', 'KitchenAbvGr', 'TotRmsAbvGrd', 'GarageArea', 'WoodDeckSF', 'OpenPorchSF', 'EnclosedPorch', '3SsnPorch', 'ScreenPorch', 'PoolArea', 'MiscVal', 'SalePrice'] Test Numerical ['LotArea', 'OverallCond', '1stFlrSF', 'LowQualFinSF', 'GrLivArea', 'KitchenAbvGr', 'TotRmsAbvGrd', 'WoodDeckSF', 'OpenPorchSF', 'EnclosedPorch', '3SsnPorch', 'ScreenPorch', 'PoolArea', 'MiscVal'] -
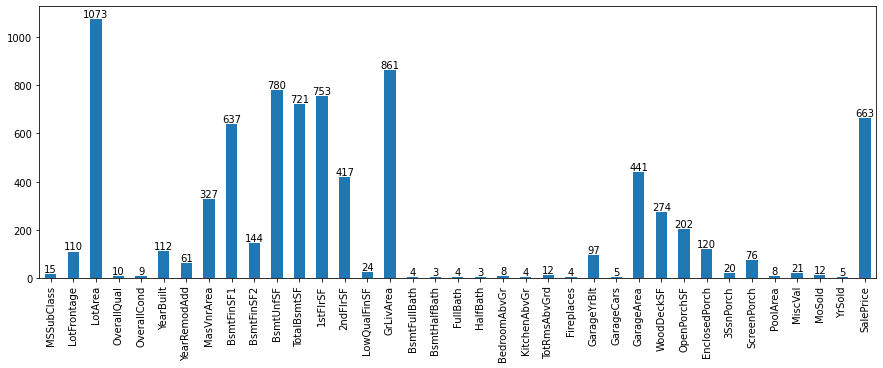
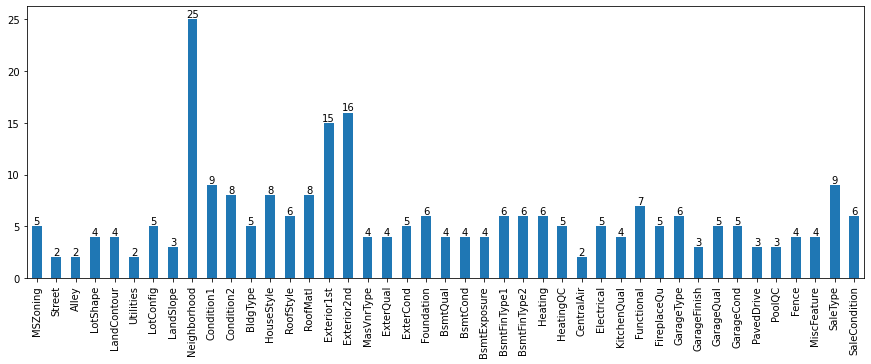
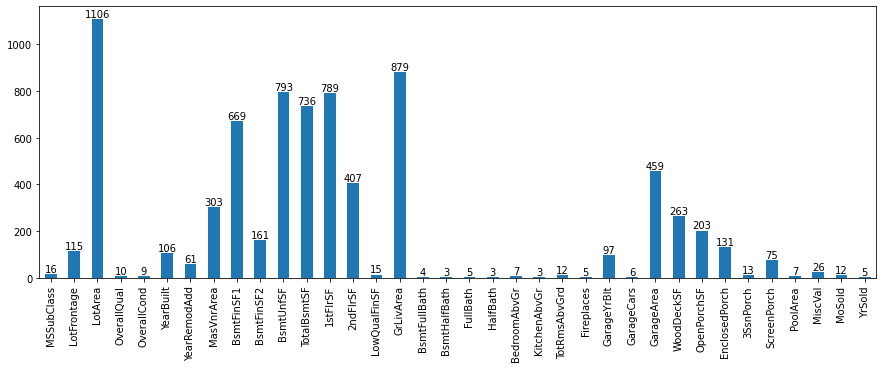
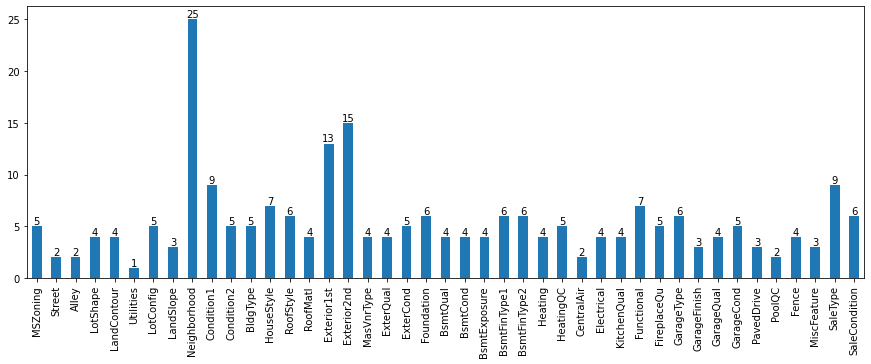
Number of Unique Values in each column
-
HeatMaps
- Correlation of each feature with other features.
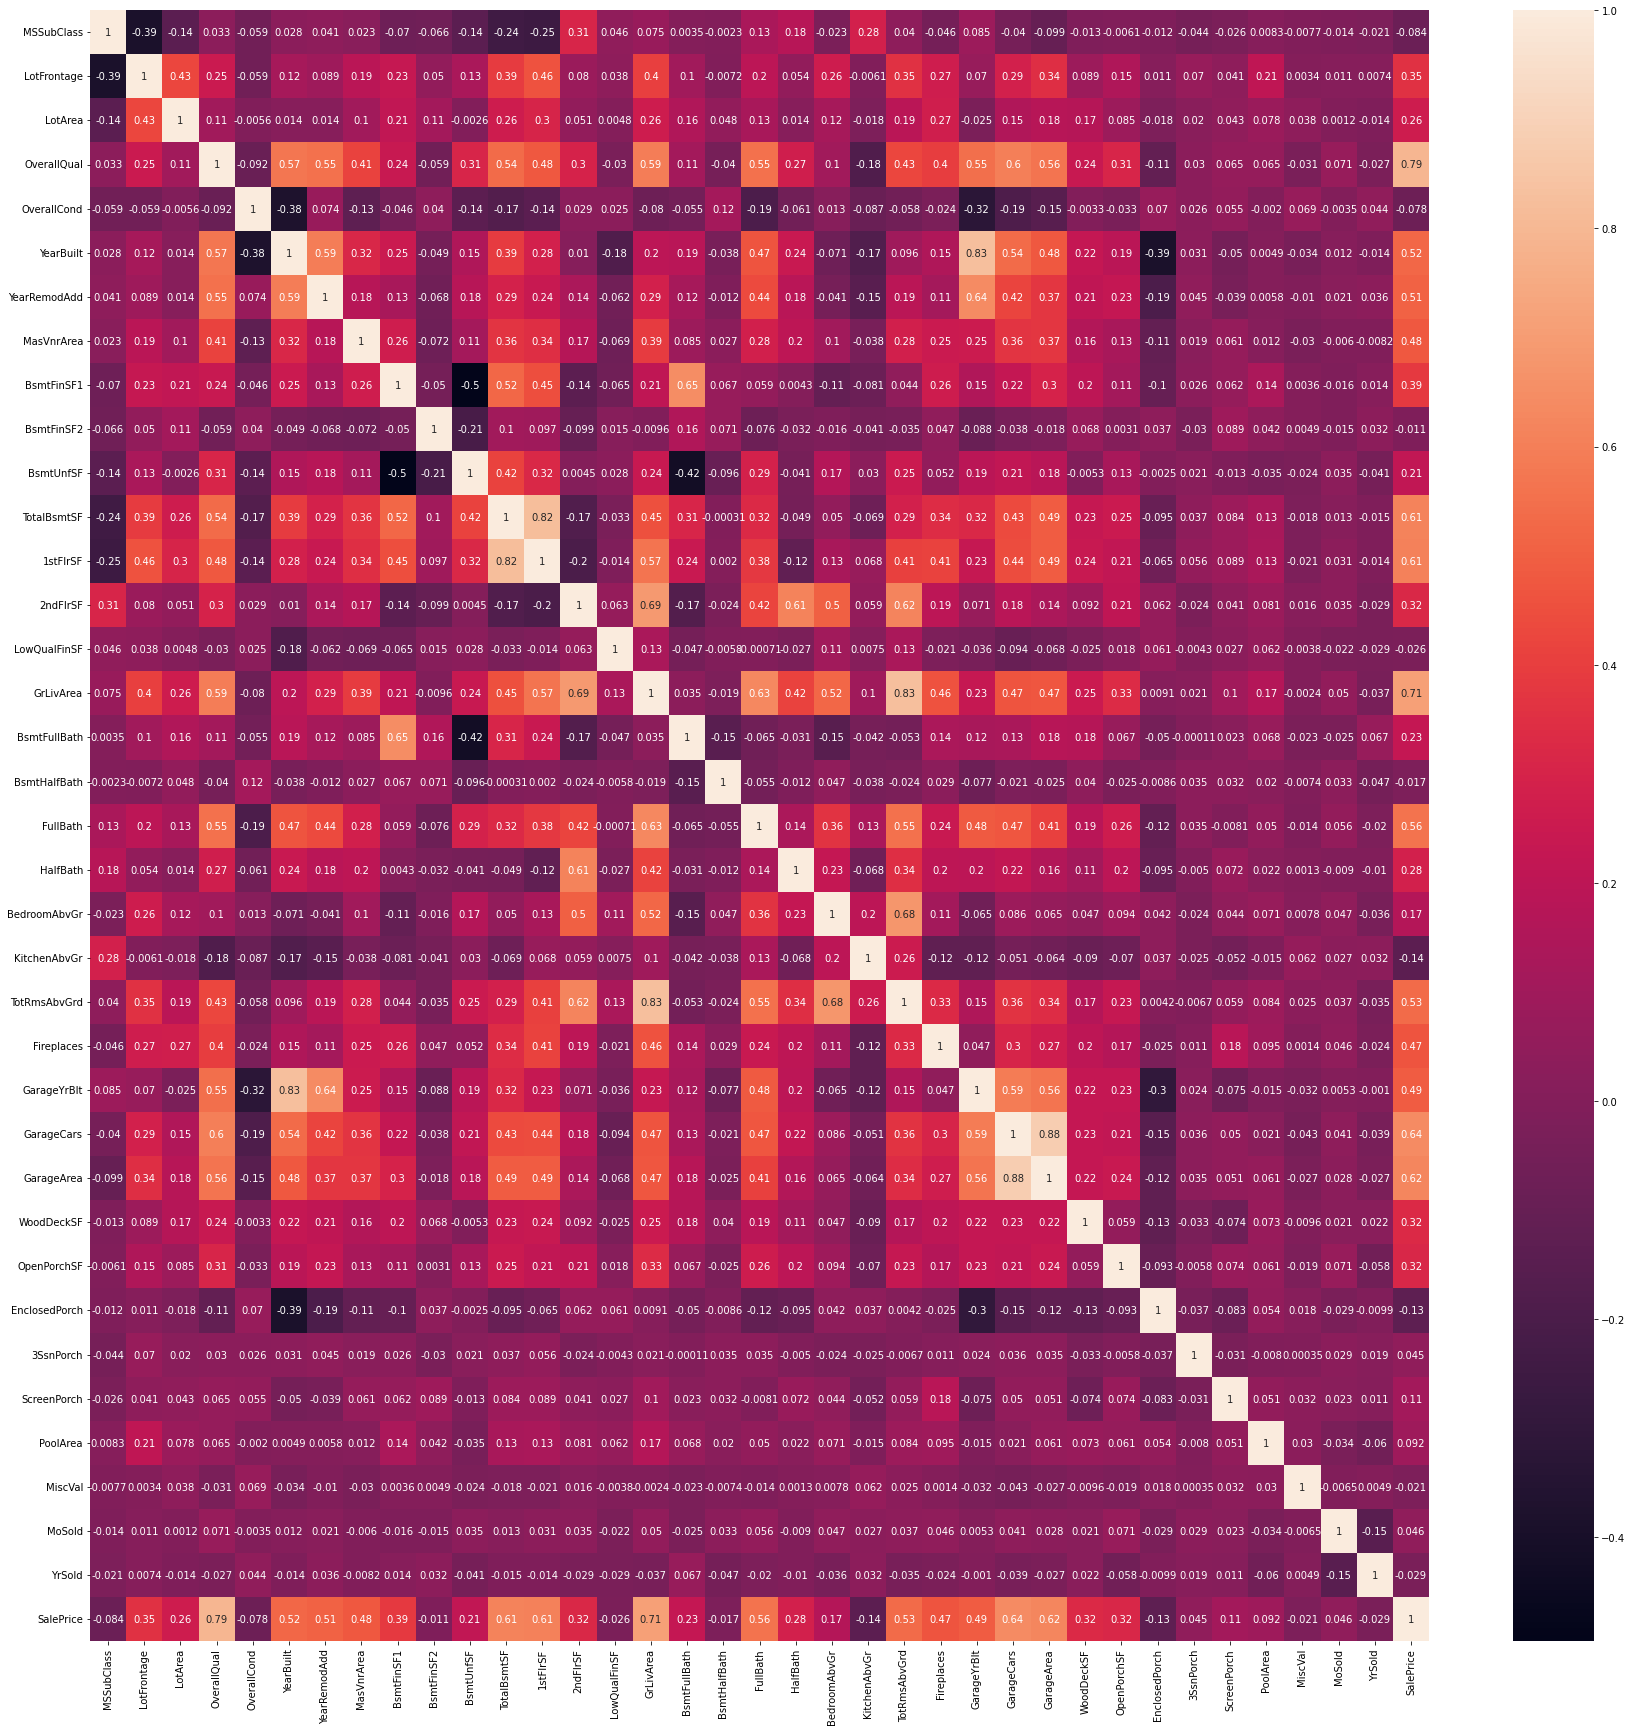
- Positively Correlated Features - ['SalePrice', 'OverallQual', 'GrLivArea', 'GarageCars', 'GarageArea', 'TotalBsmtSF', '1stFlrSF']
- Negatively Correlated Features - ['KitchenAbvGr', 'EnclosedPorch', 'MSSubClass', 'OverallCond', 'YrSold', 'LowQualFinSF', 'MiscVal', 'BsmtHalfBath', 'BsmtFinSF2']
- Correlation of each feature with other features.
Feature Engineering using Pipeline and ColumnTransformer
| Type | Features | Transformation Applied |
|---|---|---|
| Skewed Continuous | ['LowQualFinSF', '3SsnPorch', 'LotArea', 'PoolArea', 'MiscVal'] | Imputation with median, Log Transformation, Standardization |
| Non Skewed Continuous | ['1stFlrSF', 'BsmtHalfBath', 'BsmtFinSF2', 'EnclosedPorch', 'BsmtFinSF1', 'GarageArea', 'WoodDeckSF', 'GrLivArea', 'KitchenAbvGr', 'MasVnrArea', '2ndFlrSF', 'ScreenPorch', 'OpenPorchSF', 'LotFrontage', 'TotalBsmtSF', 'BsmtUnfSF'] | Imputation with median, Standardization |
| Discrete Numerical | ['MSSubClass', 'OverallQual', 'OverallCond', 'YearBuilt', 'YearRemodAdd', 'BsmtFullBath', 'FullBath', 'HalfBath', 'BedroomAbvGr', 'TotRmsAbvGrd', 'Fireplaces', 'GarageYrBlt', 'GarageCars', 'MoSold', 'YrSold'] | Imputation with mode, |
| Categorical | ['MSZoning', 'Alley', 'LotShape', 'LandContour', 'LotConfig', 'LandSlope', 'Neighborhood', 'Condition1', 'BldgType', 'HouseStyle', 'RoofStyle', 'Exterior1st', 'Exterior2nd', 'MasVnrType', 'ExterQual', 'ExterCond', 'Foundation', 'BsmtQual', 'BsmtCond', 'BsmtExposure', 'BsmtFinType1', 'BsmtFinType2', 'HeatingQC', 'CentralAir', 'Electrical' 'KitchenQual', 'Functional', 'FireplaceQu', 'GarageType', 'GarageFinish', 'GarageQual', 'GarageCond', 'PavedDrive', 'PoolQC', 'Fence', 'MiscFeature', 'SaleType', 'SaleCondition'] | Imputation with mode, OneHotEncoding |
Training using Sklearn Pipeline
-
Train-Val Split : Splitting into training(80%) and validation sets (20%).
-
Model : XGB Regressor
-
Paramters tried using GridSearchCV
Hyper Parameters Values n_estimators [150, 200, 250, 300, 350, 400] learning_rate [0.1, 0.15, 0.2, 0.25] max_depth [4, 5, 6, 7, 8, 9] -
Best Parameters Found
learning_rate max_depth n_estimators 0.1 4 400 -
Results
Dataset Mean Squared error R2 score Train 0.0006 0.9959 Validation 0.023 0.8625
| Mean squared error | Rank |
|---|---|
| 14701.79191 | 918 |
- One can still work on improving the results on this dataset.
- I would like to recommend one to go through this repo entirely, understand the code, reproduce the results, go through better feature engineering techinques, apply them and try to boost your rank on the Kaggle leaderboard.
For any queries or suggestions, Please feel free to contact me on LinkedIn or on email
