Welcome
About this repository
- This repository houses assessment code that I completed for EOG's React Assessment.
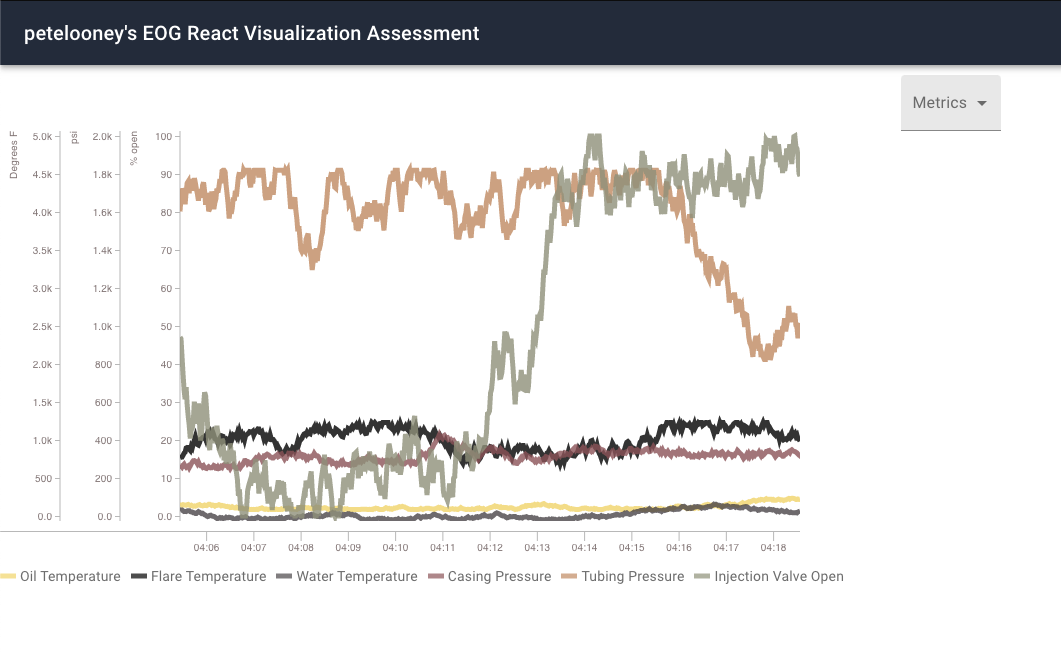
- The site uses Graphql, React, Redux, and React-Timeseries-charts to render 6 different pieces of measurements including:
- Oil Temperature
- Tubing Pressure
- Casing Pressure
- Water Temperature
- Injection Vavlue Open Percentage
- Flare Temperature
General
- Using EOG's starter code as a foundation, I expanded the site to include a graph that highlights the data points from above.

Lessons Learned
- How to use graphql
- Like I try and do with all new concepts, I spent time reviewing the graphql documentation and studying examples before diving into writing queries.
- Ultimately, I found that I enjoyed using graphql and plan on expanding my knowledge in the platform.
- How to use React-Timeseries-Charts
- This package assists in creating a multitude of time series charts.
- I decided to use their Line chart graphing component, as I felt this would best suite the data in question.