A small node.js program that allows you to calculate and display the latency of each element of the GStreamer pipeline while using the GStreamer Tracing subsystem.
-
Install
npm install -
Run your GStreamer pipeline using the latency tracer and store the traces in a file like this:
GST_DEBUG_COLOR_MODE=off GST_TRACERS="latency(flags=pipeline+element)" GST_DEBUG=GST_TRACER:7 GST_DEBUG_FILE=traces.log -
Run
node main.js traces.logon that logfile. Check-hon more options.
Decode and render the HEVC bitstream file.265:
GST_DEBUG_COLOR_MODE=off GST_TRACERS="latency(flags=pipeline+element)" GST_DEBUG=GST_TRACER:7 GST_DEBUG_FILE=traces.log gst-launch-1.0 filesrc location=file.265 ! video/x-h265 ! h265parse ! avdec_h265 ! videorate ! video/x-raw,framerate=25/1 ! autovideosink
Plot the results:
node main.js traces.log
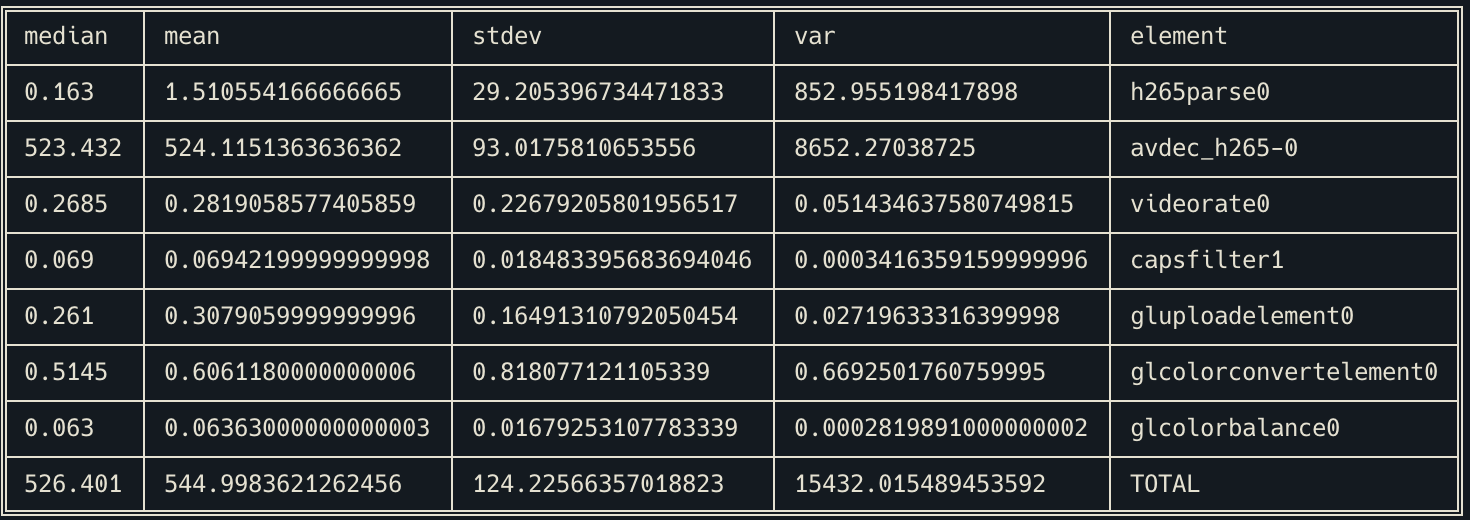
Which returns you a table like this:
And creates an interactive plot of the latency over time in your web browser window like this:
In this example we have a file where after 10 seconds we swith the aspect ratio of the video, which shows that the h265parse element introduces approx. 600 ms of extra latency.
You can find file.265 and the corresponding traces.log from this example in the testdata folder.

