# Working directory is set to the same directory as where activity.csv is
activity <- read.csv("activity.csv")
activity$date <- as.Date(activity$date)
str(activity)
## 'data.frame': 17568 obs. of 3 variables:
## $ steps : int NA NA NA NA NA NA NA NA NA NA ...
## $ date : Date, format: "2012-10-01" "2012-10-01" ...
## $ interval: int 0 5 10 15 20 25 30 35 40 45 ...
head(activity, n = 5)## steps date interval
## 1 NA 2012-10-01 0
## 2 NA 2012-10-01 5
## 3 NA 2012-10-01 10
## 4 NA 2012-10-01 15
## 5 NA 2012-10-01 20
completecases <- complete.cases(activity$date, activity$steps)  #complete cases of date and steps
perday <- aggregate(activity$steps[completecases], list(activity$date[completecases]),
    sum)  #sum steps for each date
names(perday) <- c("date", "total.steps")

hist(perday$total.steps, main = "Histogram of total steps taken per day", xlab = "Total steps taken in a day",
    ylab = "Frequency (days)")
Above is a histogram showing the distribution of total number of steps taken each day.
perday.mean <- mean(perday$total.steps)  #mean
perday.median <- median(perday$total.steps)  #median
The total number of steps taken per day had a mean of 10766.19 and a median of 10765.
Make a time series plot (i.e. type = "l") of the 5-minute interval (x-axis) and the average number of steps taken, averaged across all days (y-axis)
completecases.perinterval <- complete.cases(activity$interval, activity$steps)
perinterval <- aggregate(activity$steps[completecases.perinterval], list(activity$interval[completecases.perinterval]),
    mean)
names(perinterval) <- c("interval", "mean.steps.across.days")
head(perinterval)
## interval mean.steps.across.days
## 1 0 1.71698
## 2 5 0.33962
## 3 10 0.13208
## 4 15 0.15094
## 5 20 0.07547
## 6 25 2.09434
plot(type = "l", perinterval, xlab = "5-min Intervals from Start of Day", ylab = "Mean Number of Steps Taken",
main = "Average Daily Pattern of Steps Taken Throughout a Day \n Across Two Months")Which 5-minute interval, on average across all the days in the dataset, contains the maximum number of steps?
maxsteps <- max(perinterval$mean.steps.across.days)
perinterval[perinterval$mean.steps.across.days == maxsteps, ]
## interval mean.steps.across.days
## 104 835 206.2
maxinterval <- perinterval[104, "interval"] #assign the max interval, 835, to a variable for reportingThe above table shows that it was the 835th interval that contained the maximum number of steps, averaged across days.
Calculate and report the total number of missing values in the dataset (i.e. the total number of rows with NAs)
nrow.total <- nrow(activity)  #total number of rows
nrow.na <- sum(is.na(activity$steps))  #total number of rows containing NA under 'Steps' column
The total number of rows with NAs is 2304.
Note that the total number of rows altogether is 17568.
Devise a strategy for filling in all of the missing values in the dataset. The strategy does not need to be sophisticated. For example, you could use the mean/median for that day, or the mean for that 5-minute interval, etc.
# NA values will be filled in with 'x' for that interval, where 'x' is the
# average number of steps taken in that interval across all days

# Merge original dataset with dataframe containing steps in an interval
# averaged across all days
activity.filled <- merge(activity, perinterval, by = "interval")

# Create new column with the rule: if NA, replace with the average number of
# steps across all days for that specific interval, if not NA, keep the
# original value
activity.filled <- transform(activity.filled, filled = ifelse(is.na(steps),
    as.character(mean.steps.across.days), steps))

# Reduce to only the relevant columns
activity.filled <- activity.filled[c("interval", "filled", "date")]
names(activity.filled) <- c("interval", "steps", "date")
activity.filled$steps <- as.numeric(as.character(activity.filled$steps))
Make a histogram of the total number of steps taken each day and Calculate and report the mean and median total number of steps taken per day. Do these values differ from the estimates from the first part of the assignment? What is the impact of imputing missing data on the estimates of the total daily number of steps?
perday.filled <- aggregate(activity.filled$steps, list(activity.filled$date),
    sum)  #sum steps for each date
names(perday.filled) <- c("date", "sum.steps.filled")
hist(perday.filled$sum.steps.filled, main = "Histogram of total steps taken per day \n with NA values replaced with averages across days",
    xlab = "Total steps taken in a day", ylab = "Frequency (days)")
perday.filled.mean <- mean(perday.filled$sum.steps.filled)
perday.filled.median <- median(perday.filled$sum.steps.filled)oldnew <- data.frame(old = c(perday.mean, perday.median), new = c(perday.filled.mean,
perday.filled.median))
rownames(oldnew) = c("mean", "median")
oldnew## old new
## mean 10766 10766
## median 10765 10766
The table above shows how the median and mean changed after filling in the NA values. As you can see, there is no change in the mean, and very little change in the median.
Create a new factor variable in the dataset with two levels – “weekday” and “weekend” indicating whether a given date is a weekday or weekend day.
activity.filled$week <- weekdays(activity.filled$date)
activity.filled[activity.filled$week == "Monday" | activity.filled$week == "Tuesday" |
    activity.filled$week == "Wednesday" | activity.filled$week == "Thursday" |
    activity.filled$week == "Friday", "week"] <- "Weekday"
activity.filled[activity.filled$week == "Saturday" | activity.filled$week ==
    "Sunday", "week"] <- "Weekend"
activity.filled$week <- as.factor(activity.filled$week)
str(activity.filled)
## 'data.frame': 17568 obs. of 4 variables:
## $ interval: int 0 0 0 0 0 0 0 0 0 0 ...
## $ steps : num 1.72 0 0 0 0 ...
## $ date : Date, format: "2012-10-01" "2012-11-23" ...
## $ week : Factor w/ 2 levels "Weekday","Weekend": 1 1 2 1 2 1 2 1 1 2 ...
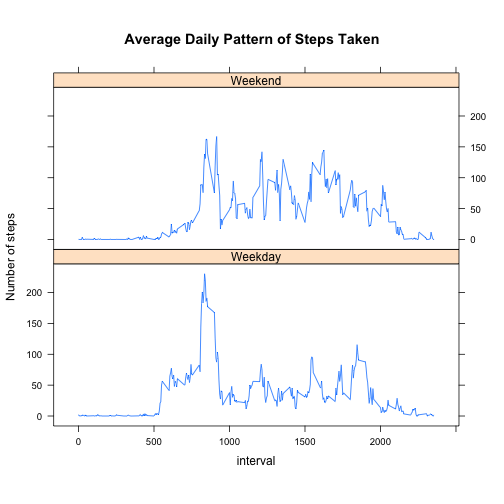
Make a panel plot containing a time series plot (i.e. type = "l") of the 5-minute interval (x-axis) and the average number of steps taken, averaged across all weekday days or weekend days (y-axis).
library(lattice)
par(mfrow = c(2, 1))
activity.filled.mean <- aggregate(activity.filled$steps, list(activity.filled$interval,
    activity.filled$week), mean)
names(activity.filled.mean) <- c("interval", "week", "mean.steps")
xyplot(mean.steps ~ interval | week, data = activity.filled.mean, type = "l",
    aspect = 2/5, ylab = "Number of steps", main = "Average Daily Pattern of Steps Taken")
As you can see above, the daily pattern of steps taken differs between weekdays and weekend. It appears that for both weekends and weekdays, there is a peak in the morning with lots of steps taken, and this peak begins earlier and is higher for weekdays. Furthermore, activity appears more distributed throughout the entire day during weekends relative to weekdays.


