- Create an account with Dynatrace
- Logging to Dynatrace
- Important: Latest interface vs classic View
- Deploy Dynatrace OneAgent
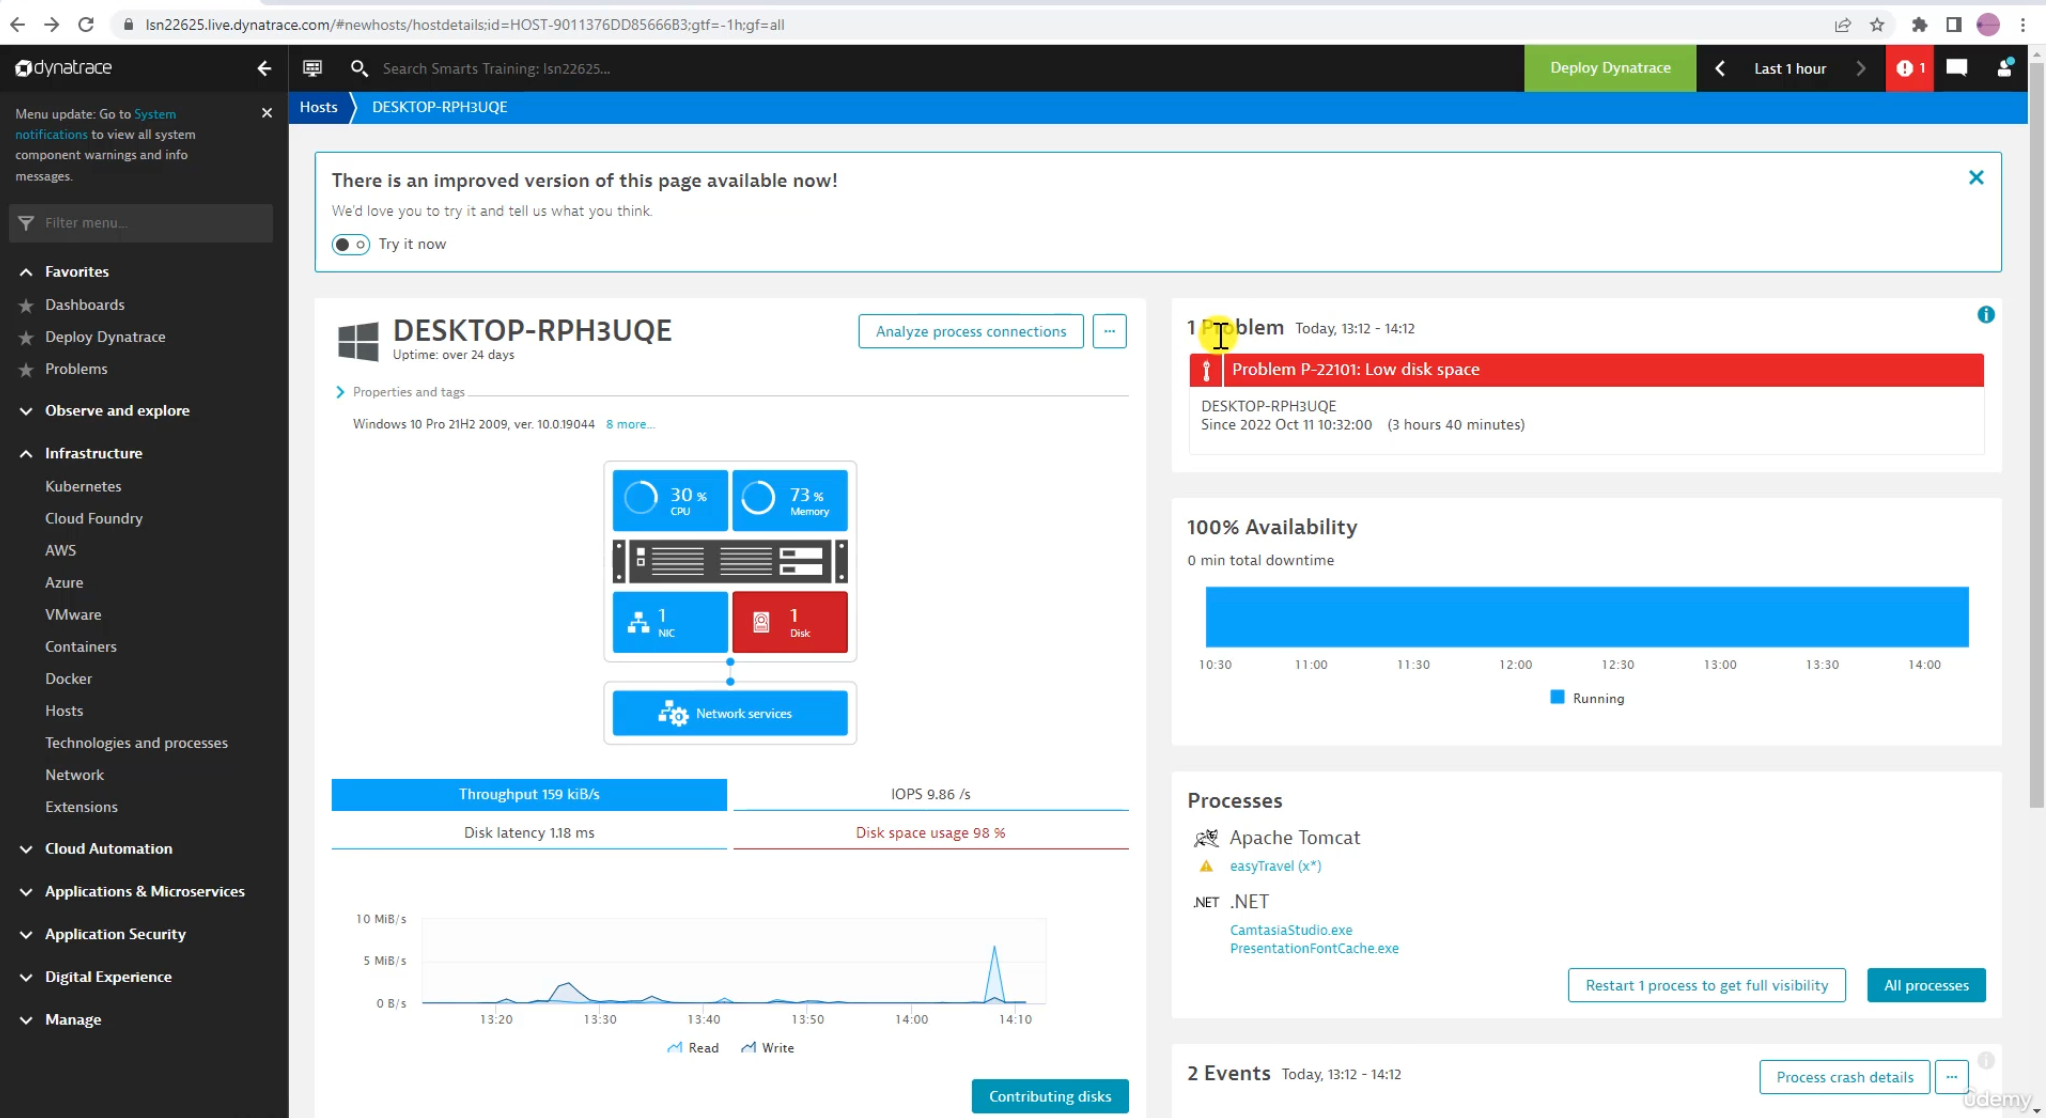
Dynatrace can alert you when a host is having problems. You can configure the alerting rules in the Settings -> Anomaly Detection -> Hosts -> Host availability section.
Host availability is the percentage of time that a host is available. It is calculated as the time the host is available divided by the total time.
- When its running its blue and when its offline its red.
- Offline does not mean the host is down, it could be that the agent is not running or there could be a communication error.
- It will also show the Maintenance window if one is set.
- So if you know the host is going to be down for maintenance you can set a maintenance window so that you don't get alerts.
We have an option to monitor the application and infrastructure. The application monitoring is done by the OneAgent. The OneAgent is a lightweight agent that is installed on the host and it collects data about the host and the applications running on the host. It has two modes:
- Full-stack monitoring: This is the default mode and it monitors the host and the applications running on the host.
- Infrastructure monitoring: This mode only monitors the host and not the applications running on the host.
The Full-stack option is going to be more expensive but has added benefits. The infrastructure monitoring is going to be cheaper but you will not get the application monitoring. It can be 3x less expensive to use the infrastructure monitoring.
Dynatrace a few cloud automation tools built in:
- Releases
- Service-level objectives: SLOs are a way to measure the performance of your application. You can set up SLOs in the Cloud Automation section of Dynatrace.


