
hpview is a GHC's .hp (heap profile) files viewer, implemented in Haskell + Gtk3.
It may be nicer than use of hp2pretty because of the follwing features:
- No need to convert
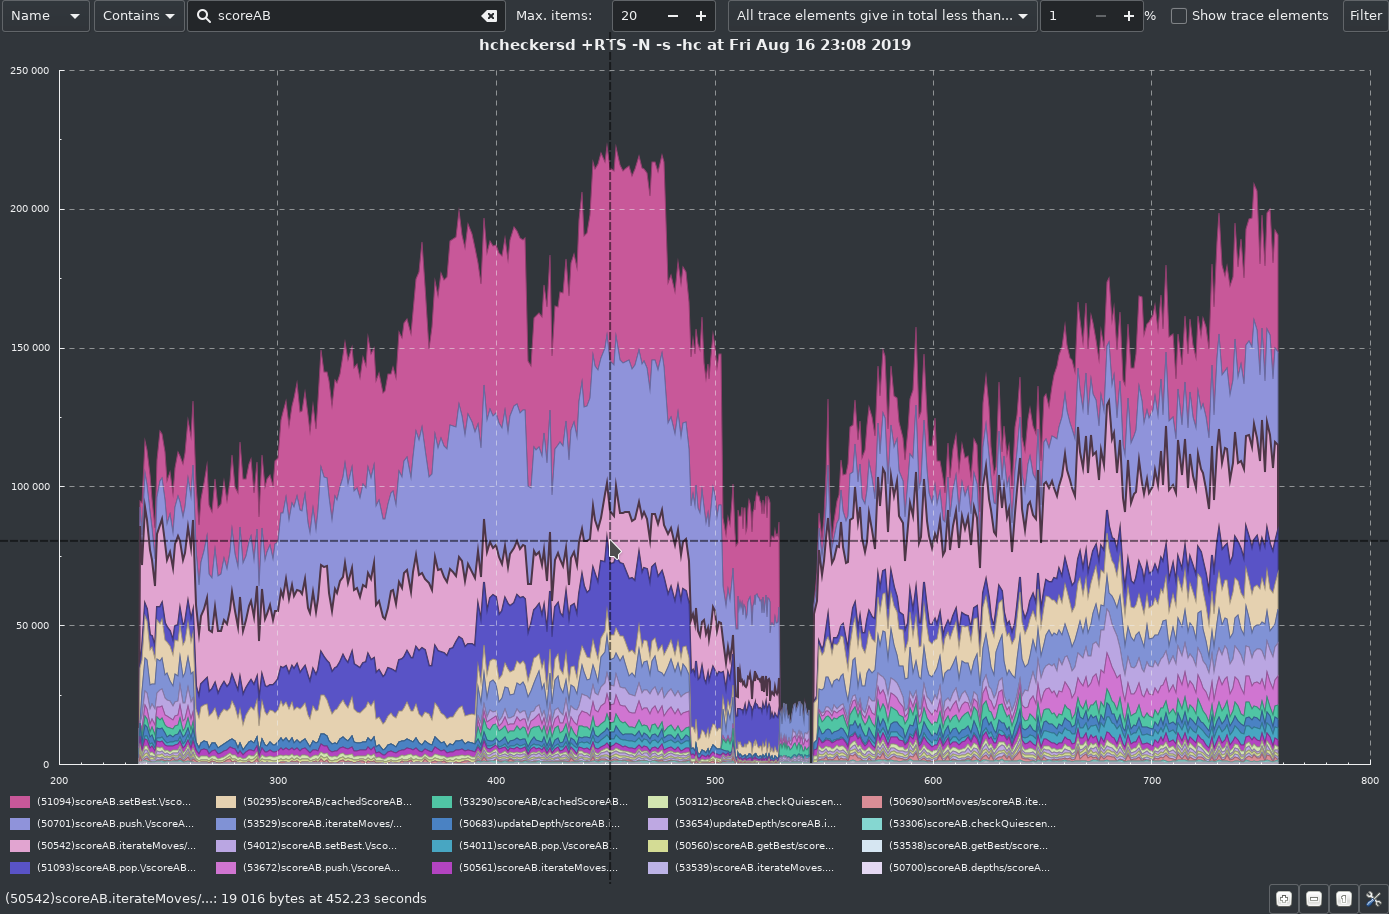
.hpto.svgand then open.svgwith another program, just runhpview file.hp. - Areas on plot are higlighted interactively (on mouse-over), and name of selected area is displayed in the statusbar. Statusbar also displays the timestamp pointed by cursor and amount of memory consumed by highlighted item at that moment. Grow ratio of the item being highlited is displayed also; grow ratio is calculated based on time period that is currently shown.
- Interactive filtering by item name, module or package name (module and
package filtering works for
-hcmode; for all other modes, only name filtering is useful). - Interactive filtering by grow rate. It is possible to ask to show, for example, items that grow faster than 15 KiB/s, or slower than 1 MiB/s. Grow ratio is calculated based on time period that is currently shown.
- Interactive zoom:
- Select time interval by dragging mouse with left button held pressed;
- Zoom selected part of the chart by clicking "Zoom In" button in the bottom right corner;
- Return to previous zoom level by clicking "Zoom Out" button in the bottom right corner;
- Return to original zoom level (to fit the whole chart into the window) by clicking "Reset Zoom" button in the bottom right corner.
- Displaying of "trace elements", i.e. items that occupy very small amounts of
memory. Such items are merged into one band called
(trace elements), ashp2prettydoes. There are several options for such elements:- To show or not to show trace elements at all
- Number of biggest items to show (10 by default)
- Two modes of trace elements detection:
- either select items that occupy less than N percents of memory in total, or
- select items, each of which occupies less than N percents of memory.
- Percentage of memory for trace elements is configurable.
- Legend may be enabled (by default) or disabled in preferences dialog; preferences dialog is called with a button in right bottom corner of the window.
- Highlighting of the area under mouse cursor may be disabled in preferences dialog.
- Optional downsampling. Downsampling algorithm is very simple (it just takes
each N'ths item) and thus not very precise; but downsampling can make the
resulting chart much cleaner and more readable, and also it helps with
performance. Number of samples to use is specified in the preferences window.
By default, downsampling to 500 samples is used; it means that
hpviewwill draw not more than 500 samples along time axis on the screen. You may use interactive zooming on the area of interest if you wish to see more details. - It is possible to save currently displayed chart (with current filter, zoom and so on) as PNG or SVG file - see the "save as" button in the top right corner of the window, next to "filter" button.
Other features may be added later.
Performance: it takes about 25 seconds to display a .hp file of 181 Mb in
size on my machine (i5 2.8GHz), from start to displayed chart, without
downsampling. With downsampling to 500 samples, it takes about 17 seconds. In
my practice, usually smaller files give even more insight into what's going on
than bigger ones; so I am not going to invest a lot of time into this matter.
But PRs are welcome.
Install it by stack:
$ sudo apt-get install stack
$ git clone https://github.com/portnov/hpview.git
$ cd hpview/
$ stack install
Note: hpview currently depends on master branch of haskell-chart and on
master branch of formattable packages; but stack will take care of that.