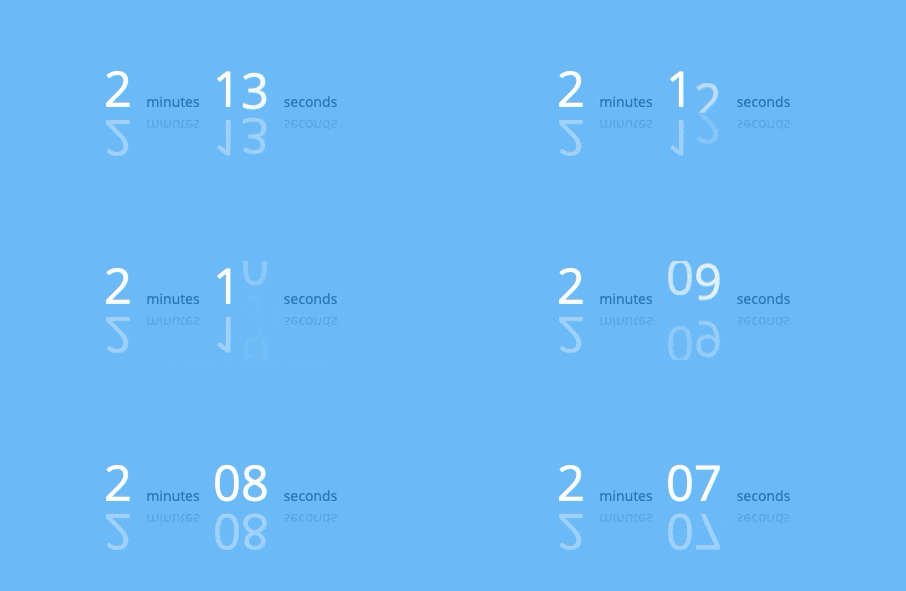
A ticker for declaritive building of countdowns and counters.
Supports:
- Counting towards a date
- Counting up from a date
- Scheduling multiple intervals
- Polling a value from a server
- Presenting a simple value
Some examples:
You can also use Tick to create Flip counters
Made with ❤ By Rik Schennink
Information on how to customize Tick and use the Tick API can be found on the product website.
See index below:
npm i @pqina/tick --save
import Tick from '@pqina/tick';

console.log(Tick);
// logs {supported: true, options: {…}, helper: {…}, data: {…}, DOM: {…}, …}Building Tick Counters is very similar to building with Legos. Open the example implementation, clear the existing example, and follow along.
Start with the base .tick block:
<div class="tick">

</div>
We haven't yet entered a value so we won't see anything on the screen.
Let's do that now, add a value using the data-value attribute.
<div class="tick"
     data-value="50">

</div>
Tick now automatically adds a plain "text" view to present our value.
We can also present strings instead of numbers.
<div class="tick"
     data-value="Hello World">

</div
This is useful but not very spectacular, let's do something more interesting. We'll switch back to numbers and setup a "line" progress counter.
We tell Tick to render a different view by adding an HTML element with a data-view attribute. In this case the line view.
<div class="tick"
     data-value="50">

    <span data-view="line"></span>

</div>
It does not show the set progress. Maybe it's because there's no room to render our line view. We'll replace the span element with a div to make it stretch the entire width of the demo area.
<div class="tick"
     data-value="50">

    <div data-view="line"></div>

</div>
That wasn't it.
We don't see anything because line doesn't know its maximum value and therefor cannot determine what progress to show. We have to feed line a a value between 0 and 1, where 0 is empty and 1 is full.
We can do this by telling it the maximum value. We'll add a transform that calculates the value between 0 and 1 for a value in a certain range (in this case 0 and 100).
<div class="tick"
     data-value="50">

    <div data-view="line" data-transform="fraction(0,100)"></div>

</div>
There we go! We put in a value of 50 and the fraction transform turns it into 0.5
Let's update our counter each second so we can see the progress bar fill up. Bind a function to the data-did-init callback. We'll limit its value to a 100.
We'll also add a nice animation using the spring transform. See how we can pipe values from one transform to the other.
<div class="tick"
     data-value="50"
     data-did-init="handleTickInit">

    <div data-view="line" data-transform="fraction(0,100) -> spring"></div>

</div>
<script>
function handleTickInit(tick) {

    // The Tick `interval` function is an easy way to quickly setup a timer
    Tick.helper.interval(function() {

        // We simply increase the value of our ticker each second
        if (tick.value < 100) {
            tick.value += 5;
        }
        else {
            tick.value = 0;
        }

    });

}
</script>
There you have it, a simple progress bar build with Tick.
Read the documentation to take a deep dive into what's possible with Tick.
MIT License, Enjoy!


