An R package to detect changepoints using nonparametric methods. This package is an extension to the [changepoint R package] (https://cran.r-project.org/web/packages/changepoint/index.html) which looks at parametric methods for changepoint detection.
Currently the method uses PELT with a cost function based on the empirical distribution
set.seed(12)

J <- function(x){
   (1+sign(x))/2
 }

n <- 1000
tau <- c(0.1,0.13,0.15,0.23,0.25,0.4,0.44,0.65,0.76,0.78,0.81)*n
h <- c(2.01, -2.51, 1.51, -2.01, 2.51, -2.11, 1.05, 2.16, -1.56, 2.56, -2.11)
sigma <- 0.5
t <- seq(0,1,length.out = n)
data <- array()
for (i in 1:n){
   data[i] <- sum(h*J(n*t[i] - tau)) + (sigma * rnorm(1))
}

out <- cpt.np(data, penalty = "SIC",method="PELT",test.stat="empirical_distribution",
             class=TRUE,minseglen=2, nquantiles =4*log(length(data)))
changepoint::cpts(out)

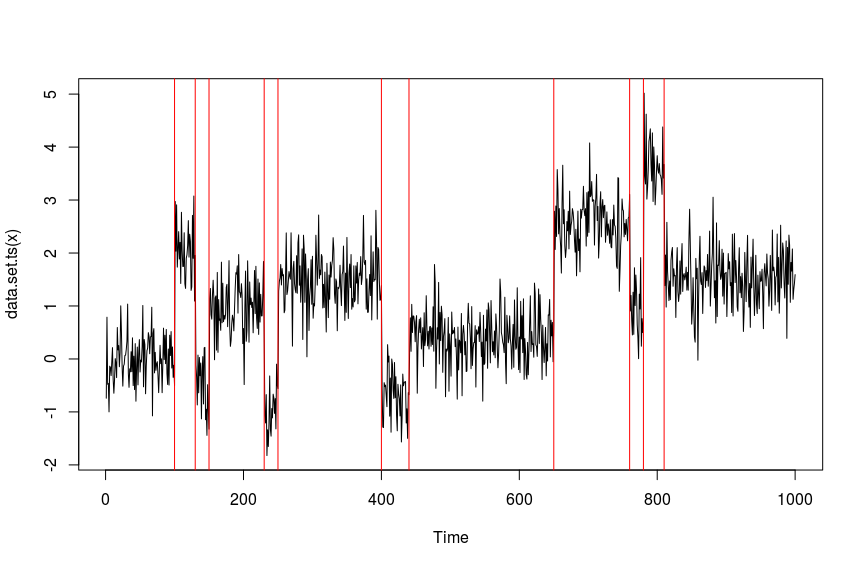
#returns 100 130 150 230 250 400 440 650 760 780 810 as the changepoint locations.

plot(out)
####### Heart Rate Example
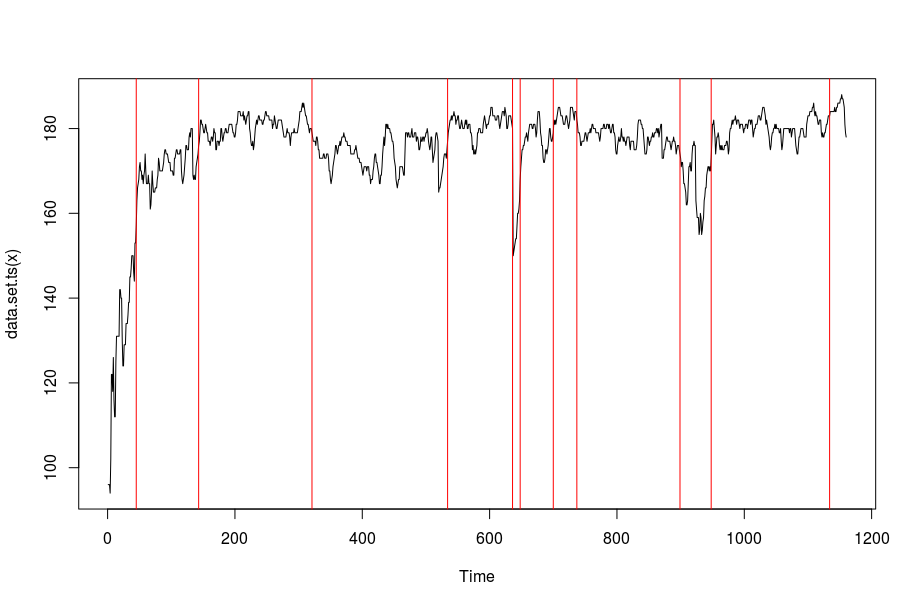
This example uses heart rate data recorded using a wearable heart rate monitor whilst running. We use the CROPS penalty in this situation. The diagnostic plot gives us an idea of how many changes to choose (the point on the elbow).
cptHeartRate <- cpt.np(HeartRate, penalty = "CROPS", pen.value = c(25,200), method="PELT",
   test.stat="empirical_distribution",class=TRUE,minseglen=2, nquantiles =4*log(length(HeartRate)))

plot(cptHeartRate, diagnostic = TRUE)
plot(cptHeartRate, ncpts = 11)


