As of December 2021, Confluent recommends using the export endpoint of the Confluent Cloud Metrics API to extract metrics instead of running a separate service such as the ccloudexporter. This endpoint can be scraped directly with a Prometheus server or other Open Metrics compatible scrapers.
A simple Prometheus exporter that can be used to extract metrics from Confluent Cloud Metric API.
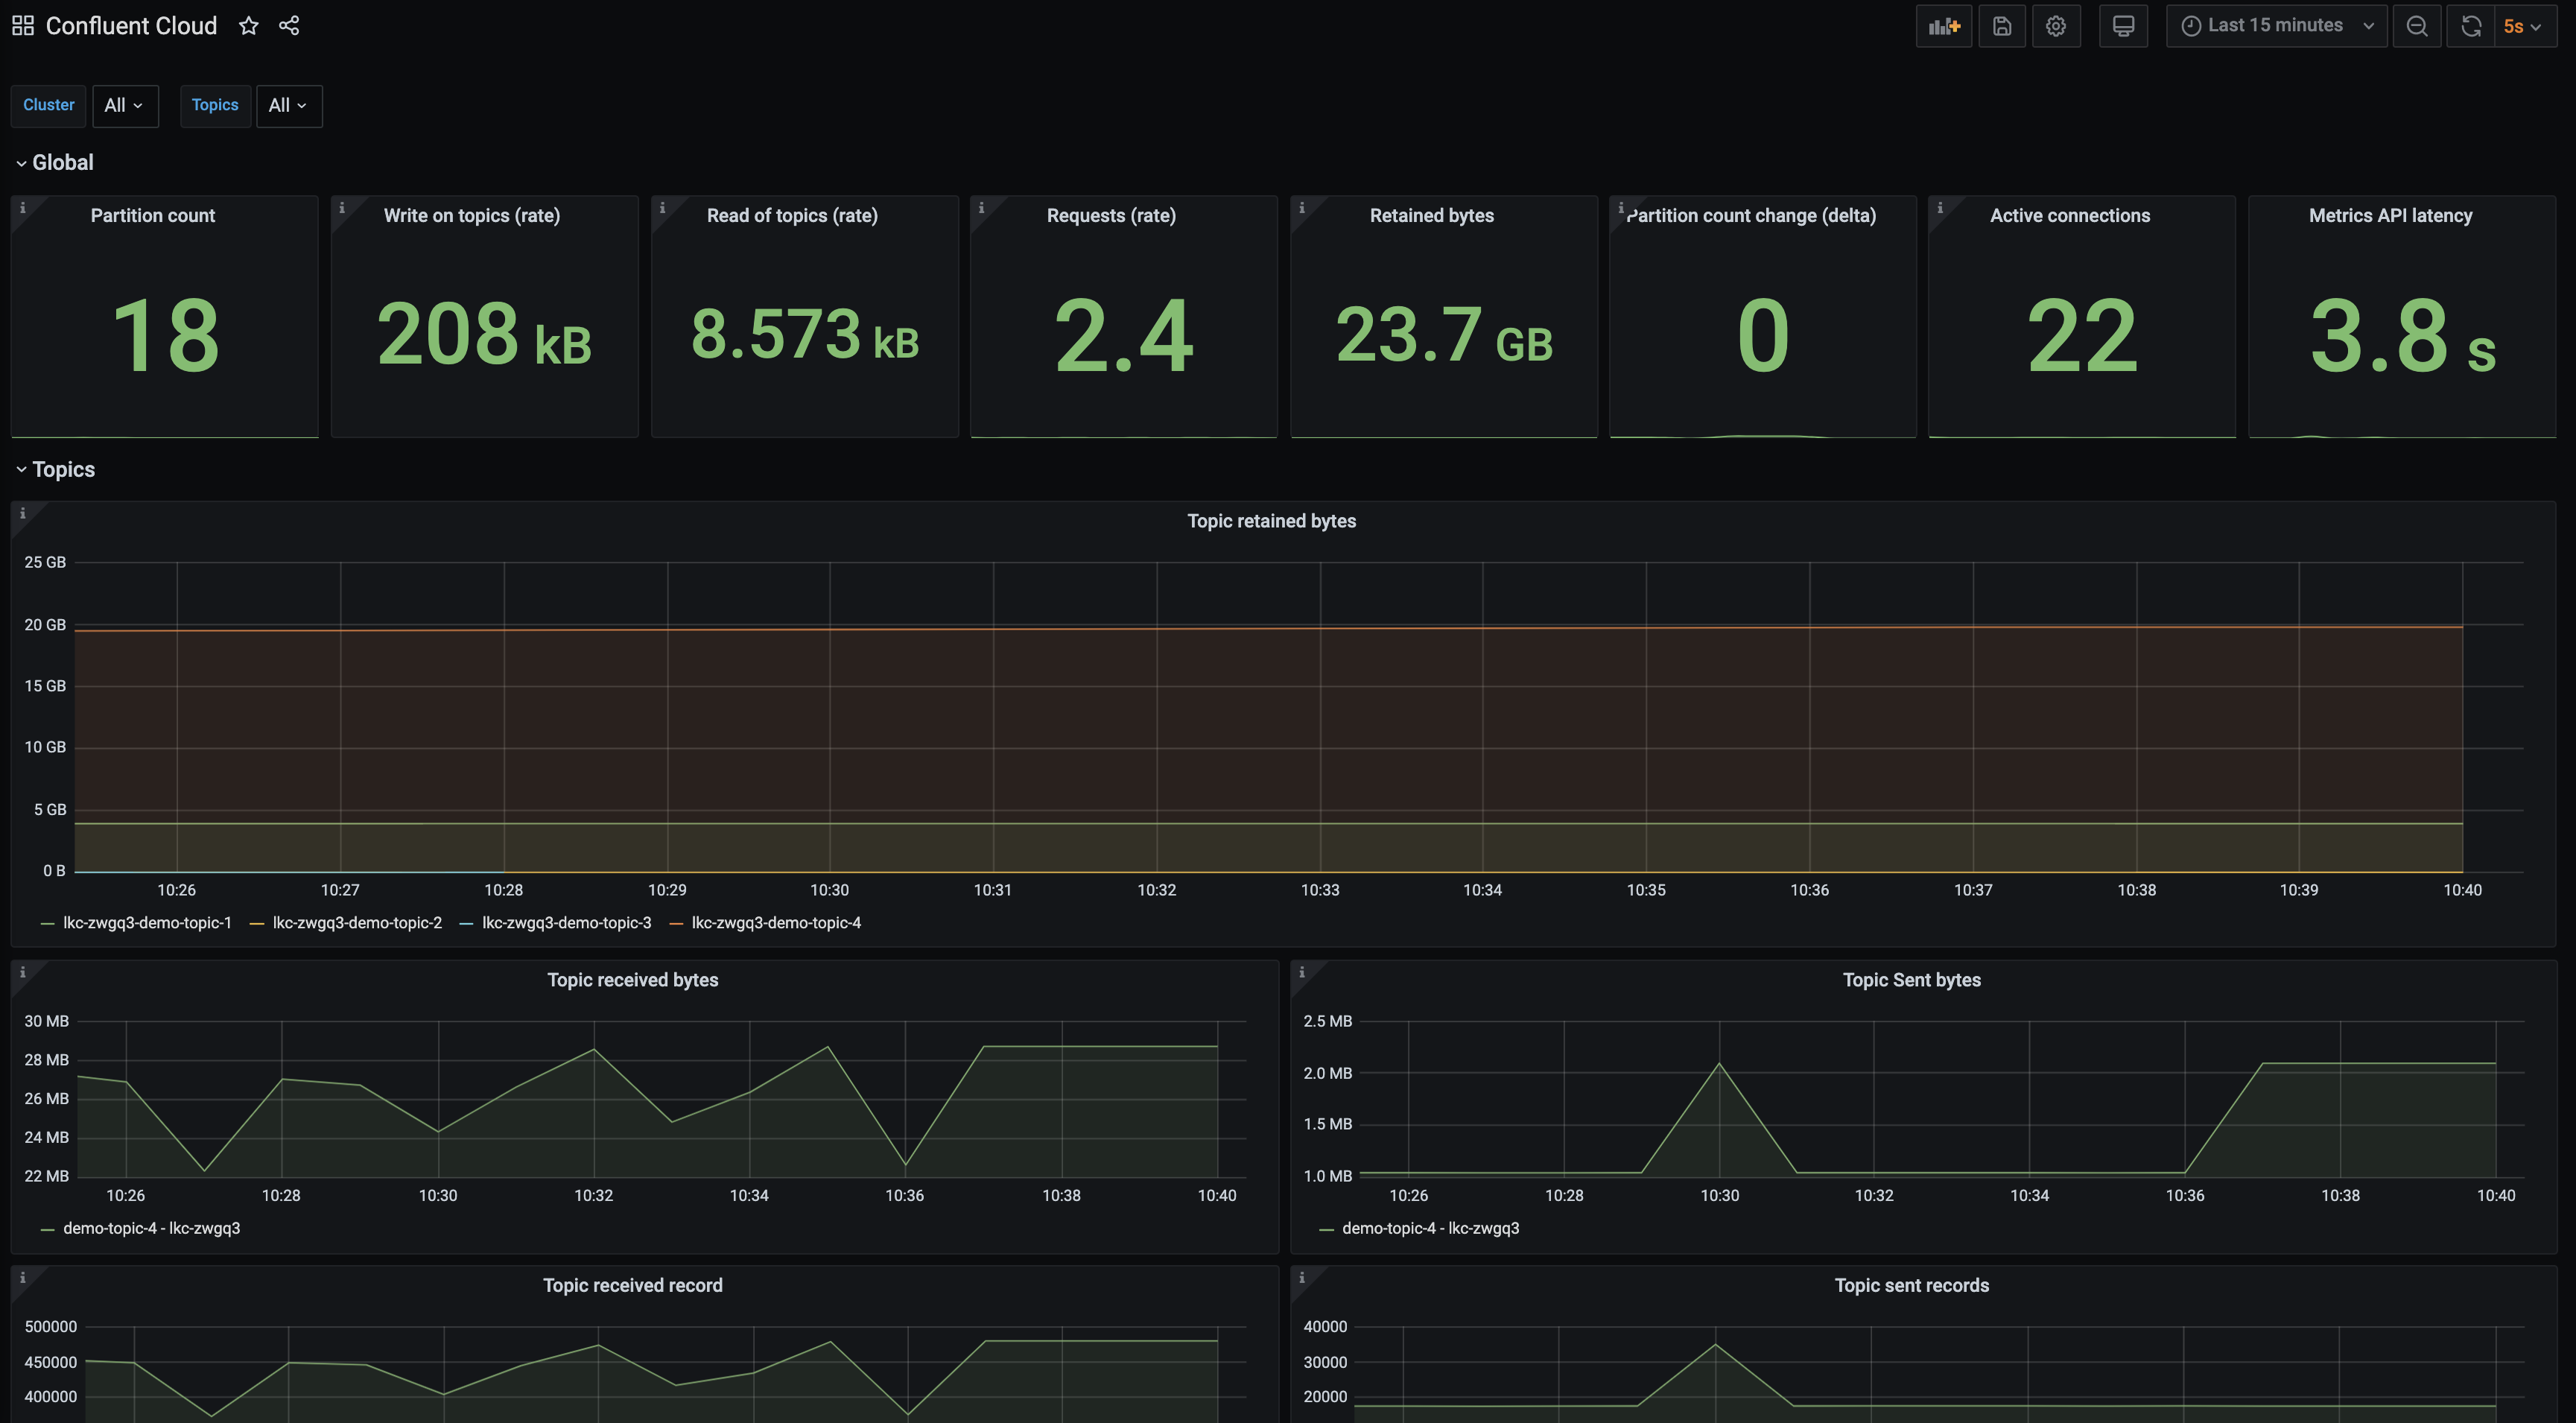
By default, the exporter will be exposing the metrics on port 2112. When launching with Docker Compose, metrics are displayed via a Grafana dashboard on http://localhost:3000 (admin/admin).
To use the exporter, the following environment variables need to be specified:
CCLOUD_API_KEY: The API Key created withccloud api-key create --resource cloudCCLOUD_API_SECRET: The API Key Secret created withccloud api-key create --resource cloud
CCLOUD_API_KEY and CCLOUD_API_SECRET environment variables will be used to invoke the https://api.telemetry.confluent.cloud endpoint.
./ccloudexporter [-cluster <cluster_id>] [-connector <connector_id>] [-ksqlDB <app_id>] [-schemaRegistry <sr_id>]Usage of ./ccloudexporter:
-cached-second int
Number of second that data will be cached in-memory and returned to Prometheus. This is a mechanism to protect the MetricsAPI from being flooded. (default 30)
-cluster string
Comma separated list of cluster ID to fetch metric for. If not specified, the environment variable CCLOUD_CLUSTER will be used
-config string
Path to configuration file used to override default behavior of ccloudexporter
-connector string
Comma separated list of connector ID to fetch metric for. If not specified, the environment variable CCLOUD_CONNECTOR will be used
-delay int
Delay, in seconds, to fetch the metrics. By default set to 120, this, in order to avoid temporary data points. (default 120)
-endpoint string
Base URL for the Metric API (default "https://api.telemetry.confluent.cloud/")
-granularity string
Granularity for the metrics query, by default set to 1 minutes (default "PT1M")
-ksqlDB string
Comma separated list of ksqlDB application to fetch metric for. If not specified, the environment variable CCLOUD_KSQL will be used
-schemaRegistry string
Comma separated list of Schema Registry ID to fetch metric for. If not specified, the environment variable CCLOUD_SCHEMA_REGISTRY will be used
-listener string
Listener for the HTTP interface (default ":2112")
-log-pretty-print
Pretty print the JSON log output (default true)
-no-timestamp
Do not propagate the timestamp from the the metrics API to prometheus
-timeout int
Timeout, in second, to use for all REST call with the Metric API (default 60)
-verbose
Print trace level logs to stdout
-version
Print the current version and exit
go get github.com/Dabz/ccloudexporter/cmd/ccloudexporter
go install github.com/Dabz/ccloudexporter/cmd/ccloudexporter
export CCLOUD_API_KEY=ABCDEFGHIKLMNOP
export CCLOUD_API_SECRET=XXXXXXXXXXXXXXXX
./ccloudexporter -cluster lkc-abc123docker run \
-e CCLOUD_API_KEY=$CCLOUD_API_KEY \
-e CCLOUD_API_SECRET=$CCLOUD_API_SECRET \
-e CCLOUD_CLUSTER=lkc-abc123 \
-p 2112:2112 \
dabz/ccloudexporter:latestexport CCLOUD_API_KEY=ABCDEFGHIKLMNOP
export CCLOUD_API_SECRET=XXXXXXXXXXXXXXXX
export CCLOUD_CLUSTER=lkc-abc123
docker-compose up -dIn addition to the metrics exporter and Prometheus containers, the Docker Compose launch starts a Grafana on http://localhost:3000 (admin/admin). The launch pre-provisions a Prometheus datasource for the Confluent Cloud metrics and a default dashboard.
The Docker Compose service definitions include data volumes for both Prometheus and Grafana, so metrics data will be retained following docker-compose down and restored when containers are started again. To remove these volumes and start with empty Prometheus and Grafana databases, run docker-compose down --volumes.
Kubernetes deployment with Prometheus Operator.
These following lines assume there is Prometheus Operator already running in the cluster with label: release=monitoring.
Add the list of cluster ids separated by spaces in ./kubernetes/ccloud_exporter.env, for example: CCLOUD_CLUSTERS=<cluster_id1> <cluster_id2> ....
cp ./ccloud_exporter.env-template ./kubernetes/ccloud_exporter.env
cd ./kubernetes
vim ./ccloud_exporter.env
make install
A Deployment and a Service object are deployed to a unique namespace. A ServiceMonitor CRD is deployed to the Prometheus Operator namespace.
To delete deployment: cd ./kubernetes && make remove
For more advanced deployment, you could specify a YAML configuration file with the -config flag.
If you do not provide a configuration file, the exporter creates one from the provided flags.
| Key | Description | Default value |
|---|---|---|
| config.http.baseurl | Base URL for the Metric API | https://api.telemetry.confluent.cloud/ |
| config.http.timeout | Timeout, in second, to use for all REST call with the Metric API | 60 |
| config.listener | Listener for the HTTP interface | :2112 |
| config.noTimestamp | Do not propagate the timestamp from the metrics API to prometheus | false |
| config.delay | Delay, in seconds, to fetch the metrics. By default set to 120, this, in order to avoid temporary data points | 120 |
| config.granularity | Granularity for the metrics query, by default set to 1 minute | PT1M |
| config.cachedSecond | Number of second that data will be cached in-memory and returned to Prometheus. | 30 |
| rules | List of rules that need to be executed to fetch metrics |
| Key | Description |
|---|---|
| rules.clusters | List of Kafka clusters to fetch metrics for |
| rules.connectors | List of connectors to fetch metrics for |
| rules.ksqls | List of ksqlDB applications to fetch metrics for |
| rules.schemaRegistries | List of Schema Registries id to fetch metrics for |
| rules.labels | Labels to exposed to Prometheus and group by in the query |
| rules.topics | Optional list of topics to filter the metrics |
| rules.metrics | List of metrics to gather |
- A simple configuration to fetch metrics for a cluster: simple.yaml
- A configuration to fetch metrics at the partition granularity for a few topics: partition.yaml
config:
  http:
    baseurl: https://api.telemetry.confluent.cloud/
    timeout: 60
  listener: 0.0.0.0:2112
  noTimestamp: false
  delay: 60
  granularity: PT1M
  cachedSecond: 30
rules:
  - clusters:
      - $CCLOUD_CLUSTER
    connectors:
      - $CCLOUD_CONNECTOR
    ksqls:
      - $CCLOUD_KSQL
    schemaRegistries:
      - $CCLOUD_SCHEMA_REGISTRY
    metrics:
      - io.confluent.kafka.server/received_bytes
      - io.confluent.kafka.server/sent_bytes
      - io.confluent.kafka.server/received_records
      - io.confluent.kafka.server/sent_records
      - io.confluent.kafka.server/retained_bytes
      - io.confluent.kafka.server/active_connection_count
      - io.confluent.kafka.server/request_count
      - io.confluent.kafka.server/partition_count
      - io.confluent.kafka.server/successful_authentication_count
      - io.confluent.kafka.connect/sent_bytes
      - io.confluent.kafka.connect/received_bytes
      - io.confluent.kafka.connect/received_records
      - io.confluent.kafka.connect/sent_records
      - io.confluent.kafka.connect/dead_letter_queue_records
      - io.confluent.kafka.ksql/streaming_unit_count
      - io.confluent.kafka.schema_registry/schema_count
    labels:
      - kafka_id
      - topic
- typeIn order to avoid reaching the limit of 1,000 points set by the Confluent Cloud Metrics API, the following soft limits has been established in the exporter:
- In order to group by partition, you need to specify one or multiple topics
- You cannot specify more than 100 topics in a single rule
clusters,labelsandmetricsare required in each rule
go get github.com/Dabz/ccloudexporter/cmd/ccloudexporter
A Grafana dashboard is provided in ./grafana/ folder.
Historically, the exporter and the Metrics API exposed the ID of the cluster with the label cluster_id.
In the Metrics API V2, this label has been renamed to resource.kafka.id. It is now exposed by the exporter as kafka_id instead.
To avoid breaking previous dashboard, the exporter is exposing, for the moment, the ID of the cluster as cluster_id and kafka_id.
In previous versions, it was possible to rely on username/password to authenticate to Confluent Cloud. Nowadays, only the API key/secret is officially supported to connect to the Metrics API.
To ensure backward compatibility, previous environment variables are still available. Nonetheless, username/password is now deprecated and you must rely on API key/secret.
In real world, customers would want to integrate with their existing logging, monitoring and alerting solutions. Here, we're trying to accommodate as many tooling examples as possible to showcase how the Metrics API can be integrated with.
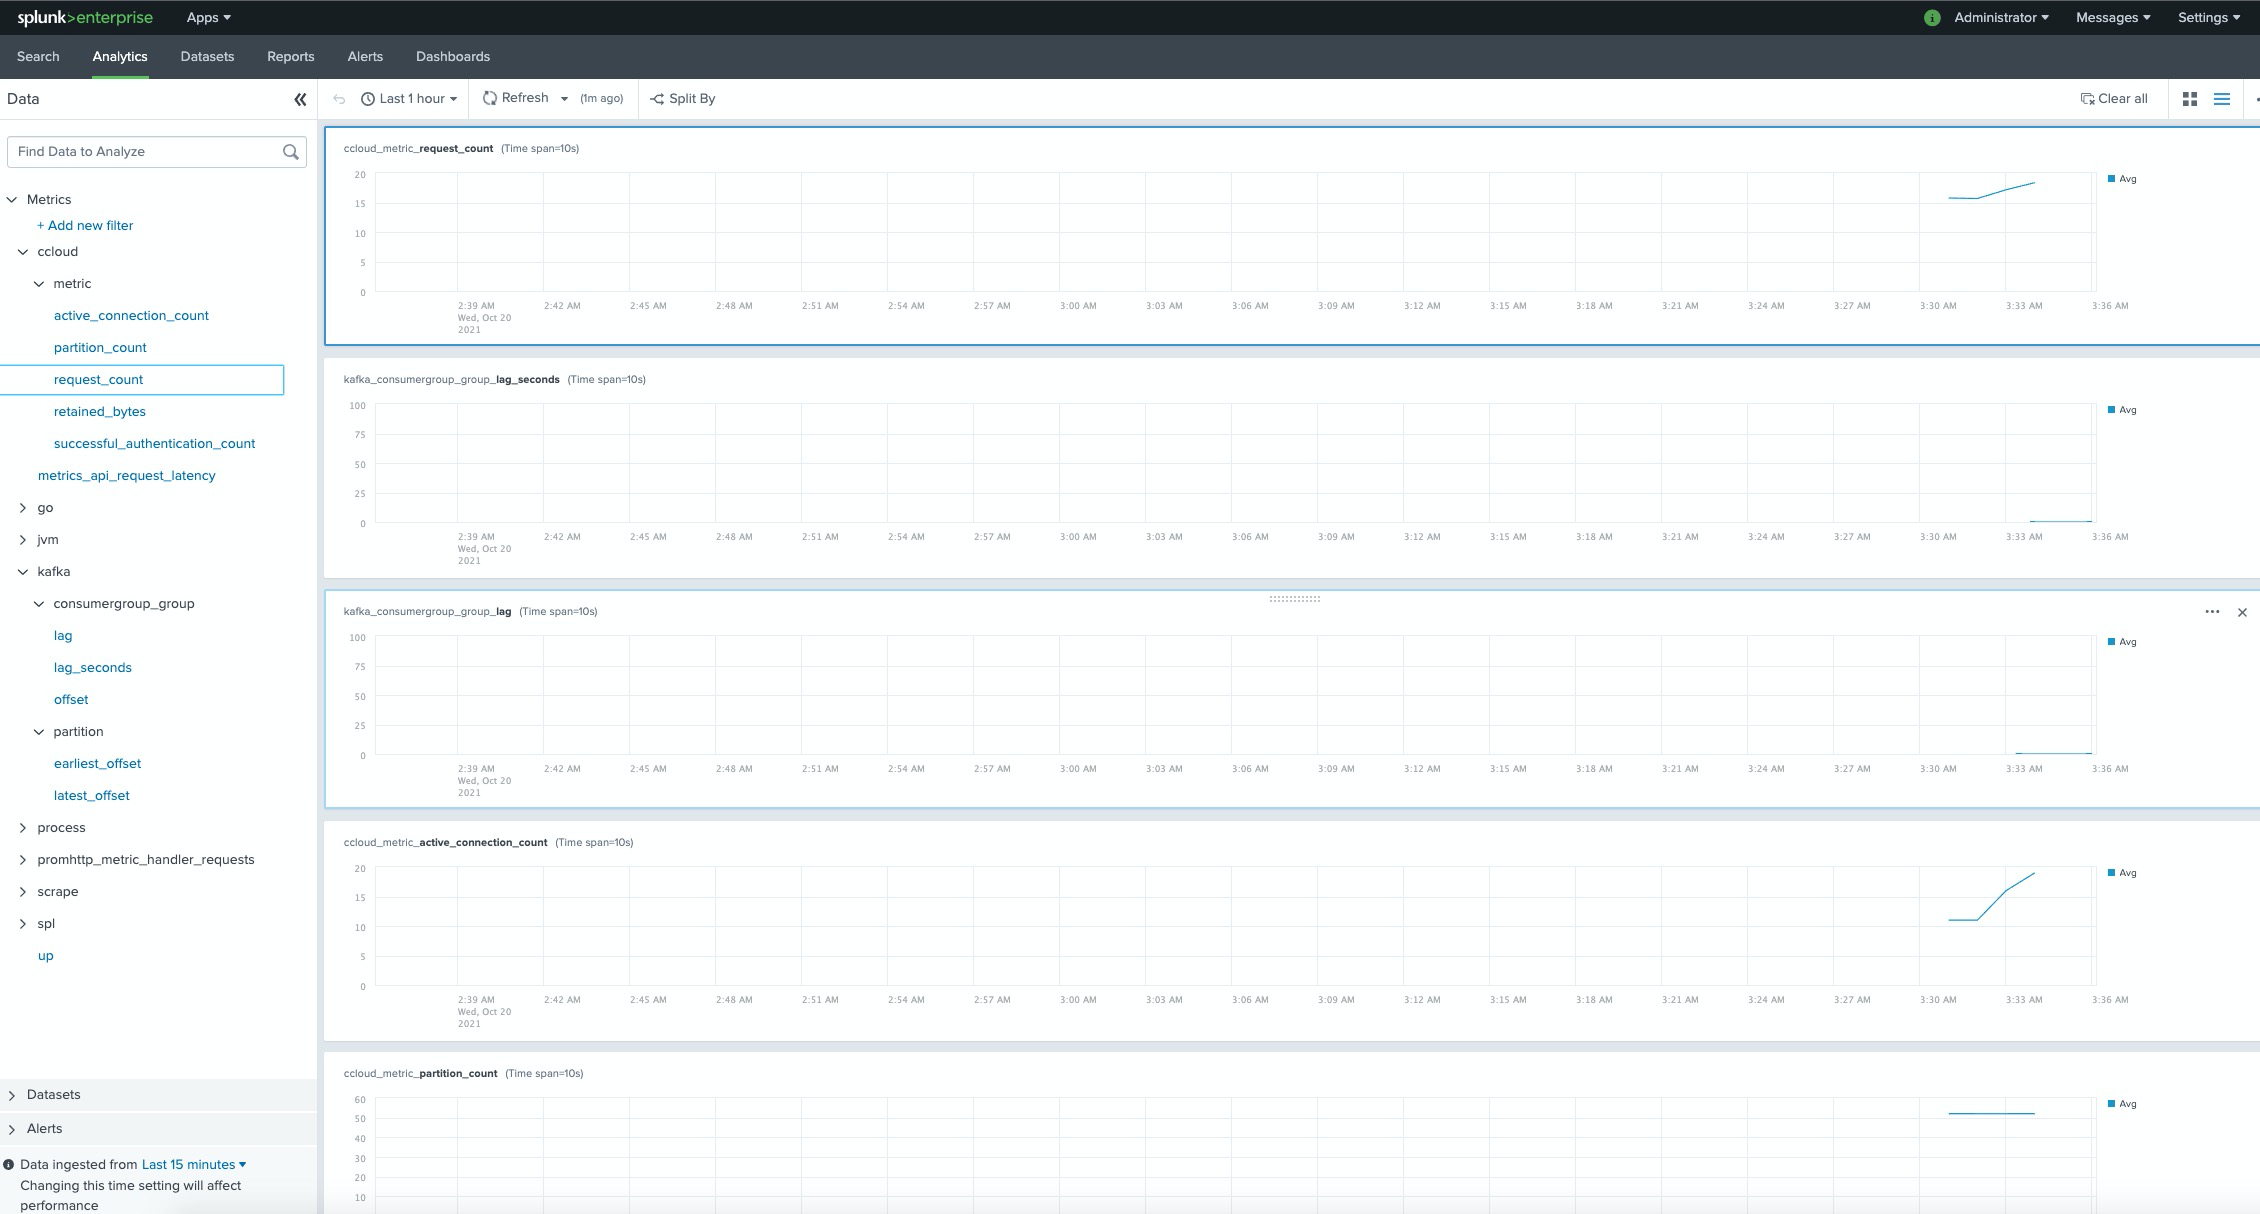
Let's take a look at how to see the cloud metrics on Splunk dashboard. A docker-compose yaml is created to include:
- cclouder exporter image to pull metrics from the CCloud MetricsAPI
- kafka lag exporter image to pull consumer-group metrics from the Admin client
- Splunk's Open Telemetry Collector image that'd receive metrics from Prometheus' /metrics endpoint
- Splunk's standalone container to view the Analytics dashboard
- This set up is done by tweaking the needed details here
- Set CCloud-related parameters in both docker.compose.yaml and application.conf files
- Run the docker.compose.yaml using command docker-compose up --build
- Check analytics workspace here
- Metrics will show up like this:

For a tutorial that showcases how to use ccloudexporter, and steps through various failure scenarios to see how they are reflected in the provided metrics, see the Observability for Apache Kafka® Clients to Confluent Cloud tutorial.
