To write a program to implement the simple linear regression model for predicting the marks scored.
- Hardware – PCs.
- Anaconda – Python 3.7 Installation / Moodle-Code Runner.
Use the standard libraries such as numpy, pandas, matplotlib.pyplot in python for the simple linear regression model for predicting the marks scored.
Set variables for assigning dataset values and implement the .iloc module for slicing the values of the variables X and y.
Import the following modules for linear regression; from sklearn.model_selection import train_test_split and also from sklearn.linear_model import LinearRegression.
Assign the points for representing the points required for the fitting of the straight line in the graph.
Predict the regression of the straight line for marks by using the representation of the graph.
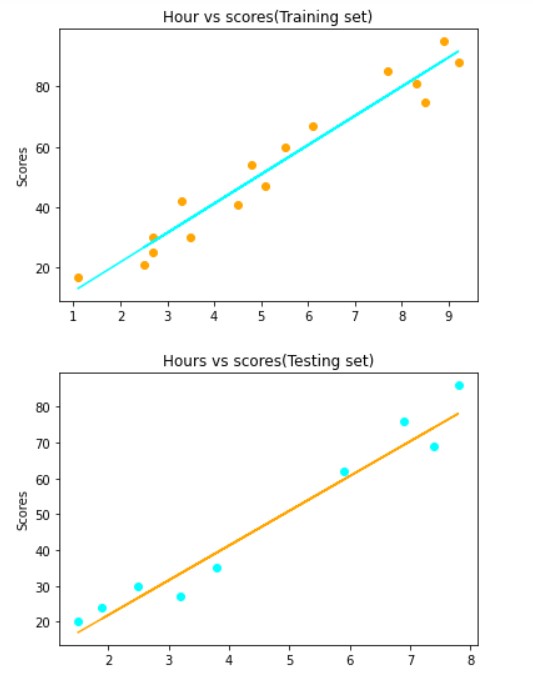
Compare the graphs (Training set, Testing set) and hence we obtained the simple linear regression model for predicting the marks scored using the given datas.
End the program.
/*
Program to implement the simple linear regression model for predicting the marks scored...
Developed by: PRANAVE B
RegisterNumber: 212221240040
*/

import numpy as np
import pandas as pd
import matplotlib.pyplot as plt
dataset= pd.read_csv('student_scores.csv')
dataset.head()
X=dataset.iloc[:,:-1].values
X
y=dataset.iloc[:,1].values
y
from sklearn.model_selection import train_test_split
X_train,X_test,y_train,y_test=train_test_split(X,y,test_size=1/3,random_state=0)
from sklearn.linear_model import LinearRegression
regressor=LinearRegression()
regressor.fit(X_train,y_train)
y_pred=regressor.predict(X_test)
y_pred
y_test
plt.scatter(X_train,y_train,color='orange')
plt.plot(X_train,regressor.predict(X_train),color='cyan')
plt.title("Hour vs scores(Training set)")
#plt.xlabel("Hours")
plt.ylabel("Scores")
plt.show()
plt.scatter(X_test,y_test,color='cyan')
plt.plot(X_test,regressor.predict(X_test),color='orange')#plotting the regression line
plt.title("Hours vs scores(Testing set)")
#plt.xlabel("Hours")
plt.ylabel("Scores")
plt.show()
Thus the program to implement the simple linear regression model for predicting the marks scored is written and verified using python programming.
