With the increasing adoption of Massive Online Open Courses (MOOC), newer educational systems are being built, which can gauge the needs of students to suggest them courses appropriate for them. One of the key factors these systems could consider is the prediction whether if the student given the course would pass or fail the course. Apart from considering the academic factors, these systems could also take into account the personal factors like age, gender, region and disability in their prediction decision, which poses a risk of being unfair while using these attributes. There is a great scope in building fair educational systems, which can be used to provide courses to all in a fair manner.
In this tutorial, we show how Seldonian algorithm can be used in this context to build a fair online education system which is fair across various student demographics. We use the OULAD dataset here, which contains information about 32593 students and their demographic data, used in predicting whether a student is likely to pass the courses offered by Open University. Open University is a public British University that also has the highest number of undergraduate students in the UK. The data presented here is sourced from the Open University's Online Learning platform.
The dataset for this tutorial can be found at this link and the file preprocess.py converts the dataset, into a format suitable for our task. The following outline the dataset preparation process of our pipeline.
-
Firstly, we dropped the columns like student ID which have no importance in the predicition pipeline.
-
Secondly, we manipulated the columns like highest education where we grouped divisions like A level or equivalent, post grads, and HE qualification to be a boolean 1 whereas lower than A level and no formal quals to be 0. This is done in order to make
higher_edattribute to be binary valued, which is used for further analysis. -
We also converted columns like distinction to binaries.
-
The next step is to convert the categorical variables into numerical values. This is done using the LabelEncoder function of the scikit-learn library. The LabelEncoder function assigns a numerical value to each unique categorical value in the column.
-
After converting the categorical variables, the next step is to standardize the numerical variables. This is done using the StandardScaler function of the scikit-learn library. The StandardScaler function standardizes the numerical variables by subtracting the mean and dividing by the standard deviation.
Once the preprocessing steps are complete, we save the dataframe and the meta data which is later used in training and experimentation. The preprocessing step is necessary because we want to work upon the attributes of gender, disability and higher_education to assess whether the predictions are unfair on these attributes.
exp.py takes care of running the seldonian experiments across various spec objects. The file takes two command line inputs: <attribute> which is the name of the attribute to be considered for analysis ([gender,higher_ed,disability]) and <constraint_type> which is the nature of the constraint string used to create the spec object ([disp,eq]).
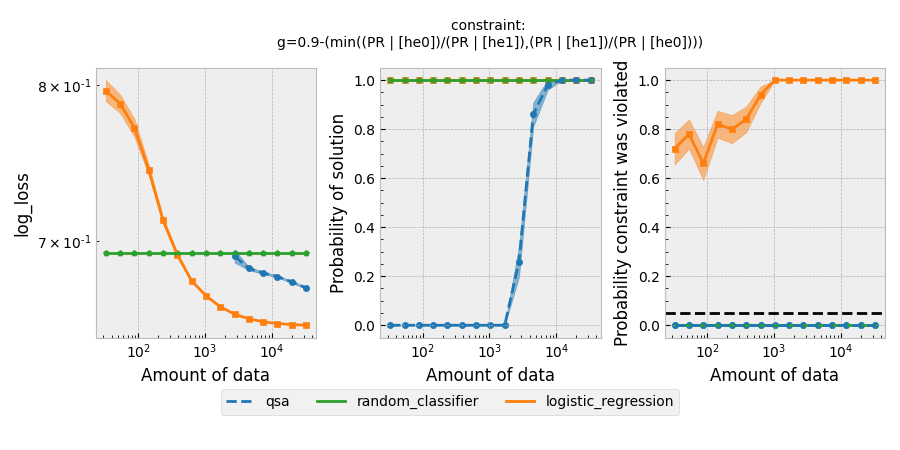
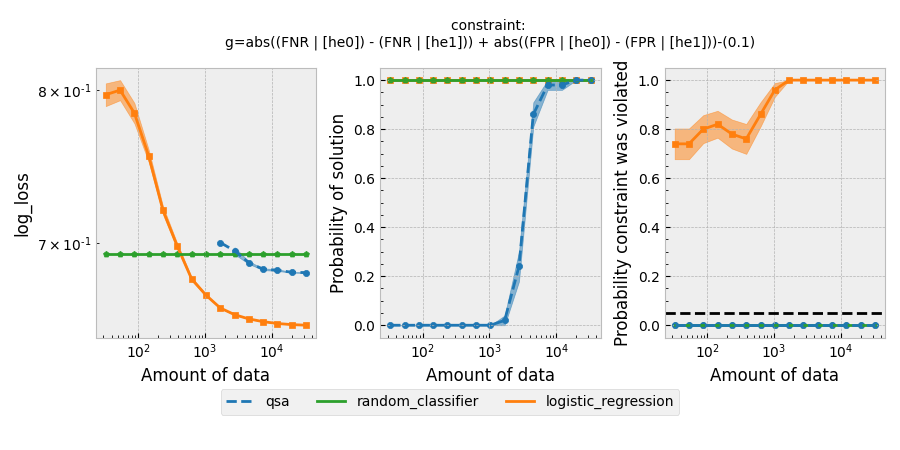
Running this script for all the spec objects creates the following experiment plots
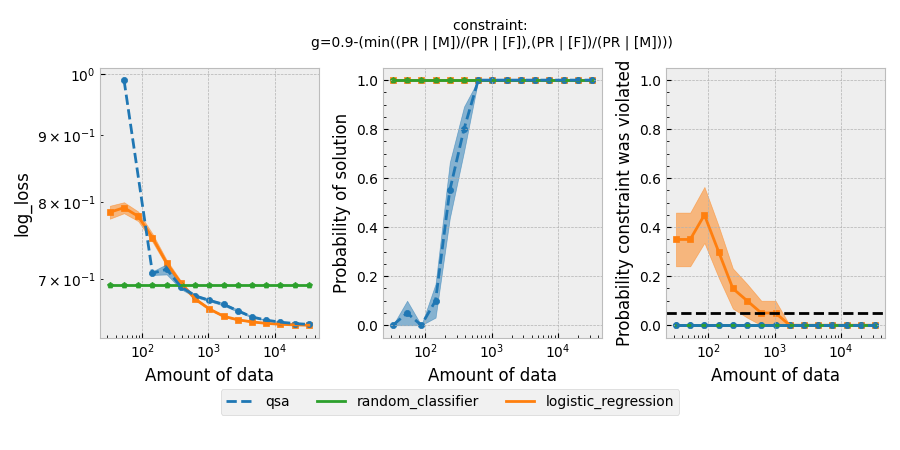
Figure 1: Seldonian Experiments using disparate impact and equalized odds as the definition of fairness on the gender attribute.
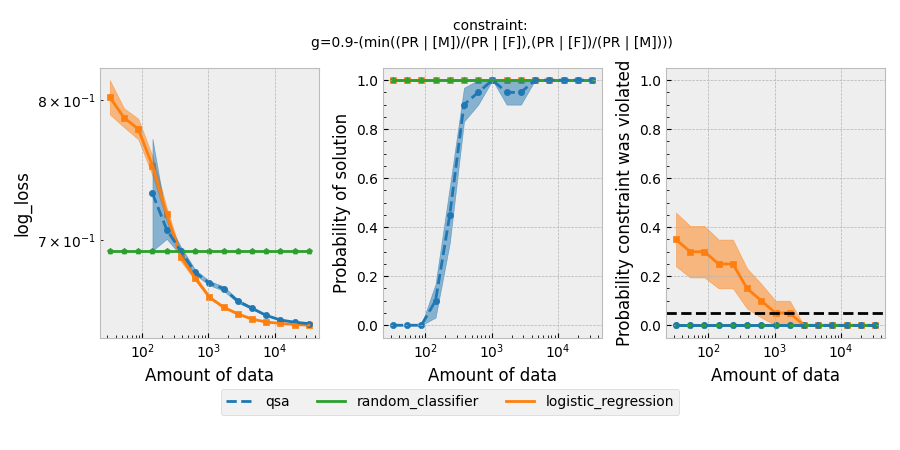
Figure 2: Seldonian Experiments using disparate impact and equalized odds as the definition of fairness on the disability attribute.
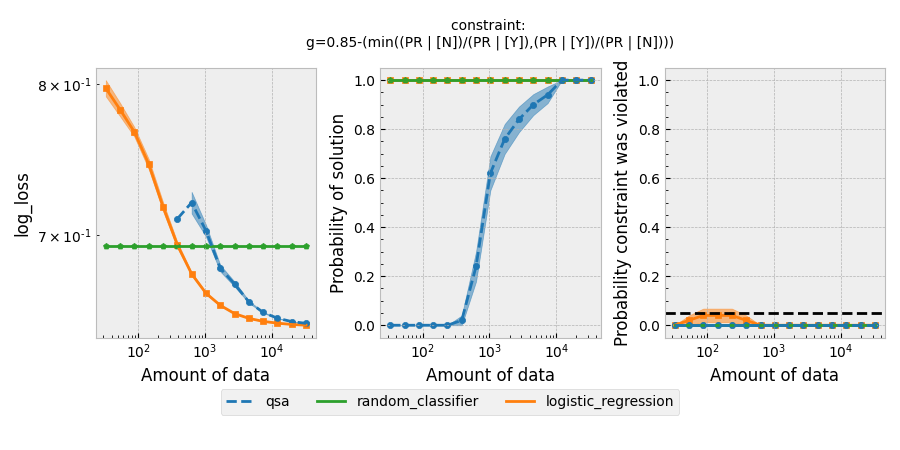
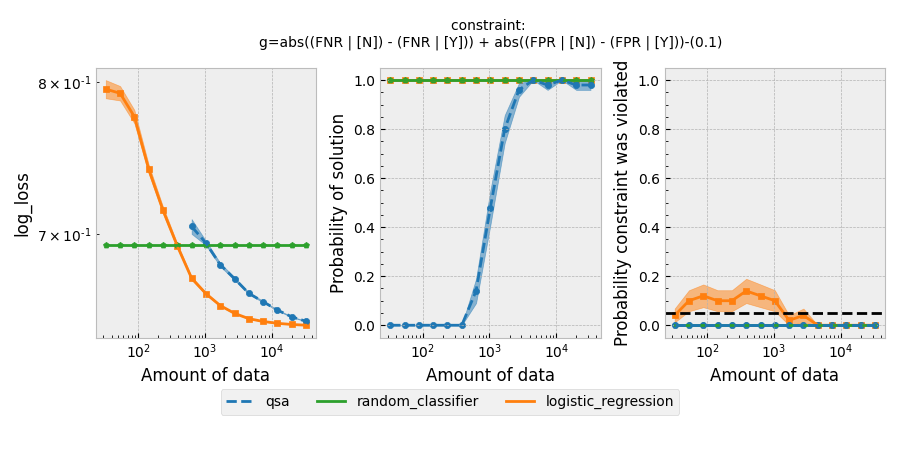
Figure 3: Seldonian Experiments using disparate impact and equalized odds as the definition of fairness on the higher education attribute.
We compare the performance of our quasi-Seldonian algorithm (QSA)(blue) with the random classifier (green) and logistic_regression (orange) models. The points and bands in each sub-graph denotes the mean value computed across 50 trials.
These are various fairness metrics that can be used to evaluate the fairness of machine learning models. Each metric measures a different aspect of fairness and aims to ensure that the model does not discriminate against any particular group.
-
Disparate impact: This metric measures the ratio of the rate at which the positive outcome (such as getting a loan or being hired) occurs for one group (e.g., males) to the rate at which it occurs for another group (e.g., females). A value of 1 indicates no disparity, while a value less than 1 indicates that one group is less likely to receive the positive outcome.
$min((PR | [M])/(PR | [F]),(PR | [F])/(PR | [M])) >= 0.8$ -
Demographic parity: This metric measures the difference between the rate at which the positive outcome occurs for one group compared to another. A value of 0 indicates no difference, while a value greater than 0 indicates that one group is more likely to receive the positive outcome.
$abs((PR | [M]) - (PR | [F])) <= 0.2$ -
Equalized odds: This metric measures the difference in error rates between the groups. It requires that the false negative rate (FNR) and false positive rate (FPR) are similar across the groups.
$abs((FNR | [M]) - (FNR | [F])) + abs((FPR | [M]) - (FPR | [F])) <= 0.35$ -
Equal opportunity: This metric measures the difference in the FNR between the groups. It requires that the model makes false negatives at a similar rate across the groups.
$abs((FNR | [M]) - (FNR | [F])) <= 0.2$ -
Predictive equality: This metric measures the difference in the FPR between the groups. It requires that the model makes false positives at a similar rate across the groups.
$abs((FPR | [M]) - (FPR | [F])) <= 0.2$ -
Treatment of equality: This metric measures the ratio of the FNR to the FPR between the groups. It requires that the ratio is similar across the groups.
$abs((FNR | [M])/(FPR | [M])-(FNR | [F])/(FPR | [F])) <= 0.2$ -
Overall accuracy equality: This metric measures the difference in the overall accuracy of the model between the groups.
$abs((TPR | [M])+(TNR | [M])-((TPR | [F])+(TNR | [F]))) <= 0.2$
In the context of building a fair online education system, the Seldonian algorithm can be used to ensure that the system does not discriminate against certain student demographics, such as gender, age, disability, etc. The algorithm achieves this by adding constraints to the learning process that ensure that the predictions made by the model are fair across these demographics.
For example, suppose we want to ensure that our online education system is fair with respect to gender. We can add a constraint to the learning process that ensures that the system's predictions are not biased towards one gender. We can formulate this constraint using the concept of "disparate impact," which measures the ratio of the rate at which a positive outcome occurs for one gender to the rate at which it occurs for the other gender. We can set a threshold for this ratio, and then add a constraint to the learning process that ensures that the ratio does not fall below this threshold.
The Seldonian algorithm optimizes the model to minimize the prediction error subject to these constraints. This ensures that the model is not only accurate but also fair across various student demographics.
In this tutorial, we implemented the Seldonian Toolkit on the OULAD dataset, building a classifier which predicts the success of a student in a given course. We played around with a variety of constraints, both differing in constraint format and the attribute considered for fairness. We compared the performance of the Seldonian Algorithm with respect to that of a Random Classifier and a Logistic Regression model with the help of experiments library. For the case of higher_ed, as the performance of the Seldonian Algorithm approaches that of a logistic regression model without constraints, the logistic regression model violates the fairness constraints very often, while the QSA algorithm always respects the fairness bounds and delivering similar performance.
