Tools for building custom lint rules.

You can read the latest blog post or watch the advanced use case with custom_lint video.
Lint rules are a powerful way to improve the maintainability of a project. The more, the merrier! But while Dart offers a wide variety of lint rules by default, it cannot reasonably include every possible lint. For example, Dart does not include lints related to third-party packages.
Custom_lint fixes that by allowing package authors to write custom lint rules.
Custom_lint is similar to analyzer_plugin, but goes deeper by trying to provide a better developer experience.
That includes:
- A command-line to obtain the list of lints in your CI without having to write a command line yourself.
- A simplified project setup:
No need to deal with the
analyzerserver or error handling. Custom_lint takes care of that for you, so that you can focus on writing lints. - Debugger support. Inspect your lints using the Dart debugger and place breakpoints.
- Supports hot-reload/hot-restart: Updating the source code of a linter plugin will dynamically restart it, without having to restart your IDE/analyzer server.
- Built-in support for
// ignore:and// ignore_for_file:. - Built-in testing mechanism using
// expect_lint. See Testing your plugins using expect_lint - Support for
print(...)and exceptions: If your plugin somehow throws or print debug messages, custom_lint will generate a log file with the messages/errors.
Using custom_lint is split in two parts:
- how to define a custom_lint package
- how users can install our package in their application to see our newly defined lints
To create a custom lint, you will need two things:
-
updating your
pubspec.yamlto includecustom_lint_builderas a dependency:# pubspec.yaml name: my_custom_lint_package environment: sdk: ">=2.16.0 <3.0.0" dependencies: # we will use analyzer for inspecting Dart files analyzer: analyzer_plugin: # custom_lint_builder will give us tools for writing lints custom_lint_builder:
-
create a
lib/<my_package_name>.dartfile in your project with the following:// This is the entrypoint of our custom linter PluginBase createPlugin() => _ExampleLinter(); /// A plugin class is used to list all the assists/lints defined by a plugin. class _ExampleLinter extends PluginBase { /// We list all the custom warnings/infos/errors @override List<LintRule> getLintRules(CustomLintConfigs configs) => [ MyCustomLintCode(), ]; } class MyCustomLintCode extends DartLintRule { MyCustomLintCode() : super(code: _code); /// Metadata about the warning that will show-up in the IDE. /// This is used for `// ignore: code` and enabling/disabling the lint static const _code = LintCode( name: 'my_custom_lint_code', problemMessage: 'This is the description of our custom lint', ); @override void run( CustomLintResolver resolver, ErrorReporter reporter, CustomLintContext context, ) { // Our lint will highlight all variable declarations with our custom warning. context.registry.addVariableDeclaration((node) { // "node" exposes metadata about the variable declaration. We could // check "node" to show the lint only in some conditions. // This line tells custom_lint to render a waring at the location of "node". // And the warning shown will use our `code` variable defined above as description. reporter.reportErrorForNode(code, node); }); } }
That's it for defining a custom lint package!
If you're looking for a more advanced example, see the example. This example implements:
- a lint appearing on all variables of a specific type
- a quick fix for that lint
- an "assist" for providing refactoring options.
Let's now use it in an application.
For users to run custom_lint packages, there are a few steps:
-
The application must contain an
analysis_options.yamlwith the following:analyzer: plugins: - custom_lint
-
The application also needs to add
custom_lintand our package(s) as dev dependency in their application:# The pubspec.yaml of an application using our lints name: example_app environment: sdk: ">=2.16.0 <3.0.0" dev_dependencies: custom_lint: my_custom_lint_package:
That's all!
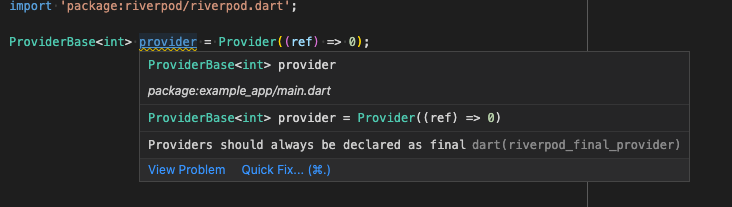
After running pub get (and possibly restarting their IDE), users should now
see our custom lints in their Dart files:
Unfortunately, running dart analyze does not pick up our newly defined lints.
We need a separate command for this.
To do that, users of our custom lint package can run the following inside their terminal:
$ dart run custom_lint
  lib/main.dart:0:0 • This is the description of our custom lint • my_custom_lint_code
If you are working on a Flutter project, run flutter pub run custom_lint instead.
To debug plugins in custom_lint, you need to connect to plugins using "attach"
mode in your IDE (cmd+shift+p + Debug: attach to Dart process in VSCode).
When using this command, you will need a VM service URI provided by custom_lint.
There are two possible ways to obtain one:
- if you started your plugin using
custom_lint --watch, it should be visible in the console output. - if your plugin is started by your IDE, you can open the
custom_lint.logfile that custom_lint created next to thepubspec.yamlof your analyzed projects.
In both cases, what you're looking for is logs similar to:
The Dart VM service is listening on http://127.0.0.1:60671/9DS43lRMY90=/
The Dart DevTools debugger and profiler is available at: http://127.0.0.1:60671/9DS43lRMY90=/devtools/#/?uri=ws%3A%2F%2F127.0.0.1%3A60671%2F9DS43lRMY90%3D%2Fws
What you'll want is the first URI. In this example, that is http://127.0.0.1:60671/9DS43lRMY90=/.
You can then pass this to your IDE, which should now be able to attach to the
plugin.
Custom_lint comes with an official testing mechanism for asserting that your plugins correctly work.
Testing your plugins is straightforward: Simply write a file that should contain
lints from your plugin (such as the example folder). Then, using a syntax
similar to // ignore, write a // expect_lint: code in the line before
your lint:
// expect_lint: riverpod_final_provider
var provider = Provider(...);
When doing this, there are two possible cases:
- The line after the
expect_lintcorrectly contains the expected lint. In that case, the lint is ignored (similarly to if we used// ignore) - The next line does not contain the lint.
In that case, the
expect_lintcomment will have an error.
This allows testing your plugins by simply running custom_lint on your test/example folder.
Then, if any expected lint is missing, the command will fail. But if your plugin correctly
emits the lint, the command will succeed.
Built and maintained by Invertase.